Index of Industrial Production: India
This is a collection of articles archived for the excellence of their content. |
Method of calculation
Base year shifted to 2011-12; items’ list revised
New series reflects changes in eco over yrs: Economists, May 13, 2017: The Times of India


The Central Statistics Office (CSO) revamped the index of industrial production on Friday by shifting to a new base year, deleting `irrelevant' items such as calculators, gutka and colour picture tubes, and inducting new items to better reflect changes in the industrial sector over the years.
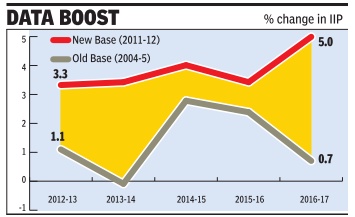
The base year was revised from 2004-05 to 2011-12. As a result, industrial output growth in 2016-17 rose a healthy 5% compared with 0.7% under the 2004-05 base year.
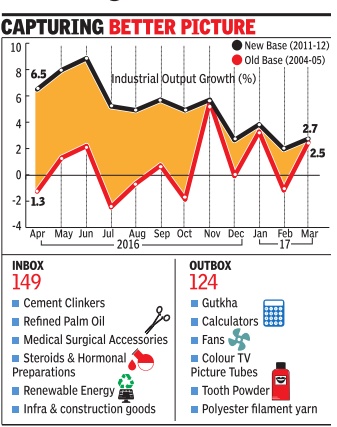
In March, industrial output clocked 2.7% growth, slower than the 5.5% growth posted in March 2016.
As part of the overhaul of industrial output data, the new series has 809 items in the manufacturing sector.The CSO has added 149 new items such as steroids and hormonal preparations, cement clinkers, surgical accessories, prefabricated concrete blocks and refined palm oil while 124 products such as calculators, colour TV picture tubes and gutka have been deleted from the 2004-05 series, which had 620 items.
To reflect the increasing significance of electricity generation from renewable sources, the CSO has also added data from this segment. A new category of in frastructure and con struction goods has been added to the overall industrial data. The coverage of the mining sector has also undergone a change.
Economists said the new series reflects the changes in the economy over the years.“This is much more realistic and more or less closer to the new GDP data,“ Pronob Sen, former chief statistician said. But he called for faster revision to better capture the changes in the economy.
“Even this revision is outdated by 6 years as we are in 2017-18. The work on the next revision should start right away ,“ he said. Economists have called for revision of the industrial output data given the volatility in the 2004-05 series and the inclusion of obsolete items in the product mix used for calculating the key data.
The government has also set up a technical review committee, headed by the secretary , statistics, which will monitor the data and help in revising the list of products and the panel of factories. The panel will meet at least once a year for identifying new items that need to be included in the basket of products and those that need to be dropped. “The new series shows higher growth rates compared with the old series which can be attributed to shifting of base to a more recent period, increase in number of factories in the data and help in revising the list of products and the panel of factories. The panel will meet at least once a year to identify new items that need to be included in the basket of products and those that need to be dropped.
“The new series shows higher growth rates compared with the old series, which can be attributed to shifting of base to a more recent period, increase in the number of factories in the panel for reporting data and inclusion of new items and exclusion of old ones,“ said Madan Sabnavis, chief economist at Care Ratings.
“In FY17, as per the new series, industrial growth improved to 5%. Overall industrial activity is expected to witness expansion in this fiscal year owing to improved demand from across sectors.Thus we expect the industrial output to grow by a similar range of 5-6% in FY 18,“ Sabnavis said.
2012-19

From: Nov 12, 2019: The Times of India
See graphic:
YOY Growth (%) in Index of Industrial Production, October- November 2019; Capital Goods (-20.7%) and Consumer Durables (-9.9%) are particularly badly hit, 2012-19