Public Health And Vital Statistics: India (Main, post-1947 page)
This is a collection of articles archived for the excellence of their content. |
The major ailments
Health hazards
1990-2016
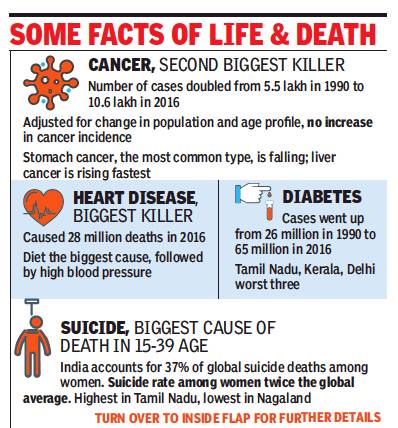
From: DurgeshNandan Jha, Cancer rate static, but number of cases rising as India ages, September 13, 2018: The Times of India
Child and maternal malnutrition continues to be the biggest health hazard in India since 1990, while deteriorating air quality came a close second, according to a recent report in one of the world’s oldest medical journals.
The report published in the Lancet journal has found that besides malnutrition and rising air pollution, dietary risks, high systolic blood pressure and diabetes were other major risk factors in India in 2016. In 1990, air pollution was the third largest risk factor in the country but it moved to the second rank in 2016.
The report also analyses the variations in epidemiological transition – a change in mortality rates brought about by medical advancements – across Indian states. According to the findings, underdeveloped states, including Bihar, Jharkhand, Uttar Pradesh, Rajasthan, Madhya Pradesh and Haryana have recorded a low epidemiological transition level (ETL), and thereby suffer from a higher health burden from these risk factors.
Delhi may be one of the most polluted cities but it faces a marginally lower health impacts, when compared to states like Bihar. If calculated in terms of life years lost due to air pollution, or what medical experts call disability adjusted life years (DALYs), Delhi has a DALY rate of 1890, when compared to Bihar (4308) and Uttar Pradesh (4390).
A Centre for Science and Environment (CSE) researcher, who analysed the data for Delhi said, “Diseases that are triggered by air pollution including cardiovascular diseases, chronic respiratory diseases (COPD), and cancers have shown dramatic increase since 1990. In 1990 COPD was ranked 13 among leading causes of illness and lost life years. But this has now shot up to rank 3. Similarly, Ischaemic heart disease that is greatly influenced by air pollution has gone up from rank 5 to number 1, diabetes from rank 22 to rank 5 and stroke from rank 16 to rank 15.”
Explaining the reason for such variations, Bhargav Krishna, a research fellow at Public Health Foundation of India, said, “The population in these states may be suffering higher comorbidities – the presence additional diseases or disorders related to the main disease. The use of solid fuels, a major contributor to air pollution is also higher in these states.”
Medical experts led by the Indian Council of Medical Research (ICMR) and Institute of Health Metrics and Evaluation (IHME), who conducted the study, confirmed that number of death and disability caused by diarrhoea and other communicable diseases have declined, but diseases closely linked with air pollution and smoking, including heart ailments, have increased significantly.
Another report released by the Lancet Commission said each year over 9 million deaths occur worldwide due to air and water pollution.
Air pollution is at the top of the list contributing to over 6 million deaths. India remains one of the worst affected countries where 1.9 million premature deaths occur due to deteriorating ambient air quality.
The report published in Lancet has found that besides malnutrition and rising air pollution, dietary risks, high systolic blood pressure and diabetes were other major risk factors in India in 2016. In 1990, air pollution was the third-largest risk factor in the country but it moved to the second rank in 2016
Heart attacks, lung obstruction, strokes
2005-15
Together Account For One-Third Of All Deaths
Heart attacks, lung obstruction and strokes are the three top causes of death in India, accounting for over one-third of deaths. Along with diabetes and chronic kidney diseases, they make five non-communicable diseases that are part of the top ten causes of death.
Communicable diseases in the top 10 include lower respiratory tract diseases like bronchitis and pneumonia, diarrhoea, TB and diseases occurring to prematurely born babies. Road injuries are the tenth most prevalent cause of death. Together, these 10 make up 60% of the 10.3 million deaths every year.
The even mix of communicable diseases and non communicable ones caused by organs failing due to age or lifestyle choices, puts India in the middle of a disease transition seen across the world.
These results are from the Global Burden of Diseases 2015, an estimation of 249 causes of death in 195 countries by an international team of researchers led by the Seattle-based Institute of Health Metrics and Evaluation, and published recently in Lancet. “With improvement in tre atment by antibiotics and better understanding, deaths by infectious diseases have declined while sedentary lives, longer lifespans and other lifestyle habits have pushed up the proportion of non-communicable diseases in India,“ said Dr Amit Sengupta, an expert affiliated to the Peoples' Health Movement. The persistence of three eminently treatable in fectious diseases and the lack of care in eliminating preterm baby deaths points to the still lagging healthcare system, as also lack of safe drinking water and sanitation,“ he added.
India's position in the middle of the transition from a poor, healthcare-deficient country to an advanced country is brought out starkly when compared with examples from such countries.In Niger, one of the poorest countries in the world, with a per capita gross domestic product less than one-fifth of India's, eight of the top ten causes of death are communicable diseases. At the other extreme, Norway , with per capita gross domestic product over ten times that of India, has just one communicable disease -lower respiratory tract infections -among its top ten, with the other nine being non-communicable diseases.
China, which started off from conditions similar to India, has moved much further towards the advanced end of the transition. It too has only one infectious diseases among its top ten causes of death.
Both India and China have road injuries as one of the major causes of death due to large populations and a rapidly growing number of vehicles on the roads. The large number of types of vehicles (from cycles and bullock carts to fast moving cars) also contributes to high number of road injuries.
A striking feature of India's death-causing diseases profile is that all the noncommunicable diseases are increasing while all the infectious diseases are declining compared with a decade ago. Diabetes as a cause of death has grown at a chilling 35% between 2005 and 2015, chronic kidney disease by 21% and heart attacks by 17% even as communicable disease deaths have dropped by 20 to 30% while preterm baby deaths dropped by 40%.
The most widespread maladies:
2007-16: food deficiencies, TB
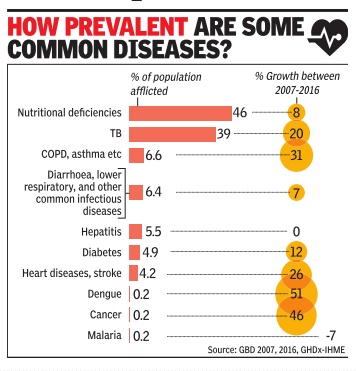
Diabetes Affects 5% Indians, Cancer 0.15%
It is common -and natural -to think of diseases in terms of death. Often, diseases are measured by death -so many people die of heart attacks, so many of dengue, etc. While this is important, there is another dimension not measured by body counts.It is the scale of suffering and pain felt by people who live with diseases.
Talk to any middle class urban Indian and they will know of somebody who has had cancer. So, is cancer wildly spreading in India? In the last decade, the number of people with cancer has increased 46%, one of the fastest spreads. Part of it is due to much better identification, part because of longer life, and a part also because of lifestyle and diet choices.
But here's the thing: Cancer affects 0.15% of all Indians and deaths due to it were 8% of all deaths in 2016. It's deadly , it's spreading, but cancer is nowhere near as prevalent as we perceive anecdotally .
The two health conditions that affect most Indians are nutritional deficiencies of various kinds, like protein, vitamin, iron and others -about 46% of the population suffers from this affliction -and tuberculosis, which affects nearly 39% of the population. Heart and blood circulation related diseases and diabetes are two examples of really big diseases in India. They are also non-communicable like cancer, that is, they don't spread through external agents. Heart diseases affect 5.5 crore people and diabetes some 6.5 crore. Both cause huge loss to quality of life and limit the ability of patients to lead a productive life. Death rates are much more in the case of heart diseases, as they affect seniors more and treatments are expensive. Diabetes causes suffering and if neglected, death.But only about 3% of deaths are due to diabetes in itself.
This emerges from the recently released 2016 edition of the Global Burden of Disease data in the medical journal Lancet, and made available spanning several years by the Seattle-based Institute of Health Metrics and Evaluation. Indian data is collated from domestic surveys, registries, cause of death data and unit level SRS data recently made accessible by the government to GBD.
Two health conditions that are incredible in scale and sweep in India are none of the above. The biggest debilitating health condition is nutritional deficiencies of various kinds like protein, vitamin, iron and others. Over 60 crore people, or about 46% of the population suffers from this affliction.Lethargy , exhaustion, weakness, inability to concentrate are some of the common and preliminary symptoms. In children, it causes serious damage to both mental and physical growth. This is a completely `curable' condition because just a better diet would eliminate most of it. Over the past decade, it has increased at 8%.
Another big ticket disease is TB affecting nearly 52 crore people (39%). Although death rates have declined by nearly a third, TB's spread has increased by 20% in a decade. Infections, including those that cause diarrhoea or coughs, cause immense suffering to over 8 crore people (6.4%). Many other diseases are very widely spread, like skin diseases and neurological diseases.Gynecological disorders and infant diseases are also common.Policy makers need to think about prevalence as much as deaths by these diseases.
1990- 2019
Sushmi Dey, July 15, 2021: The Times of India
The share of non-communicable and injury-related neurological disorders such as stroke, headache disorders, and epilepsy to the total disease burden has more than doubled —from 4% to 8.2% — in India between 1990 to 2019, whereas the contribution of communicable neurological disorders reduced during this period by threequarters, a new scientific paper published in the Lancet Global Health shows.
The paper highlighted aging as one of the main factors behind increasing burden of non-communicable neurological disorders. The paper is a collaborative effort between the Indian Council of Medical Research (ICMR), Public Health Foundation of India (PHFI), Institute for Health Metrics and Evaluation (IHME) and a number of other organisations.
Stroke (37.9%), headache disorders (17.5%), and epilepsy (11.3%) are the leading contributors to neurological disorders burden in India, with stroke having caused 6,99,000 deaths in India in 2019, which was 7.4% of the total deaths in the country. Stroke also caused 68% of deaths due to neurological disorders, followed by Alzheimer’s and other dementias (12%), and encephalitis (5%).
The total burden of neurological disorders due to noncommunicable disorders is 82.8%; 11.2% is due to communicable and 6% is injury-related disorders, the paper says. The paper underlined high blood pressure, air pollution, dietary risks, high fasting plasma glucose, and high body-mass index as the leading contributors to neurological disorders.
“The rise of non-communicable disease related risk factors, as leading contributors to neurological disorders and resultant disability in India, is not a surprise. It reflects the demographics, socio-economic and nutrition transitions that have steered the shift in our epidemiological profile over the past 30 years,” PHFI president K Srinath Reddy said. While communicable diseases contributed to the majority of total neurological disorders burden in children below 5 years age, non-communicable neurological disorders were the highest contributor in all other age groups.
Communicable neurological disorders include encephalitis, meningitis, and tetanus, whereas injury-related neurological disorders include traumatic brain injuries and spinal cord injuries.
Health indicators
1947> 2020

Total fertility rate;
median age of population;
life expectancy;
infant mortality rate
From: Nov 23, 2021: The Times of India
See graphic:
India in 1947 vis-à-vis 2020:
Total fertility rate;
median age of population;
life expectancy;
infant mortality rate
2005 to 2015: significant improvement in health indicators
Sushmi Dey, India got healthier in last 10 yrs: Study , March 1, 2017: The Times of India
India's health indicators show significant improvement over the last decade with a decline in infant mortality complimented by a better sex ratio, more institutional deliveries and wider vaccine coverage.
The population rate is also a showing positive change, according to the new set of government data gathered during the fourth phase of National Family Health Survey .“The results show that if we invest and design good programmes in health, results will follow,“ health secretary C K Mishra said.
Haryana projected a commendable change in its sex ra tio at birth. While 762 females were born per 1,000 males in Haryana during NFHS 3 (2005-06), the ratio improved to 836 females per 1,000 males in the survey in 2014-15.
But the sex ratio at birth improved marginally nationally with 919 females born against 1,000 males during the fourth phase of the survey . During 2005-06, 914 females were born per 1,000 males. India's total fertility rate also declined to 2.2 from 2.7 over last decade, inching closer to the replacement level of 2.1. Overall, the level declined by 1.2 children per woman from NFHS 1 to NFHS 4. The data shows Uttar Pradesh showcased maximum decline in TFR, which dropped from 2.7 to 1.1in last eight years. Infant mortality rate declined from 57 to 41 per 1,000 live births between the third and the fourth phase of the survey. The institutional deliveries witnessed a dramatic growth of 40 percentage points from 38.7% in NFHS 3 to 78.9% in NFHS 4. Institutional births in public health facilities increased by 34.1% during the period.
The immunisation coverage across the country improved to almost 70% of fully immunised children at present from 44% in 2005-06.
India recorded a 10 percentage point decline in stunting from 48% during the third phase of the survey to 38.4% in the fourth round.Percentage of under-weight children declined from 42.5% to 35.7% in eight years.
C-sections falling in govt hospitals
C-section deliveries are increasing rapidly in private hospitals across the country, whereas public hospitals have recorded a decline over the last decade, shows data from the fourth phase of the National Family Health Survey. In private hospitals, C-section surgeries increased from 27.7% in NFHS3 to 40.9% in the fourth phase, whereas in public hospitals it declined from 15.2% to 11.9% during the period. Sushmi Dey TNN
Ageing
Indians feel old earlier than Japanese, Swiss/ 2019
March 12, 2019: The Times of India
People Below 60 In India Experience Same Health Disorders That 76-Yr-Olds Face In Japan & Switzerland: Study
People living in India experience the health problems associated with ageing at an early stage than those living in Japan or Switzerland, according to a first-ofits-kind study published in The Lancet Public Health.
Researchers at the University of Washington in the US and colleagues found that a 30-year gap separates countries with the highest and lowest ages at which people experience the health problems of a 65-year-old. They found 76-yearolds in Japan and Switzerland, and 46-year-olds in Papua New Guinea have the same level of age-related health problems as an “average” person aged 65.
The analysis also found that people living in India experience the similar health problems well before they turn 60.
“These disparate findings show that increased life expectancy at older ages can either be an opportunity or a threat to the overall welfare of populations, depending on the ageing-related health problems the population experiences regardless of chronological age,” said Angela Y Chang, lead author of the study and postdoctoral fellow at the University of Washington.
“Age-related health problems can lead to early retirement, a smaller workforce, and higher health spending. Government leaders and other stakeholders influencing health systems need to consider when people begin suffering the negative effects of ageing,” Chang said.
These negative effects include impaired functions and loss of physical, mental, and cognitive abilities resulting from the 92 conditions analysed, five of which are communicable and 81 non-communicable, along with six injuries.
Where traditional metrics of ageing examine increased longevity, this study explores both chronological age and the pace at which ageing contributes to health deterioration.
The study uses estimates from the Global Burden of Disease study (GBD). The researchers measured “age-related disease burden” by aggregating all disability-adjusted life years (DALYs), a measurement of loss of healthy life, related to the 92 diseases.
Although most countries have similar rankings between age-standardised, age related and all-burden rates, countries such as Ethiopia, Nigeria, and South Africa perform better in age-related disease burden relative to all burden. Countries such as China and India are performing better in all-burden rankings, researchers said.
The findings cover 1990 to 2017 in 195 countries and territories. For example, in 2017, people in Papua New Guinea had the world’s highest rate of age-related health problems with more than 500 DALYs per 1,000 adults, four times that of people in Switzerland with just over 100 DALYs per 1,000 adults.
The rate in the US was 161.5 DALYs per 1,000, giving it a ranking of 53rd, between Algeria at 52nd with 161.0 DALYs per 1,000 and Iran at 54th with 164.8 DALYs per 1,000
Resistance to/ 2019
DurgeshNandan Jha, June 5, 2019: The Times of India

From: DurgeshNandan Jha, June 5, 2019: The Times of India
Most healthy Indians resistant to common antibiotics: Study
‘Resistance In 2 Out Of Every 3 Persons Tested’
New Delhi:
A study published by the Indian Council of Medical Research (ICMR) has found antibiotic resistant organisms in the digestive tracts of two out of every three healthy persons that it tested, pointing to a rapid spread of antibiotic resistance in the Indian population.
The study was based on analysis of stool samples of 207 individuals who had not taken any antibiotic for at least a month and did not suffer from any chronic illness.
Isolates taken from 139 of the 207 individuals were found to be resistant to one or more antibiotic class. The maximum resistance was seen for cephalosphorins (60%) and fluoroquinolones (41.5%) – two commonly used antibiotics.
Dr Pallab Ray, professor of medicine microbiology at PGI Chandigarh who led the study, told TOI that the findings should be treated as a warning.
“Our study shows how inappropriate use of antibiotics has transformed the healthy human intestinal gut flora (microorganisms living in the digestive tract) into a reservoir of antibiotic-resistant organisms. At present, these organisms are resistant to low-end antibiotics but if the misuse persists, these may become resistant to high-end antibiotics as well,” Dr Ray said.
In the study, only 2% isolates were found to be multidrug resistant. Dr S K Sarin, director of the Institute of Liver and Biliary Sciences (ILBS) said the presence of antibiotic resistance in healthy individuals was a cause for concern because this signalled that it would get more difficult to treat infections in future.
Self-prescription can lead to drug resistance: Docs
Inappropriate use of antibiotics such as popping pills for mild ailments like common cold is the biggest cause of drug resistance in humans. But there are other factors contributing to this crisis. These include rampant use of antibiotics in livestock and poultry animals, and improper disposal of residual antibiotics that eventually enter the food chain.
“There are as many bacteria in our body as the number of cells. They perform a host of functions to keep the body alive, for example processing the food we eat and modulating the immune system. The antibiotic resistant bacteria aren’t healthy so they cannot perform these functions well. Also, if the bacteria become resistant to commonly available antibiotics, it may get difficult to treat diseases caused by infections involving them,” Dr Sarin said.
In 2015, researchers from AIIMS’ ocular pharmacology division started studying pharmaceutical contamination in the Yamuna to explain the emergence of superbugs.
The team, headed by Dr T Velpandian, analysed water samples from seven places along the river, including its entry and exit points in the city, 35 borewells in Delhi NCR and water percolating through waste at the Ghazipur landfill. They found that the concentration of dissolved drugs in the river water increased as the Yamuna made its way through the city.
“We need a multi-pronged strategy to contain this crisis. It should include stopping misuse of the drugs in humans, animals and proper disposal mechanism so the antibiotics don’t end up in the environment,” Dr Ray said.
Antimicrobial resistance
As in 2020
Malathy Iyer, Sep 5, 2021: The Times of India
From: Malathy Iyer, Sep 5, 2021: The Times of India
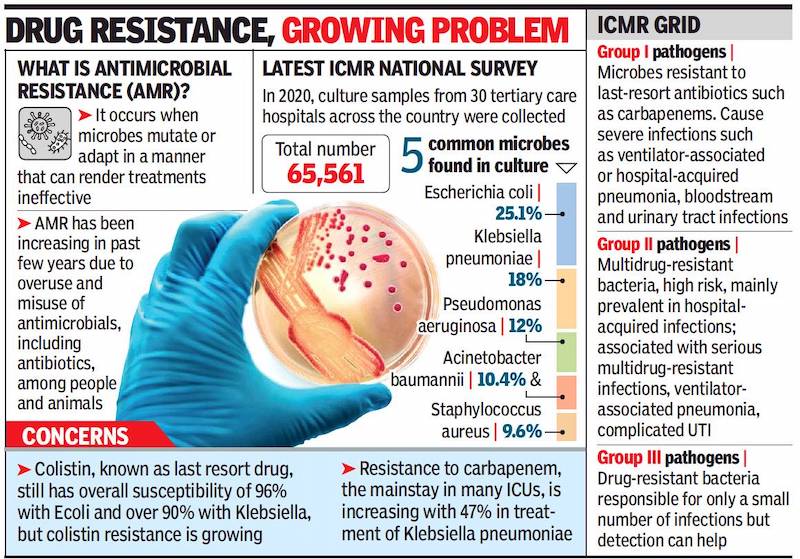
More than 50% of the ICU patients battling a type of pneumonia caused by bacteria Klebsiella pneumoniae will not respond to powerful antibiotics called carbapenem. Another antibiotic, imipenem, will not affect a mutated form of Ecoli in three out of 10 cases.
These are some of the findings of Indian Council of Medical Research’s latest report on ‘antimicrobial resistance research and surveillance’ conducted between January and December 2020, which underlines the growing antimicrobial resistance across India. Mutations in microbes, be they bacterium, viruses or fungi, are rendering medicines useless when the patients most need them; experts say this has been brought about by decades of overuse and misuse of antibiotics, antifungals and antivirals.
As the pandemic dominated 2020, the ICMR data collection too was hit; only 65,000 culture reports could be collected from 30 tertiary care hospitals across India as against 1 lakh samples collected in 2019. Most hospitals were closed to non-Covid patients and only the severely ill ventured to hospitals during Covid.
“The ICMR has brought out an exhaustive AMR report for the fourth time, and while some microbes have become more resistant and others have become more susceptible (to treatment), the overall picture remains the same,” said senior ICMR scientist Dr Kamini Walia, who has been leading the AMR project.
Due to Covid-19, the use of antibiotics increased and scientists fear that resistance will definitely increase in the near future. Dr Rahul Pandit, who heads the ICU in Fortis Hospital, Mulund, said carbapenem resistance is evident in almost 50% of the patients. “When we notice carbapenem resistance, we give the patient the last resort antibiotic, colistin. We have run out of options left with us to treat patients,” said Dr Pandit, who was not associated with the ICMR project. While colistin works in most cases, there are stray cases of resistance being reported.
The ICMR report 2020 said five of the organisms posed a big worry: Escherichia coli (or Ecoli) was found in almost a fourth of the samples, followed by the Klebsiella pneumoniae (18%), pseudomonas aeruginosa (12%), acinetobacter baumannii (10.4%) and staphylococcus aureus (9.6%). “The AMR trends and patterns are worrying. The Covid situation has only made the situation worse,” said Dr Walia.
In the 2020 report, the Ecoli track showed an aberration: Susceptibility of Ecoli to antibiotic Imipenem that had increased from 86% in 2016 to 63% in 2019 showed a slight recovery to 72% in 2020. However, Klebsiella pneumoniae dropped from 65% in 2016 to 46% in 2019 and remained at 45% in 2020.
Acinetobacter baumannii, which causes a relatively simple infection to treat, has emerged as a worry in the past few years, accounting for almost a 10th of the samples in 2020.
Dr Pandit said the need of the hour is to hold an antimicrobial stewardship programme that will lay down stringent rules on use of these drugs. “But such programs work only in hospital settings. In India anyone can prescribe and sell an antibiotic, leading to large-scale misuse and resistance,” he said.
Birth order and the spacing of births
2023
Ambika Pandit, Sep 12, 2025: The Times of India
From: Ambika Pandit, Sep 12, 2025: The Times of India
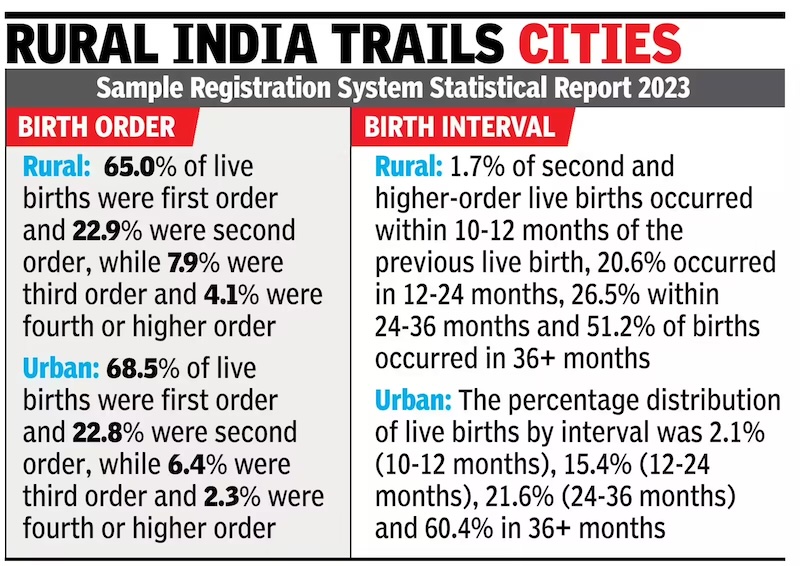
NEW DELHI: Nearly 66% of live births in 2023 were first-order births - a terminology used to refer to the first born - and just 3.6% accounted for fourth or higher order births, according to the Sample Registration System (SRS) Statistical Report 2023. In terms of spacing of births, it stated, 53.6% of second and higher order births occurred 36 months or more after the previous live birth.
Just 1.8% of second and higher-order live births occurred within 10-12 months of the previous live birth.
The birth order - related to the chronological sequence of a child's birth within a family, such as first-born, middle child or youngest - and birth interval are seen as a critical information on spacing of children and level of fertility. They are are also important factors for the wellbeing of a mother and her child's development.In 2022 in India, 64% of current live births were first-order births, 23% second-order births, 8.3% third-order births and 4.7% fourth or higher-order births.
The data for 2023 showed that 66% of current live births were first-order births, 22.9% second-order births, 7.5% third-order births and 3.6% fourth or higher-order births. Among the bigger states and UTs, Telangana had the highest percentage (82.4) of first-order births, while Kerala the lowest at 47.5%.
Kerala had the highest percentage of second and third order births at 34.9% and 13.3%, respectively. Telangana had the lowest second and third order births at 13.8% and 3.2%, respectively. Madhya Pradesh has the highest percentage of fourth or higher-order births at 6.7%, while Andhra Pradesh has the lowest at 0.4%.
Data on birth intervals showed 1.8% of second & higher-order live-births occurred within 10-12 months of the previous live birth in India, 19.3% within 12-24 months, 25.3% within 24-36 months, & 53.6% occurred 36 months or more after the previous live birth.
At the state level, the percentage of second and higher-order live-births occurred within 10-12 months of the previous live birth and ranged from nil in J&K to 3.3% in Andhra Pradesh. The percentage of second and higher-order live-births that occurred after 36 months or more after the previous live birth ranged from 37.3% in Andhra Pradesh to 82.9% in West Bengal.
In the past too research drawing from govt data like the National Family Health Survey-5 (2019-21) has drawn attention to the urgent need for spacing methods in family planning to improve health outcomes and highlighted that inter-pregnancy intervals (IPI) shorter than 12 months are a risk factor for diarrhoea and acute respiratory infections. Also, IPIs shorter than 12 months and 12-17 months have been cited as risk factor for stunting and underweight among under-5 children in India.
Cleanliness (Swachh mission)
2015-19: malaria, diarrhoea decline
July 5, 2019: The Times of India
From: July 5, 2019: The Times of India
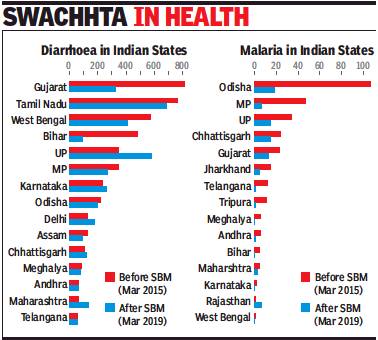
Diarrhoea and malaria cases have dropped significantly among children below five years, in sync with increase in household toilet coverage in rural areas between 2014 and 2019, the Economic Survey says, underscoring the role of behavioral economics in influencing positive outcomes. Investments in sanitation and hygiene are seen to improve health and thereby productivity at both the individual and national level.
Highlighting health benefits of the government’s cleanliness drive, the survey recommends focusing on 100% disposal of solid and liquid waste, and the need to clean up rivers. It has suggested taking behavioural change to the next level with the aim of “Sundar Bharat via Swasth Bharat”.
In order to assess the impact of the Swachh mission, the government divided 500 districts into two groups — one where household toilet coverage was less than 33.5% in 2014 and the other where coverage was high. Cases of still birth, low birth weight and diarrhoea and malaria in children below five years were tracked from March 2015 to March 2019. By March this year, toilet coverage in rural India was over 95%.
According to the report, diarrhoea cases dropped from 6,968 in 2015 to 5,683 in the first set of districts, and from 5,262 to 4,550 in the second. Interestingly, however, while such cases decreased in most states — including Gujarat, TN, West Bengal, Bihar and MP — there was a spike in UP, Maharashtra, Karnataka and Delhi. The report doesn’t say why. Diarrhoea is a leading cause of deaths of children under five years, accounting for 11% of fatalities in 2013.
Malaria cases, too, dropped significantly after toilet coverage crossed 95%. Rajasthan was the only exception where malaria cases increased.
Cystic fibrosis
Prevalence higher than previously believed/ 2019?
November 8, 2020: The Times of India
Indians may have a higher prevalence of cystic fibrosis
New Delhi:
The prevalence of cystic fibrosis (CF) — a genetic disorder — in India could be higher than previously believed, showed a study conducted by Sir Ganga Ram hospital.
Cystic fibrosis is an inherited life-threatening disorder that damages the lungs and digestive system. It affects cells that produce mucus, sweat and digestive juices, causing the fluids to become thick and sticky. As a result, the respiratory passageways get blocked.
The study, published in the BMC Medical Genetics of London, was conducted among 200 individuals — 101 men and 99 women. They were visiting the hospital’s gynaecology out-patient clinic for various reasons unrelated to genetic disorders.
According to the doctors, for the first time, a high carrier frequency of 4.5% for CF has been revealed. The study showed a high carrier frequency for genetic forms of deafness and Pompe disease. Carrier status does not mean affected by the disease. If both husband and wife are carriers, then there is a 25% chance of their children suffering from the disease. Based on this carrier rate, the prevalence of CF would be as high as one in 2,000 newborns, doctors said. “Based on this study, cystic fibrosis should be added to the list of diseases like beta thalassemia and spinal muscular disorders that should be screened in all pregnant women to prevent these diseases. It should also be added to the list of disorders for newborn screening too. Sir Ganga Ram Hospital is planning to add CF to the existing newborn screening programme,” said I C Verma, senior consultant and advisor at the Institute of Medical Genetics and Genomics of the hospital.
Meanwhile, Sunita Bijarnia-Mahay, senior consultant at the Institute of Medical Genetics & Genomics, said, “Our study also found that the diseasecausing pathogenic variants in the Indian population were different from those commonly observed in the West. It is because of our unique system of marriages within the same caste/community and presence of consanguineous marriages”
Patients with CF inherit mutated copies of genes from both the parents. If one inherits one copy, then the patient is asymptomatic but is a carrier. This means there is a chance he or she can pass it to the children, if his partner is also a carrier. There is no cure for CF, but medication and other therapies can ease the symptoms and prolong life. The only way it can be prevented is by genetic screening.
Antibiotic usage
2015
December 22, 2017: The Times of India

From: December 22, 2017: The Times of India
See graphic:
India and the world: Antibiotic usage in 2015
Anti-microbial resistance (AMR), or the resistance of infection-causing microorganisms to drugs that were originally effective for their treatment, is not a problem of the future but one that is unfolding with such an alarming ferocity that medical experts say it won’t be long before treating the simplest of infections becomes a nightmare while procedures such as organ transplantation and chemotherapy are rendered risky. India is especially at danger of an explosion of AMR.
Deaths
The leading causes
2016
More young people in the age group of 15 to 39 years in the country died owing to suicides than any other cause last year, according to a report titled ‘India: Health of the Nation’s States 2017’, released by the Union health ministry.
The report, prepared by the ministry’s department of health research in association with the Indian Council of Medical Research (ICMR), Public Health Foundation of India and Institute for Health Metrics and Evaluation, found that “self-harm, which includes suicides and other nonfatal outcomes, was one of the leading contributors to the injury burden in India.”
As many as 18 of the states and Union Territories surveyed in the report recorded maximum deaths of youths due to suicide rather than diseases like TB, AIDS or cancer in 2016. Leading the list was Tripura, which recorded 25.2% of the total deaths in the age group of 15 to 39 years in 2016 due to self-harm, followed by Tamil Nadu (25%),Kerala
(24.4%), Karnataka (22.9%) and West Bengal (20.6%). Among other states with high suicide rates were Maharashtra (16.2%), Himachal Pradesh
(15.4%), Sikkim (14.6%), Meghalaya (14.1%) and UP (13.6%) Self-harm caused 29.8% more disease burden in 2016 than in 1990, according to the report which added that the trend had “increased among both sexes in the past 26 years although it was more among men than women.” The study indicated “lifestyle changes that come with a rapidly industrialising, urbanising society, from changes in diet and activity level to more traffic on the roads, were possible reasons behind the trend.
Lalit Dandona, distinguished professor at the Public Health Foundation of India told TOI that “further exploration on the reasons will be done in the next stage of the report which will be out in a couple of months”. Studies by other organisations in the past few years too have shown suicide as the leading cause of death among youngsters in India. The Lancet Commission on Adolescent Health and Wellbeing, in a study of 10- to 24-year-olds in the country in 2013, reported 62,960 suchdeaths.
According to the Global Burden of Disease Study 2013, that tracked deaths from 306 diseases, injuries and risk factors in 188 nations, suicide was reported as the biggest killer of 15- to 24-year-olds in India, followed by road accidents.
The report also lists road mishaps as a leading cause of death of the country’s youth population with north India reporting maximum casualties in accident deaths.
2016
See graphic:
Top 10 causes of deaths in India, and worldwide, 2016

2016/ B

From: Lifestyle diseases biggest killer even in most backward states, November 15, 2017: The Times of India

From: Lifestyle diseases biggest killer even in most backward states, November 16, 2017: The Times of India
Lifestyle diseases like heart and chronic respiratory diseases now kill more people than communicable ones like tubercolosis or diarrhoea in every state in India, including the most backward. This was revealed in the India State-Level Disease Burden Initiative’s Report.
The report notes that while all states have thus made what’s called the ‘epidemiological transition’ there remain wide variations in their disease profiles with some having made that transition as early as 1986, and others as recently as 2010.
The first group to make the transition in 1986 included Kerala, Tamil Nadu, Goa, Himachal Pradesh and Punjab. The last group to do so, accounting for the highest number of people (588 million), made the transition almost a quarter of a century later, in 2010. This group included Bihar, Uttar Pradesh, Madhya Pradesh, Chhattisgarh, Jharkhand, Rajasthan and Odisha. India as a country made the transition in 2003.
The report studies the period from 1990 to 2016 and shows that communicable diseases constitute almost two-thirds of the disease burden in India from a little over a third in 1990. Despite the transition, which is associated with development, malnutrition remains the single top risk for health loss.
“While the disease burden due to child and maternal malnutrition has dropped in India substantially since 1990, this is still the single largest risk factor responsible for 15% of the total disease burden in India in 2016,” noted the report.
Diarrhoea, TB among top causes of death along with road injuries
The disease burden due to child and maternal malnutrition in India was 12 times higher per person than in China in 2016. Kerala had the lowest burden due to this risk among the Indian states, but even this was 2.7 times higher per person than in China.
The leading individual cause of death in India in 2016 was ischaemic heart disease, the death rate from which was twice as much as the next leading cause. But there were wide variations with the highest death rate among the states from this disease being 12 times the lowest. The other non-communicable diseases (NCD) in the top 10 individual causes of death included chronic obstructive pulmonary disease (COPD), stroke, diabetes, and chronic kidney disease.
Communicable diseases such as diarrhoeal diseases, lower respiratory infections, and tuberculosis, and road injuries and suicides were also in the top 10 causes of death. The death rates from diarrhoeal diseases and tuberculosis were also higher in the least developed states and had a 12-fold and seven-fold variation in rates, respectively, between states.
The least developed states that recently transitioned are having to grapple with having a higher burden of NCDs while they continue to have a high burden of infectious and maternal-child diseases, the report pointed out. The India States Disease Burden Initiative is a joint initiative of Indian Council of Medical Research, Public Health Foundation of India and Institute for Health Metrics and Evaluation in collaboration with Union health ministry.
Ischemic heart disease, top cause leading to death
Ischemic heart disease is the top killer across most states, November 15, 2017: The Times of India
From: Ischemic heart disease is the top killer across most states, November 15, 2017: The Times of India
Urbanisation, Aging Population Pose Major Challenge
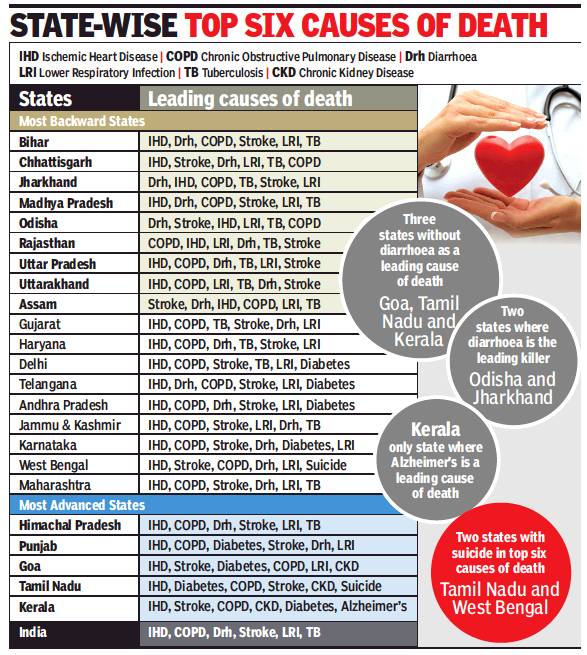
The first ever comprehensive estimate on state-wise burden of diseases brings out the wide variation in disease profile, burden and risk factors of the various states, many of them bigger than most countries in the world. From diarrhoea being the top killer in a couple of states to Alzheimer’s, a corollary of higher life expectancy, making it to a state’s leading causes of death the variation between states is huge.
While all states have transitioned to a disease profile where non-communicable diseases account for the largest share of diseases, barring Tamil Nadu, Kerala and Goa, diarrhoea, a disease of gross underdevelopment, is still among the top killers in every state. Another communicable disease, tuberculosis too continues to figure among the top killers in most states barring the southern states, and Goa and Punjab where it is diabetes which has climbed into the list of top killers.
What is uniform across almost all states is that ischemic heart disease is the top killer except in Assam where it is stroke and in Odisha and Jharkhand where it is diarrhoea. Overall disease burden by diabetes rose the highest in the country, by 174% in the last 26 years, followed by the burden of heart disease which rose by 104%. Jammu and Kashmir, Punjab, Uttarakhand and Haryana saw very high death rate from road injuries even if they did not figure among the top killers in these states.
“The findings show that the overall disease burden per person in some states of India is almost twice as much as in some other states, and the burden rate due to the leading diseases ranges five to ten times between the states,” said vice president Venkaiah Naidu on the occasion of the report launch.
The report identifies two factors that will pose a major challenge to the Indian health system in the coming decades — urbanisation and ageing of the population. All states have started seeing the effects of these two factors and many will see an acceleration of these as unplanned urbanisation picks up pace and life expectancy increases coupled with reduced cases of early deaths.
It remains to be seen how India and its states will cope with these looming challenges.
2017: Main causes of death
Cardiovascular Diseases Most Lethal Killers
Nearly 61% of deaths in India are now attributed to non-communicable diseases (NCDs), including heart disorders, cancer and diabetes, according to data released by the World Health Organisation (WHO) on Monday .Almost 23% of the population is at risk of premature death due to such diseases.
The UN agency has warned countries, including India, against premature deaths caused by NCDs and said governments must immediately step up efforts to tackle them. “Limited na tional progress has been made in the fight against NCDs -primarily cardiovascular and chronic respiratory diseases, cancers and diabetes -which are the world's biggest killers, and claim the lives of 15 million people aged 30 to 70 years annually,“ the WHO said.
According to the data, NCDs are responsible for 70% of deaths worldwide. In India, diseases like cancer, diabetes and heart problems were estimated to have killed a total of 58,17,000 people in 2016. While the percentage of deaths from NCDs is still lower in India as compared to many other countries, experts are concerned the burden is rapidly increas ing because of changing lifestyles and factors like pollution, and tobacco and alcohol consumption.
Four risk factors responsible for a significant proportion of these diseases are tobacco use, unhealthy diet, physical inactivity , and harmful use of alcohol. The major metabolic risk factors are obesity , raised blood pressure, raised blood glucose and raised blood cholesterol levels, the report says.
Cardiovascular diseases (coronary heart disease, stroke, and hypertension) contribute to 45% of all NCD deaths, followed by chronic respiratory disease (22%), cancer (12%) and diabetes (3%).
Cancer, diabetes and heart diseases alone account for 55% of all premature deaths in India in the age group of 30-69 years.
“Bolder political action is needed to address constraints in controlling NCDs, including the mobilisation of domestic and external resources and safeguarding communities from interference by powerful economic operators,“ said Tedros Adhanom Ghebreyesus, director-general of WHO.
Of late, the health ministry has initiated several measures to tackle the increasing burden of NCDs. For instance, the ministry has started a massive free doorto-door screening programme for early detection of cancer, heart disorders and diabetes. The programme, flagged off in February , aims to cover 200 districts by 2018.The government has also started schemes to set up cancer centres across the country. While 31 such hospitals have already been built, 49 more are to be set up by 2020.
c. 2008- 2023
From: July 15, 2024: The Times of India
See graphic:
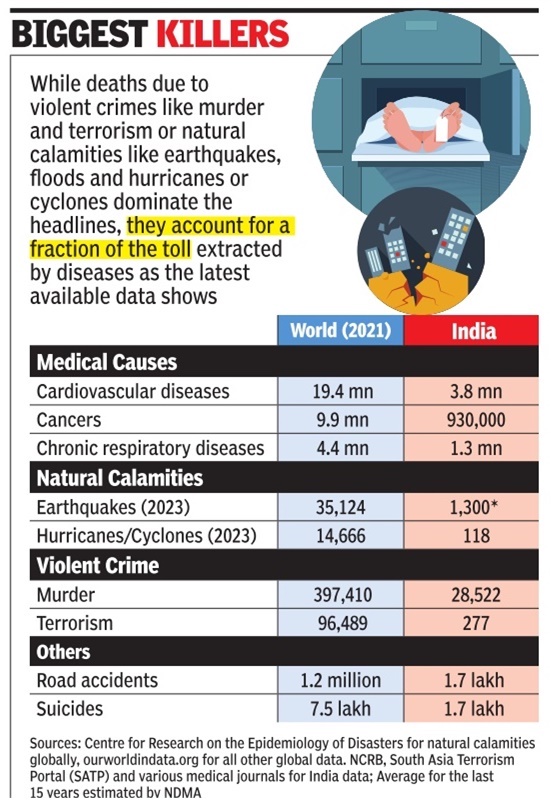
The top causes of death in India, c. 2008-2023
Among young men: c. 2023

From: Dec 20, 2024: The Times of India
See graphic:
The top causes of death among young men in India, presumably as in 2023
Among young people, 2020-22
Rema Nagarajan, June 25, 2025: The Times of India

From: Rema Nagarajan, June 25, 2025: The Times of India
Suicide remains among the top two causes of death among youth (15-29 years) in India over the last two decades, an analysis of cause of death reports shows. In 2020-22, suicides accounted for one in six deaths (17.1%) in this age group. Globally, suicide is the third most common cause of deaths in this age group, according to the WHO.
In the list of top 10 causes of death for all ages, suicide doesn’t figure. Cardiovascular diseases is on top of the list, followed by respiratory infections and cancers. Counter-intuitive as it may seem, it is the young who are more prone to death by suicide.
The share of suicides in total deaths in the 15-29 age group remained higher among women (18.2%) in 2020-22 than among men (16.3%), but it has fallen over the years, closing the gap significantly. In 2010-13, the share of suicides was 21.8% for women and 15% for men.
The 15-29 age group accounts for only 5% of all deaths in India according to the latest cause of death report of the office of registrar general of India, which pertains to the 2020-22 period. What is shocking is that taking their own life is the greatest danger for young people in this period, followed by road accidents.
Details
Rema Nagarajan, June 25, 2025: The Times of India

From: Rema Nagarajan, June 25, 2025: The Times of India
Along with suicide, motor vehicle accidents have featured among the top two causes of death among youngsters in the 1529 age group (barring 2004-06 and 2010-13), an analysis of cause of death reports under Sample Registration System shows. Over the years, cardiovascular diseases have displaced unintentional injuries barring motor accidents (fall, drowning, animal bites, burns, complications of medical and surgical care, etc) in the top three causes.
In 2020-22, cardiovascular diseases accounted for 9.8% of the deaths in the age group, just over unintentional injuries at 8.7%. Until 2017-19, cardiovascular diseases were fourth on thelist, In 2004-06, suicide, at the top of the list, accounted for 15.8% of deaths in the age group, followed by unintentional injuries (11.3%), motor accidents (9.8%) and cardiovascular diseases (7.5%).
According to National Crime Records Bureau (NCRB) data, the top five causes for suicides in the 18-30 year age group are family problems (32.4%), “love affairs” (8%), marriage-related issues (7.5%), insanity or mental illness (7.4%) and drug abuse (5.2%). Incidentally, dowry-related issues alone accounted for 28% of marriage-related suicides; 93% of the victims were women.
It is not surprising that India has the highest absolute number of deaths due to suicide (over 60,700) in the 15-29 age group, given that it would also have the highest population in this age group. What is striking is that the number is six times that of China (10,700). The estimated population in this age group in India is about 345 million compared to over 260 million in China.
Diabetes vis-à-vis Malaria: 2005-18
From: Twitter, February 20, 2025: The Times of India
See graphic:
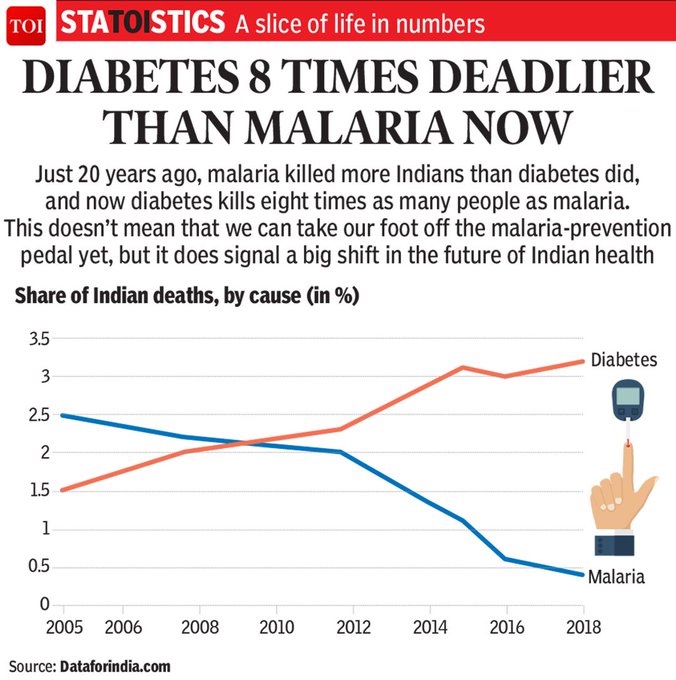
Deaths in India by Diabetes vis-à-vis Malaria: 2005-18
Place of death (home vs hospital)
2021

From: May 17, 2025: The Times of India
See graphic:
Place of death of Indians (home vs hospital), 2021
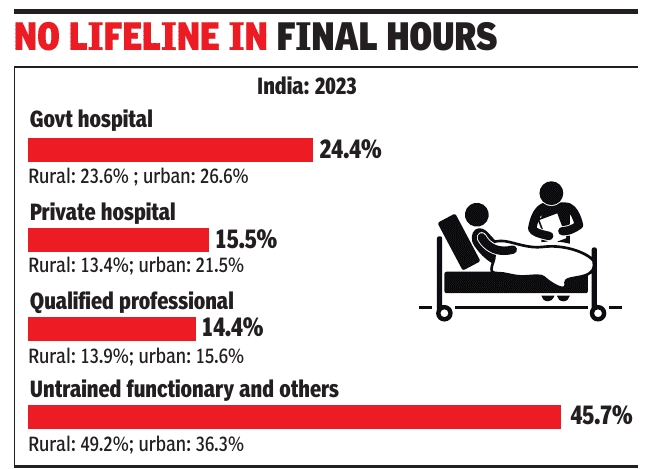
Type of medical attention received before death, 2023
Ambika Pandit, Sep 12, 2025: The Times of India
From: Ambika Pandit, Sep 12, 2025: The Times of India
New Delhi : Data on medical attention received by people before death shows that even as 24.4% of deaths occurred in govt hospitals, 15.5% in private hospitals and 14.4% were attended by a qualified professional, the largest chunk of 45.7% had no medical attention or were attended to by an untrained functionary in 2023.
The Sample Registration System (SRS) Statistical Report 2023 shows that in rural areas, the percentage of deaths that occurred with no medical attention or attended by an untrained functionary was higher at 49.2, compared to 36.3% in urban areas.
The distribution of deaths by type of medical attention received before death varies considerably across states. In Delhi, 36.6% of deaths occurred in govt hospitals, while only 39.5% had no medical attention or were attended by an untrained functionary. In contrast, in Jharkhand, 62.4% of deaths occurred with no medical attention or an untrained functionary, while only 5.6% were attended by a qualified professional.
In case of rural areas, untrained functionary and ‘no medical attention received before death’ covers about 49.2% deaths — ranging from 28.4% in Kerala to 69.4% in Bihar. While in urban areas, about 36.3% people did not receive medical attention or were attended by untrained functionaries — ranging from 22.5% in Karnataka to 58.1% in Bihar.
SRS data for 2022, at the national level, indicates 23.3% of deaths occurred in govt hospitals, 14.5% in private hospitals, 13.7% were attended by a qualified professional and 48.5% had no medical attention or were attended by an untrained functionary. Data on deaths by age group in the 2023 report reveals that a significant proportion of deaths in India occurred among people aged 60 years and above, with the highest proportion recorded in Kerala (78.5%) followed by Himachal Pradesh (76.2), Maharashtra (68.8%) and Delhi (67.5%).
Registration of; main causes/ 2017
Rema Nagarajan, Sep 4, 2019: The Times of India
The main causes
As in 2017
From: Rema Nagarajan, Sep 4, 2019: The Times of India
Only 22% deaths in India medically certified; below 10% in some states
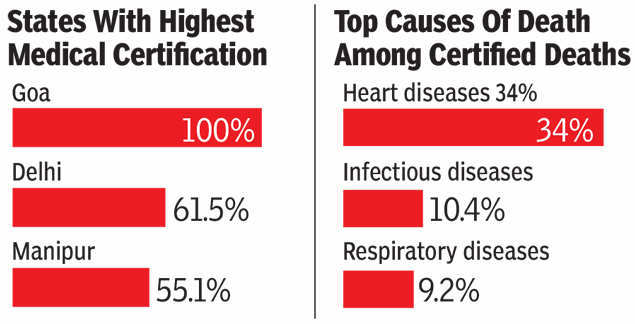
Only 22% of the registered deaths in the country are medically certified, with the proportion dipping below 10% even in some states generally regarded as developed. Among those medically certified, diseases of the circulatory system are not only the biggest killers but the fastest growing. Deaths caused by complications due to diabetes are also emerging as a significant chunk, shows data on causes of death released by the office of the Registrar General of India.
Interestingly, more male deaths are medically certified, accounting for 61.9% of all medically certified deaths in the country.
Med certification of deaths up from 13% to 22% in 27 yrs It seems more males are admitted to hospital during the last moments of life as compared to females, notes the report on medical certification of cause of death (MCCD). This could be because of property being mostly in the name of men and death certificates being crucial for inheritance. According to the report, progress in the implementation of medical certification of deaths has been slow, rising from 12.7% to 22% over the last 27 years. It has so far been implemented in only certain hospitals, generally in urban areas which are selected by the Chief Registrar of Births & Deaths and the coverage is not uniform across states. Out of an estimated 70 lakh deaths in 2017, over 60 lakh were registered, but just over 14.1 lakh were medically certified. Amongst bigger states, the highest level of medical certification of cause of death was in Tamil Nadu (43.3%) followed by Maharashtra (38.9%) and Karnataka (30.4%). Of those medically certified, deaths due to diseases of the circulatory system have seen the highest jump of 9.7 percentage points and this category of diseases now accounts for over 34% of deaths. The data reveals that, since 2000, diseases of the circulatory system such as heart diseases have not only been the top-most killer, but their share in total deaths has been steadily increasing. Ischemic heart disease alone accounted for over 10% of all medically certified deaths. Similarly, while endocrine, nutritional and metabolic diseases were the seventh leading cause of deaths (5.3%), diabetes mellitus alone under this category constituted 4.6% of medically certified deaths. Within infectious and parasitic diseases, which were the second leading cause of death (10.4%), septicemia alone accounted for 4.6%. The category on infectious diseases is followed by respiratory diseases accounting for 9.2% of deaths and cancers accounting for 6.4%. Death of infants during birth accounts for 5.8%, including those due to slow fetal growth and fetal malnutrition. Given the low level of certification, it is possible that the data may not accurately mirror the actual picture of how many die from which disease, but the broad patterns are unlikely to be significantly different.
Medical certification of cause of death
2020
June 24, 2021: The Times of India
Less than one in five deaths in India in 2019 was certified for cause of death. In Bihar, it is less than one in 40, in Jharkhand and Nagaland, about one in 30 and in Uttar Pradesh, one in every 25. These sobering facts emerge from an analysis of two recent reports from the Census office.
The 2019 annual report of the Civil Registration System (CRS) estimates that there were just over 83 lakh deaths in India in that year. Of these, a little over 76.4 lakh were registered. A report on medical certification of cause of death (MCCD) released on Wednesday shows that less than 1.6 lakh deaths were certified for cause. That’s just 18.9% of the total. The data is particularly significant at a time when there is a raging debate on whether or not India’s official count of Covid deaths represents the true picture.
It is also worrying because it shows the level of medical certification has gone down, not up, though only slightly, over the last three years. It has fallen from 22% of all registered deaths in 2017 to 21.1% in 2018 & further to 20.7% in 2019.
Bihar, UP at bottom of table of ‘medically certified’ deaths
Thankfully, the level of registration has risen over the same period quite sharply from 78.3% in 2017 to 92% in 2019. As a result, the proportion of estimated deaths that are medically certified has risen, not dropped. The worst off states in terms of the proportion of estimated deaths being medically certified are those that have both low levels of registration as well as low levels of certification of those that are registered.
Take Bihar, for instance. The state had nearly 7 lakh estimated deaths in 2019. Of these, only 3.6 lakh or a little over half were registered. And of those only 18,233 or 5% were certified for cause. The double whammy of low registration and low certification of registered deaths meant that a mere 2.6% of all deaths were actually certified for cause.
Jharkhand, Nagaland and UP all had a similar pattern, with low registration levels and low certification levels combining to mean the cause is medically certified for only a tiny fraction of the estimated deaths in the state.
There are also states like Kerala, Andhra Pradesh and Odisha, which had 100% registration, but low levels of certification of cause.
The top of the charts is occupied by smaller states or Union territories like Goa and Delhi, most of which have 100% registration and high levels of certification too. Goa was the lone state with 100% registration and certification of deaths.
In no large state were even half of all deaths certified for cause. Among the larger states, Tamil Nadu and Maharashtra were the best with about 44% and 38% respectively of all deaths being certified.
The top of the charts is occupied by smaller states or Union territories like Goa and Delhi, most of which have 100% registration and high levels of certification too
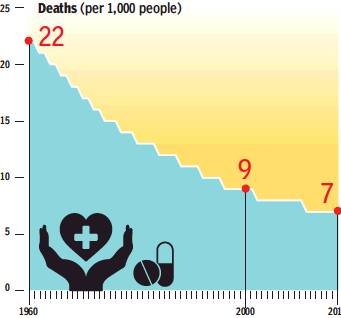
Death rate
1960-2018
From: July 18, 2019: The Times of India
See graphic:
Deaths (per 1000 people), 1960-2018
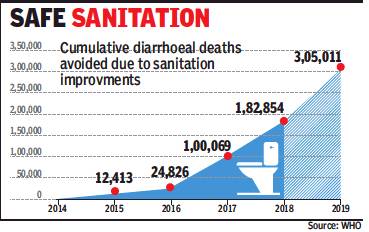
Diarrhoeal deaths
2014-18: an improvement
Dipak Dash, ‘Swachh mission saved 1.8L from diarrhoeal deaths’, August 4, 2018: The Times of India
From: Dipak Dash, ‘Swachh mission saved 1.8L from diarrhoeal deaths’, August 4, 2018: The Times of India
At least 1.8 lakh diarrhoeal deaths have been averted in rural areas since the launch of Swachhta Bharat Mission which primarily focuses on building toilets, the World Health Organisation (WHO) has estimated. The report projected saving of at least three lakh lives, if it achieves the October 2019 target of every household having access to sanitary toilets. The drinking water and sanitation ministry claims that till Friday, 89% houses in villages have got sanitary toilets.
“According to calculations, if all sanitation services are used, the initiative could result in over 14 million more years of healthy life in the period measured, with the benefits accruing yearly thereafter,” WHO said.
The drinking water and sanitation ministry said the achievement is remarkable given that before 2014 unsafe sanitation caused an estimated 199 million cases of diarrhoea annually.
The global public health body arrived at the numbers of life that may have been saved taking into account the data from the latest Rapid Survey of Children, National Family Health Survey and Swachh Bharat Mission. “WHO has not undertaken any primary data collection for the study. The figures used for sanitation coverage are assuming usage of sanitation services...,” it said.
WHO said the methodology used to estimate the impact is a “well-established” one and has been used for studies such as the Global Burden of Disease.
2016: Pneumonia, diarrhoea interventions decline

From: Sushmi Dey, Study: Pneumonia, diarrhoea interventions declined in past yr, November 10, 2018: The Times of India
Even as vaccine coverage has significantly improved in India, other interventions against pneumonia and diarrhoea, the two major causes of child deaths in the country, declined in last one year, a new report assessing the global situation shows.
The Pneumonia and Diarrhoea Progress Report 2018 shows ORS coverage dropped by 13 percentage points, exclusive breastfeeding by 10 percentage points, whereas access to pneumonia care decreased by four percentage points in one year.
With a total of 2,60,990 deaths of children under 5 years of age due to pneumonia and diarrhoea, India continues to top the list of 15 countries with the most casualties. While 1,58,176 children under 5 died of pneumonia, diarrhoea accounted for 1,02,813 deaths in 2016.
The report — released by the International Vaccine Access Center (IVAC) at the Johns Hopkins Bloomberg School of Public Health — also shows female children in India lose out on vaccination despite improvements in full immunisation coverage.
Only 78 females were fully immunised for every 100 males fully immunised in poor areas of Delhi, according to the report.Addressing these disparities can help reduce pneumonia and diarrhoea burden, it added.
The report, released ahead of the 10th annual World Pneumonia Day, on November 12, reviews progress and gaps in coverage of interventions to “protect against, prevent and treat” pneumonia and diarrhoea.
Globally, pneumonia and diarrhoea cause 1.36 million deaths in children in the same category in 2016. Over twothirds of the global burden of pneumonia and diarrhoea mortality occurs in just 15 countries. Despite significant reductions of disease in recent years with improvements in access to and use of health interventions, nearly half a million pneumonia and diarrhoea deaths still occurred in just India and Nigeria.
The report lists exclusive breastfeeding, vaccination, access to care and use of antibiotics, oral rehydration solution, and zinc supplementation as key interventions to help prevent and treat pneumonia and diarrhoea.
Diseases Eradicated
November 17, 2017: The Times of India
YAWS | Bacterial infection of skin, bone and joints
India first country to eradicate Yaws. In a 1952-64 campaign, 0.2 million cases were detected in Odisha, MP, Maharashtra, Andhra and Tamil Nadu
Eradication programme was launched in 1996-97 mostly in tribal and remote areas and the last case reported in India was in October 2003. India announced elimination in September 2006. Certification took another decade until July 2016
GUINEA WORM | Parasitic infection
Second disease after small pox to be eradicated from India
Eradication project launched in 1983-84 2/3rds of the cases were in MP and Rajasthan, which had India’s last case in 1996
The infection spreads via dirty stagnant water, shows as blister on lower leg, rendering the infected non-functional
Chad reported 11 cases in 2017
POLIO
India certified polio-free in March 2014, from over 50,000 cases in 1995 when it launched the campaign against polio
Efforts to eliminate global polio infection began in 1988. The global polio eradication initiative reduced polio by 99% — to just 8 cases in 2017: three in Pakistan and five in Afghanistan
SMALLPOX
First disease to have been eradicated globally, the world was declared smallpox-free in 1980
India eradicated smallpox in April 1977
Expenditure on health
2018-19
Sep 13, 2022: The Indian Express
From: Sep 13, 2022: The New Indian Express
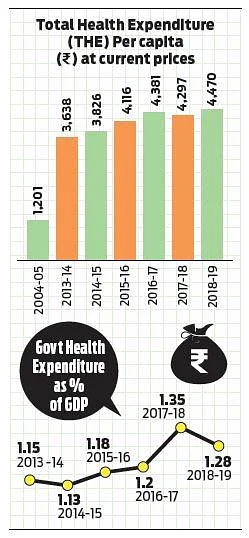
Health spend at 3.2 per cent of India's GDP, out-of-pocket expenses dip in FY19
NEW DELHI: Total health expenditure (THE) of the government was 3.2% of the GDP in 2018, the lowest since 2004-05.
However, the per capita spending of Rs 4,470 has been the highest, according to the 2022 National Health Accounts Estimates (NHAE) report, which was released on Monday. The report covers health sector expenditure patterns till 2018-19.
A comparative analysis shows that the as a percentage of the GDP was 4.2% in 2004-05, the highest in over a decade.
It has been steadily declining since then, reaching 3.9% in 2014-15 and 3.8% in the following two years. It shrank further to 3.3% in 2017-8 and 3.2% a year later.
At the same time, the per capita spending at current prices increased from Rs 1,201 in 2004-05 to Rs 4,470 in 2018-19.
The estimates also show that out-of-pocket expenses borne directly by the patients have been steadily declining from 69.4% in 2004-05 to 48.2% in 2018-19. But this slide is minuscule compared to the previous year when it stood at 48.8%.
The household health expenditure, which includes insurance, continues to be 54.3% of THE.
“Household’s Out of Pocket Expenditure on health (OPPE) is Rs 2,87,573 crore (48.21% of THE, 1.52% of GDP, Rs 2,155 per capita). Private Health Insurance expenditure is Rs 39,201 crores (6.57% of THE).”
The estimates also show that private hospitals make up for most of the current health expenditure (CHE), with Rs 1,55,013 crore (28.69% of CHE) as compared to Rs 93,689 crores (17.34%) in government hospitals.
India’s THE in 2018-19 is estimated to be Rs 5,96,440 crore (3.16% of GDP and Rs 4,470 per capita). Of this, government spending was Rs 2,42,219 crore, which is 40.61% of THE, 1.28% of GDP, and Rs 1,815 per capita.
This amounts to about 4.81% of general government expenditure in 2018-19. Besides, the government-financed health insurance expenditure increased by 167% since 2013-14.
2018-24
Rema nagarajan, July 14, 2024: The Times of India

From: Rema nagarajan, July 14, 2024: The Times of India
The Union government’s expenditure on healthcare may appear to be rising at first glance. However, it has actually been steadily shrinking in the last five years (2018-19 to 2023-24) whether as a share of the Budget or as a percentage of GDP. In fact, the spending has barely kept pace with inflation since 2019-20.
As a percentage of the total Budget, health spending has shrunk from 2.4% in 2018-19 to 1.9% in 2023-24. As a percentage of GDP, it has fallen from 0.30% to 0.28% in 2023-24.
As for inflation, the outlay in 2019-20 was a little over Rs 66,000 cr, while in 2023-2024 it was just under 83,500 cr. Adjust for inflation using the wholesale price index and that translates to a tiny rise from around Rs 65,000 cr to Rs 66,000 cr at 2018-19 prices. And this is not even taking into account the fact that inflation in the healthcare sphere is likely to be much higher than in general price levels.
What is even more worrying is that even this low spending is after adding funds collected through the health cess. When the cess was introduced in 2018, it was claimed that it would top up government spending on health to take care of the health of poor and rural families. Instead, the thousands of crores collected each year through cess has in effect been used to make up for the steady cut from normal budgetary resources that the health sector has been facing.
In 2022-23, the Centre’s health spending included over Rs 18,300 crore that came from the health cess. If you take the cess out, the Centre’s budgetary spending would be just Rs 59,840 crore, less than what was spent before Covid, in 2019-20 (Rs 66,042 cr) even without adjusting for inflation. In 2018, when the cess was introduced, health spending was 2.4% of government’s total expenditure. If the government spent the same proportion of its total spending in 2023-24, it should have spent over Rs 1.07 lakh crore on health. Instead, the revised expenditure for 2023-24 showed just over Rs 83,400 crore, which included Rs 18,300 crore from health cess.
Shockingly, even after adding what seems like a large one-time expenditure for Covid in 2020-21 (Rs 10,655 crore) and 2021-22 (Rs 15,955 crore) the health spending in these years does not equal what the expenditure would have been if the spending had been at the 2018-19 level of 2.4% of the total budget expenditure.
Health sector spending includes allocation for health and family welfare, health research and Ayush. Ayush share saw significant increase as a share of government’s total expenditure. Spending on health research went up just marginally though 70-80% of this is on the Indian Council for Medical Research, except in 2020-21 when 40% of the allocation was for Covid emergency response. However, spending on health and family welfare, which is meant for national programmes, the national health mission and health system strengthening, has seen a substantial cut in terms of its share in GDP and in total budget expenditure.
Post 2014, the highest share that health and family welfare has had of the total budget spend was 2.4% in 2017-18. After that, this share has steadily decreased, including in the Covid years, despite separate allocation for Covid response, to touch 1.7% in 2023-24. If the health cess component is not counted, this would fall even further to 1.5%.
Fitness, attitudes towards
2024
Namita Devidayal, Sep 4, 2024: The Times of India
From: Namita Devidayal, Sep 4, 2024: The Times of India
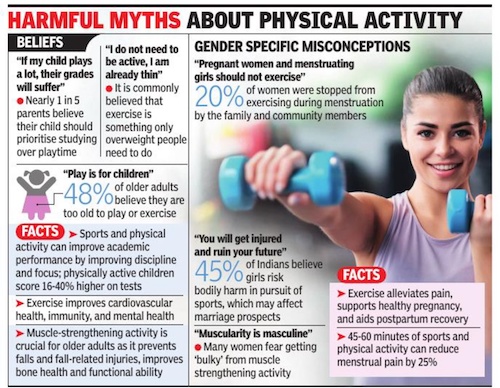
20cr Indians lead ‘inactive’ lives, urban girls worst-hit, says study
‘Urban Inactivity Rates Twice As High Compared To Rural Areas’
Namita Devidayal
■ Nearly 1 in 5 parents believe their child should prioritise studying over playtime.
■ 48% older adults believe they’re too old to play/exercise
■ 45% Indians believe girls risk bodily harm in pursuit of sports, which may affect marriage prospects
A first of its kind national survey on sports & physical activity reveals that over 20 crore Indians are “inactive” based on international norms, & that girls in cities are most inactive.
Among the most disturbing findings is gender gap in physical activity. Girls in cities are the worst hit because of the low proximity to public spaces like parks and maidans, as well as abiding fear over safety. Three-quarters of active time for the average Indian woman is consumed by household chores and care giving to children and elders.
Also, urban inactivity rates are almost twice as high compared to rural areas. There is a pressing need to integrate physical activity into schools for 67% of the students surveyed said their school did not have sports equipment, while 21% said their school did not have a playground. The survey – conducted in Maharashtra, UP, Odisha and Tamil Nadu – relied on focus group discussions with parents, blue collar workers, physical education teachers and students.
Food-, water- borne diseases
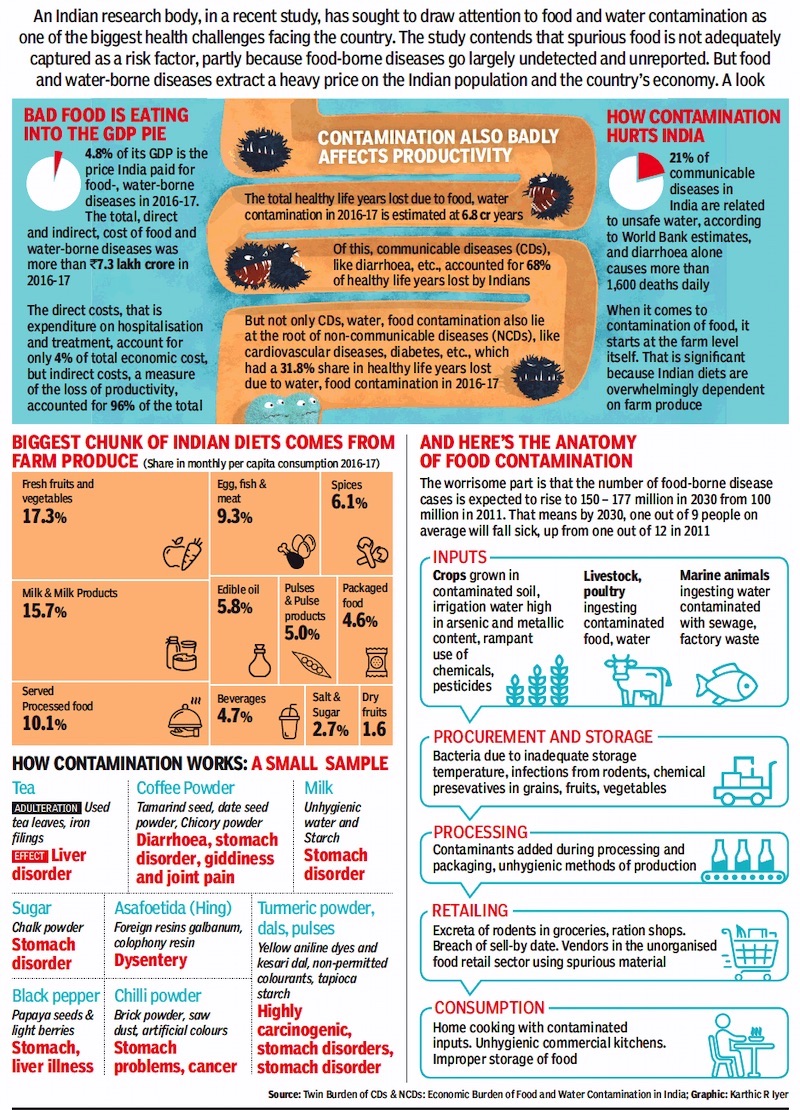
The cost to the nation, 2016-17
From: August 28, 2019: The Times of India
See graphic, ‘The cost of food- and water- borne diseases to the nation, 2016-17 ’
Gender skew among patients
AIIMS, 2016: 63:37 M:F ratio
DurgeshNandan Jha, August 9, 2019: The Times of India

From: DurgeshNandan Jha, August 9, 2019: The Times of India
In a first-of-its-kind study, AIIMS has confirmed what has been known for ages — women face discrimination in access to healthcare. Out of the 23.8 lakh patients who visited the institute in 2016, only 37% were women, reveals the study published recently in British Medical Journal.
The study didn’t include patients visiting the obstetrics and gynaecology departments dealing only with women’s issues.
Dr Ambuj Roy, the lead author of the study, told TOI that younger and older women were the most neglected and discriminated against. In the middle-age group — 31-44 and 45-59 years — the gender bias was less at 1.5 male patients per female patient and 1.4 male patients per female patient, respectively, said Dr Roy.
In the young group — 0-18 and 19-30 years, the bias rose to 1.9 and 2.02, respectively, he added. As per the study, 1.7 male patients per female patient visited AIIMS in the age group of 60 years and above.
More than 90% of the patients at AIIMS travel from four states — Delhi, where the hospital is located; Haryana, an adjoining state; Uttar Pradesh, a state slightly away; and Bihar, the farthest from Delhi.
The hospital data also shows that increase in distance from the hospital was inversely proportional to the number of women visiting the hospital as compared to men. In 2016, 84,926 women from Bihar visited AIIMS compared to over two lakh men. Compared to this, in Delhi, the gender bias was less with 4.8 lakh female visitors compared to 6.6 lakh males.
According to Dr Roy, a professor of cardiology at AIIMS, the findings suggest that local healthcare infrastructure needs to be strengthened to benefit the younger and older women.
AIIMS also studied the gender bias among various departments. The doctors found that more men visited the hospital for heart ailment — 1.9 male patients per female patient. This was followed by a skewed sex ratio among patients visiting ENT (1.9 male patients per female patient), emergency medicine (1.8), paediatrics (1.8), eye (1.8), surgery (1.4), skin (1.4), orthopaedics (1.3) and medicine (1.3). Sensitisation on giving women equal priority as well as opportunity to seek treatment is important to end the bias, said doctors.
In 2011, another study conducted by AIIMS doctors had shown a similar gender bias among children with congenital heart disease. It revealed that the likelihood of a male child undergoing corrective surgery was 3.5 times higher than that of a female child.
Concluding its report, the current study stated, “There is extensive gender discrimination in healthcare access, with the situation worsening for younger and older female patients and those at increasing distances from the referral hospital. This calls for systemic societal and governmental action to correct this gender discrimination.”
Genes and the South Asian
Genetic link to heart disease, diabetes
Chethan Kumar, January 8, 2021: The Times of India
Scientists and doctors from several cities in India and the US say they have provided the first evidence for a shared genetic link between cardiomyopathy (condition of heart muscle leading to failure) and metabolic syndrome (high blood sugar, excess body fat around the waist and abnormal cholesterol levels) among South Asians.
This information, the team says, can aid early identification and development of preventive strategies. While recent epidemiological and clinical studies suggest that around 10% of cardiomyopathy patients coexist with diabetes, the genetic link underlying it is less understood.
Findings published in “Science Advances”, an international peer-reviewed journal, by the team led by Dhandapany Perundurai, investigator at the Centre for Cardiovascular Biology and Disease (CCBD) at Bengaluru’s Institute for Stem Cell Science and Regenerative Medicine (DBT-inStem), provide evidence for this.
What they found
Perundurai’s lab screened 2,552 cardiomyopathy patients with and without diabetes, and identified novel and ultra-rare variants in a metabolism-related gene called “Adiponectin receptor protein 1 (ADIPO1R)”. “Importantly, these gene variants were absent in South Asian-specific 1,800 healthy individuals. ADIPO1R is a receptor for the hormone adiponectin, which regulates glucose and lipid metabolism in human cells,” the team said.
To understand these variants’ role in causing heart disease, researchers used cardiomyocytes — cells involved in heart function — and showed significant dysregulations in glucose metabolism and increased cell size with enhanced expression genetic markers associated with cardiac hypertrophy.
“As each of these variants is found to be affecting a unique signalling molecule and its biological process, therapeutic strategies should be tailor-made based on the nature and type of the variant associated with this disease,” Perundurai explained.
“A simple genetic test would help spot individuals highly susceptible to cardiac muscle disorder. Early diagnosis of an ‘at-risk’ population will help prescribe appropriate preventive health plans to subdue harmful effects associated with this disease,” Perundurai added.
Heart disease, diarrhoea, pulmonary diseases
From November 27, 2017: The Times of India
See graphic:
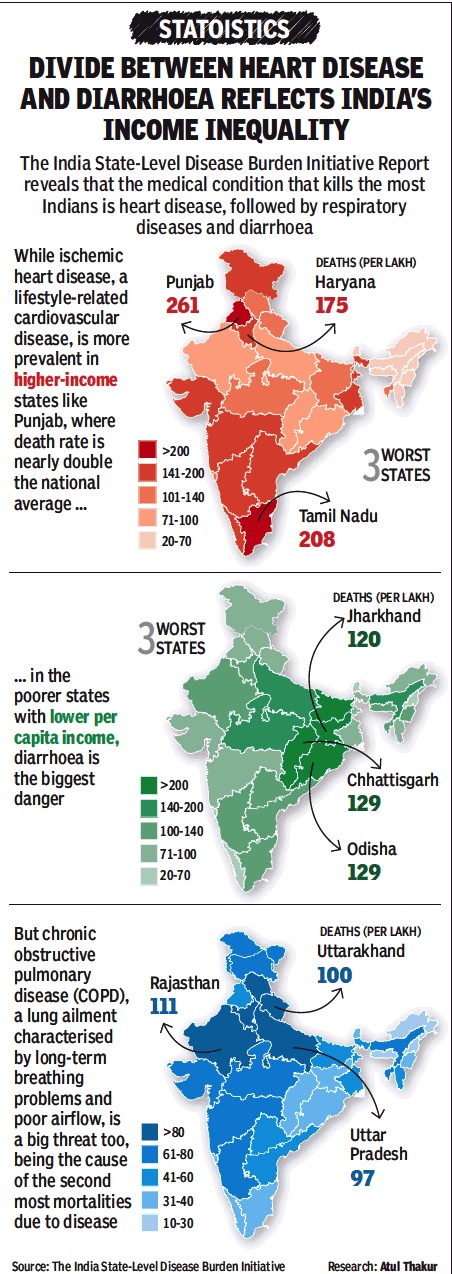
The Indian states in which heart disease, diarrhoea and COPD pulmonary disease are most widespread, 2017
As in 2018-19
See Drugs and Pharmaceuticals: India > Drugs and pharmaceuticals sold in India> Types of medicines sold: 2018-19
Lungs
Delhi children have poor lung capacity
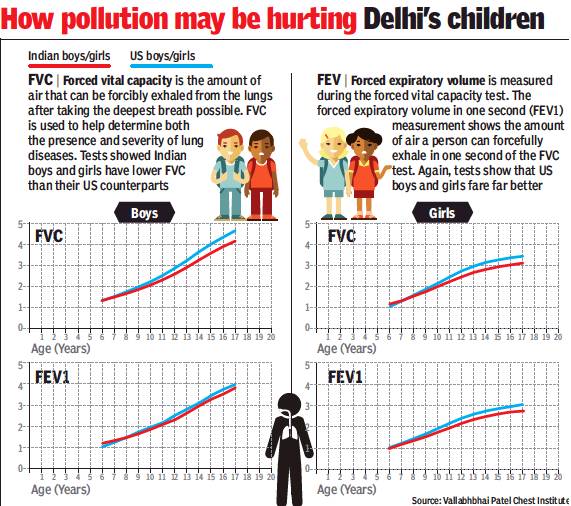
From: Jayashree Nandi, Delhi kids have lower lung capacity than those in US, November 27, 2017: The Times of India
Not Just Genetics, Air Pollution Also To Blame, Finds Study
Children in Delhi have a far lower lung capacity and lung growth rate than kids of the same age in the US, according to a recent study by the department of pulmonary medicine at the Vallabhbhai Patel Chest Institute. While much of this could be attributed to genetics and nutrition, environmental factors like air pollution were also to blame, doctors who conducted the study said.
To develop more suitable guidelines for north Indian children, doctors from the Vallabhbhai Patel Chest Institute and the Department of Biostatistics and Medical Informatics, University College of Medical Sciences, conducted lung capacity tests on 670 healthy children (boys and girls) in the age group of 6 to 17 years of north Indian parentage and from a Delhi school selected randomly. The study found that, on average, the lung capacity of children in Delhi was 10% lower than those in the US or those of Caucasian origin. The rate of increase or the growth of lungs was also slow for children in Delhi compared to their US counterparts.
Until now, the results of pulmonary, or lung function, tests for children in India were compared with the American Thoracic Society-European Respiratory Centre spirometry guidelines. But according to the authors of the study, a correct interpretation of spirometry results — the most common test for management of lung diseases — comes from comparing the results of Indian children with the guidelines developed for healthy Indian children. Though several such guidelines have been developed for children in different regions of India, “most of these are now outdated and have limited utility due to technological advances in equipment and revisions in methodology”, the study stated.
The study advised pulmonologists and paediatricians to use comparative equations developed in India for correct interpretation of spirometry results. “Use of equations developed in other populations is not advisable for interpreting data of Indians, as it is likely to lead to substantial errors and, thus, adversely affect management decisions. This occurs because the Caucasian and Indian predictions of normal values differ substantially,” the study stated.
Dr S K Chhabra, who led the study, told TOI: “We developed our own model to understand lung function among children here. What we found is that by the time they reach 18 years of age, the lung capacity of both boys and girls is about 10% lower than American children. The lungs were also found to be growing at a slower rate; so, the maximum size they were reaching was smaller. A part of this could be attributed to ethnic differences, genetics, frequency of childhood infections and nutrition, but another reason could be environmental factors like pollution. There are many other studies, especially those conducted on Chinese children, which link retarded growth and lower lung capacity to air pollution.”
For example, a similar study published in 2010 in the journal of respiratory medicine in Science Direct found that children living in the most polluted district had significantly slower growth rates in lung functions than those from the least-polluted district.
Dr Chhabra added that the question on chronic effects of air pollution could be answered in two ways: “The first is to follow a group of children in two different environments over several years and compare their growth. Such studies have been carried out in several countries and suggest that children growing in polluted air suffer from reduced lung growth. To date, this has never been done in India,” he said. “Another way is to compare growth patterns in the population. The US models for lung growth in children have been developed using the national survey, NHANES III. My models, too, predict lung function in north Indian children. A comparison of growth patterns of Indian and US Caucasian children of same heights shows interesting differences. Both have nearly the same size till the age of about 8 years when the lungs complete their normal physical growth. However, subsequent growth in size shows a progressively increasing difference between the two countries with Indian boys and girls having lungs that are about 10% smaller when they become adults.
The environment ministry had recently stated that there was no conclusive evidence to establish a direct correlation of death exclusively with air pollution and that international studies should not be cited as reference to the impact of air pollution in India. Experts said it was high time the government paid attention to local health studies that established the dangerous impacts of air pollution. “These stark evidences prove that we have already compromised health of our future generation. Stop denial and the blame game. Speed up action on all pollution sources to meet clean air standards within a time frame,” said Anumita RoyChowdhury, head of Centre for Science and Environment’s clean air programme.
Menstruation and sanitary pad usage
2017: 62% of women use cloth
Shivani Azad, 62% of women on period use cloth, January 23, 2018: The Times of India
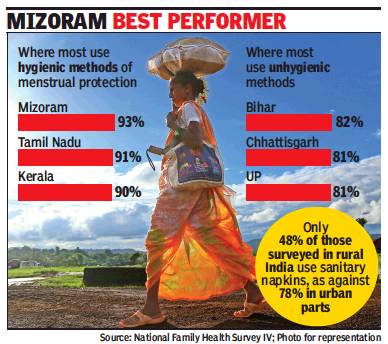
From: Shivani Azad, 62% of women on period use cloth, January 23, 2018: The Times of India
See graphic:
Most hygienic and unhygienic methods of menstrual protection, top 3 and bottom 3 states (National Family Health Survey IV)
Use Of Unhygienic Methods Highest In Bihar, UP, Chhattisgarh, Finds Survey
As many as 62% of India’s young women aged 15 to 24 years still use cloth during menstruation, the National Family Health Survey (NFHS) IV, whose findings were released recently, has revealed. According to the report, which pertains to the years 2015-16, as many as 82% of young women in Bihar still depend on pieces of cloth for protection during their menstrual cycle. In Chhattisgarh and UP, 81% of the women in the age group use cloth.
The survey sought to determine the percentage of women who used “hygienic methods” of menstrual protection, categorised as either locally prepared or other sanitary napkins, and tampons.
It was discovered that 16% of young women choose locally prepared ones.
The majority of women in rural areas did not use a hygienic method of menstrual protection, with the survey indicating that only 48% of the rural participants used sanitary napkins as against 78% in urban India.
The report suggests a direct link between education and wealth and the use of hygienic methods of menstrual protection. “Women with 12 or more years of schooling are more than four times as likely to be using a hygienic method as women with no schooling at all. Similarly, women from the highest wealth quintile are more than four times as likely to use a hygienic method as women from the lowest wealth quintile,” the report said.
Mizoram (93%), Tamil Nadu (91%), Kerala (90%), Goa (89%) and Sikkim (85%) fared well in terms of the use of the hygienic methods, while Maharashtra (50%), Karnataka (56%) and AP (43%) had a high percentage of women who use cloth. In Uttarakhand, almost 55% of young women use cloth, which, doctors say, may be making them prone to reproductive tract infections. “It is time that easy availability of sanitary napkins is facilitated, especially in remote areas, so that women’s health is not compromised,” said Dr Sadhana Chauhan, a senior gynaecologist who has worked extensively in the Jaunsar Bawar region of the state where cultural taboos prevent women from using hygienic methods of menstrual protection.
The problem is compounded by the fact that even though pads are provided to women at bare minimum prices by the government, they are often not given regularly.
Also, many young girls are too shy to ask for them from health workers designated to provide them. “The government should ensure that pads meant for us are given to one of the women in our locality, from whom we can take them without hesitation,” said Noor Jahan, an 18-year-old from Haridwar’s Pathri area.
Muscle health
70% Indians: poor muscle health, low protein levels
July 23, 2018: The Times of India

From: July 23, 2018: The Times of India
Indians are neglecting their muscle health and falling short of the recommended daily intake for protein. A survey conducted by InBody and Ipsos of 1,243 Indians between ages 30 and 55 across eight cities found most Indians aren’t making enough room in their lifestyles or diets to take adequate care of their muscles
Non-communicable diseases
2017
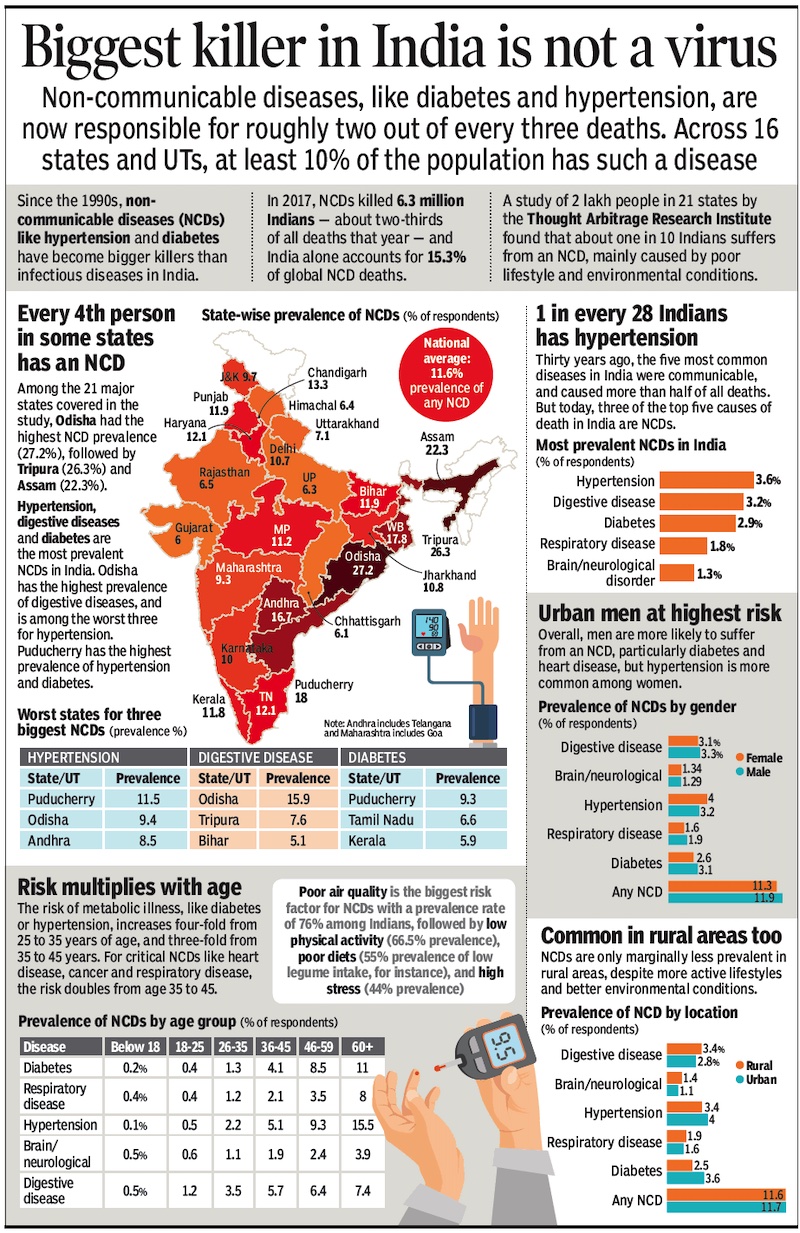
From: April 5, 2021: The Times of India
See graphic:
Non-communicable diseases in India, presumably as in 2017
Paediatrics
1969 onw: inter-generational study of height, weight, nutrition, development of Delhi babies
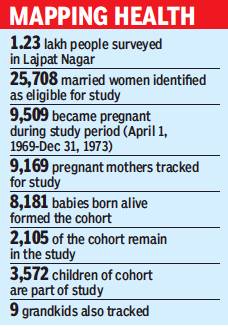
From: Rema Nagarajan, How the mother of all medical studies began in Delhi’s Lajpat Nagar, September 30, 2018: The Times of India
A study that started 50 years ago with 8,181 babies now spans three generations, and provides vital clues about infant mortality, nutrition
A study has been tracking the height, weight, nutrition and development of 8,181 babies born in Delhi’s Lajpat Nagar between 1969 and 1973, and of their children and grandchildren. It is the oldest such study in India, covering nearly 50 years and three generations, in some cases even the fourth.
The project has provided material for several studies whose results are now so well accepted that their origins have been forgotten. Such as the finding that high child mortality has an adverse impact on family planning, or that children are getting taller with every generation because of better nutrition. Originally intended to study the problem of low birthweight, it has gone on to become a major study on how poor nutrition in the womb and early childhood increased the risk of diabetes and early onset of chronic cardiovascular diseases in adult life.
The study was initiated by Dr Shanti Ghosh, then head of paediatrics in Safdarjung Hospital, with a four-year grant from the US and the Indian Council for Medical Research. Dr Ghosh was then working on criteria for defining low birthweight and India was struggling to bring infant mortality down from 140 deaths for every 1,000 live births.
A group of individuals born in a given time period within a specific geographical area is called a birth cohort. India’s first birth cohort came to be called the New Delhi Birth Cohort (NDBC). Dr Santosh Bhargava, former head of paediatrics in Safdarjung and the only surviving founding member of the NDBC, says he is amazed at how long the study has been able to track those babies. “We have never offered them compensation for being part of the study, as is done in many parts of the world, and no medical care. Yet, they allowed us into their homes and lives. People were different in the 1960s. They would support an effort if they were convinced it is for the general good,” explains Dr Bhargava.
Even today, many subjects spend from their own pocket to attend the clinics organised periodically to collect data. Deepak Alagh, a 47-year-old garment exporter, came to one organised recently in a temple in Amar Colony and spent two hours patiently filling out forms and answering the researchers’ questions. Why does he still come? “They used to come home from the time I was a baby. We have got busy with our lives, but they have stayed in touch regularly. So, we have a sense of commitment. I also come in the hope of seeing childhood friends and neighbours,” says Alagh nostalgically. “Statistically, what they are checking will give information to future generations, about changing food habits, health etc,” he adds.
Dinesh Dewani came with his 17-yearold daughter, both going through blood tests, ECG and scans. Dewani says that as a child he remembered the project staff coming home and doing check-ups on him and his mother.
Not everyone is as generous, says Bhaskar Singh, project coordinator since 1998. Some saw no reason to be ‘free guinea pigs’. “In the case of girls from the original cohort who grew up and got married, the parents warned us not to contact them at their in-laws’ houses as they might think she is suffering from some disease. We had to gradually win the confidence of the husbands so that the women could keep coming,” says Singh. He also recounts how entire families travel from Meerut and Ghaziabad to attend the clinic.
It has taken 22 grants to keep the project alive. In the 1970s, India did not even have quality standardised instruments such as infant weighing scales, infantometers for measuring length (height), and tapes for measuring head and chest circumference. The import of such equipment was banned because of forex constraints, and it had to be requisitioned locally from an anthropologist turned manufacturer.
The NDBC and another cohort run by CMC Vellore, also since 1969, provided valuable guidelines on the training, manpower and technical difficulties involved in such studies. Several more have followed — the Hyderabad Nutrition Trial from 1987-90, the Pune Birth Cohort from 1991, and the Mysore Birth Records Cohort from 1993, to name a few.
At the end of this year, Dr Bhargava will hand the NDBC over to Dr H P S Sachdev, a noted paediatrician and researcher. The cohort has suffered over 73% attrition for various reasons, but it still follows up over 2,000 from the original cohort. “We will continue to search for solutions to problems relevant to our context so that they can inform our policy and practice. Thus, we will not be dependent on Western datasets, which may not be applicable to the Indian scenario,” says Dr Sachdev.
Polio
1980-2018: India, China, Pakistan
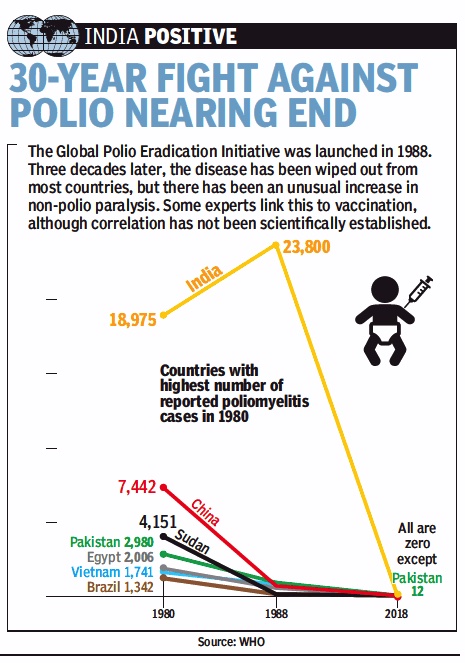
From: August 1, 2019: The Times of India
See graphic:
1980-2018: Polio cases in India, Brazil, China, Egypt, Pakistan, Vietnam.
Polio-free India
India Today.in , Striding into the future “India Today” 15/12/2016
2014
Polio-free India
Striding into the future
On March 27, the World Health Organization (WHO) declared India free from polio, which Bill Gates described as "the greatest global health achievement that I have witnessed". The war was declared as won as the last reported case of 'wild poliovirus' in India was in January 2011. This was a leap forward for what was once known as the largest 'endemic reservoir of polio' in the world, registering between 50,000 and 100,000 cases of paralytic polio every year. It marked the culmination of a decades-long campaign: In India, large-scale polio vaccination began in 1978, with the Expanded Program on Immunisation, which by 1984 had covered about 40 per cent of the infants in the country. In 1985, with the launch of the Universal Immunisation Program, the cover was extended. The success of these two programmes was that reported cases decline from 28,000 in 1987 to 3,200 in 1995. Saturated coverage sustained by a multi-media blitzkrieg against polio with the launch of the Pulse Polio Immunisation Programme in 1995 contributed to its success.
Pregnancies, teenage
Tamil Nadu, 2018
The pregnancy rate of teenage girls in Tamil Nadu is staggering. Officials in the Directorate of Public Health pointed out that 20,000 cases of teenage pregnancies -- below 18 years of age -- were recorded between April and December 12, 2018.
“The 20,000 number was derived from the registrations made on the Pregnancy and Infant Cohort Monitoring and Evaluation (PICME) database during these months since it is now mandatory for mothers to register under this tool to avail benefits. This is the first time that teenage pregnancies are being extensively documented in the state,” said Darez Ahamed, director, National Health Mission, Tamil Nadu, and Commissioner of Maternal and Child Health.
He said the average age group of pregnant girls was between 16 and 18 and most were married. He also added that most of the teens did not opt for abortion.
“The number is miniscule. But most want to continue their pregnancy. We keep a close watch on them since they are a high-risk group,” he said.
However, figures from the department of social welfare and nutritious meal programme revealed that only 6,965 child marriages had been reported and thwarted by district social welfare officers between 2008 and 2018.
“There is more of a health crisis than a social one,” said Vidya Reddy, co-founder of Tulir -- Centre for Prevention and Healing of Child Sexual Abuse.
She said there was a dire need to educate children, especially young girls, about their sexual and reproductive rights.
“Unlike boys, how many girls have access to birth control? Where will she go? What will she ask for? As long as you don't give children access to information and access birth control, they will be dependent on boys. Then there is no point talking about this huge number,” she said.
A study by the International Institute of Population Studies also highlighted the dire need to educate children in the country about sexual health.
It said that there was restricted awareness on topics such as sex and pregnancy, contraceptive methods, sexually transmitted diseases and HIV/AIDS and the conditions under which abortion was legally available and restricted.
T K Shaanthy Gunasingh, a gynecologist and president of the Obstetric and Gynaecological Society of Southern India, highlighted several health risks involved during teenage pregnancy.
“Girls at this age are not mentally and physically prepared to have children. And since they are still growing, their bones would not have formed well, which can result in operative deliveries. They are also prone to hypertensive disorders which can be hazardous to both the mother and the baby,” she said.
“Education on sexual and reproductive health must be mandatorily provided in all schools,” she added.
Respiratory diseases
1990-2016

From: September 13, 2018: The Times of India
See graphic:
Prevalence of Chronic respiratory diseases- Chronic Obstructive Pulmonary Disease (COPD) in India- 1990-2016
Sleep
Indians 2nd worst, after Japan
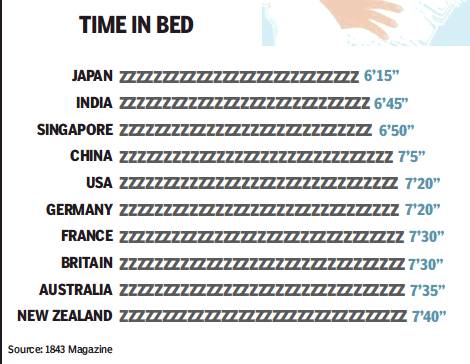
From: April 1, 2018: The Times of India
April 1, 2018: The Times of India
Urban Indians get by on roughly 6 hours and 45 minutes of sleep each night, which is roughly half an hour more than the workaholic Japanese but almost 20 minutes less than the Chinese, who are the only Asian nation to average more than 7 hours.
The Europeans, however, uniformly get at least 7 hours of shut-eye, and the richer nations manage sevenand-a-half hours or more. However, New Zealand is the sleep capital of the world with an average of 7-40. That’s the closest you can get to the textbook ideal of 8-hour sleep that is so important for health and productivity.
States of India: healthiest, unhealthiest
2015-18
Sushmi Dey, June 26, 2019: The Times of India
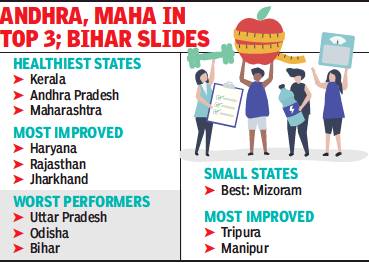
From: Sushmi Dey, June 26, 2019: The Times of India
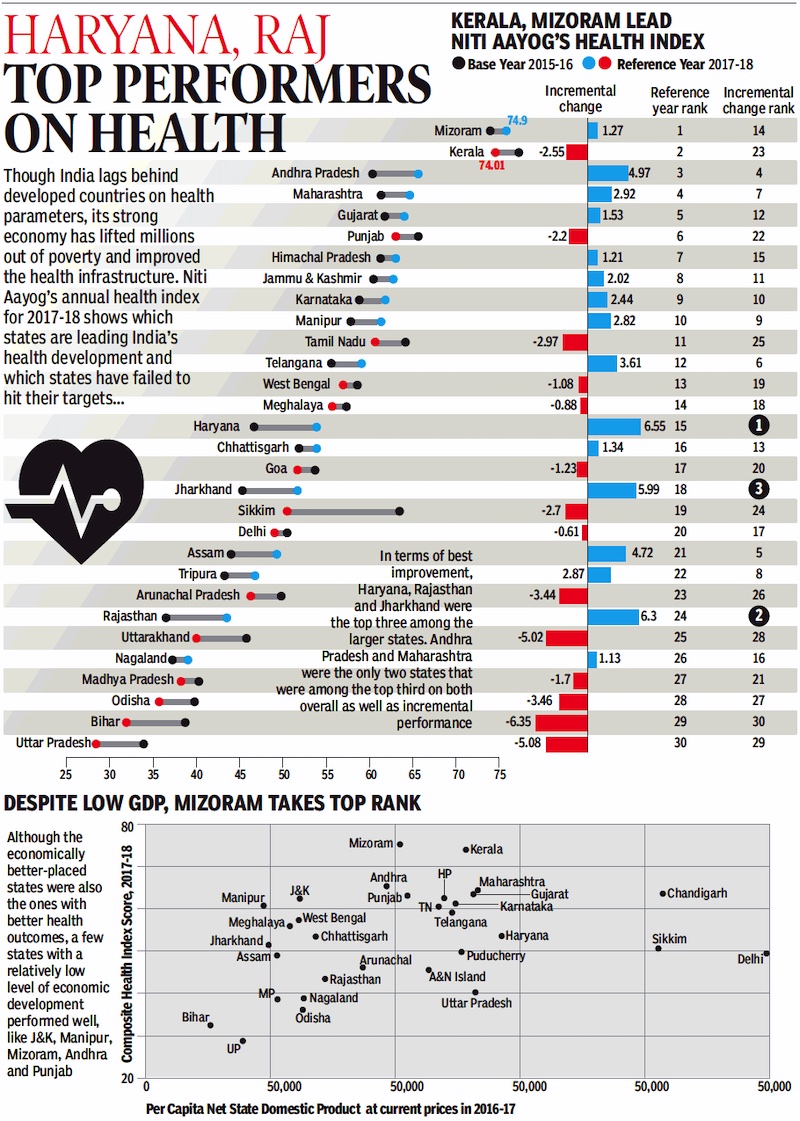
From: June 26, 2019: The Times of India
Kerala remains at the top of the heap among larger states in terms of various health parameters, followed by Andhra Pradesh and Maharashtra.
Uttar Pradesh, Odisha and Bihar are the worst performers, according to Niti Aayog’s latest health index released on Tuesday. Haryana, Rajasthan and Jharkhand top the charts based on incremental perfor mance.
The health index – which took into account 23 health indicators during 2015-16 (base year) to 2017-18 (reference year) – depicts huge disparities across states and UTs.
The report, prepared by Niti Aayog in collaboration with the health ministry and with technical assistance from World Bank, has three categories – larger states, smaller states and Union territories – to ensure comparison among similar entities. Among the smaller states, Mizoram ranked first in overall performance while Tripura and Manipur were the top two states in terms of incremental performance. Sikkim and Arunchal Pradesh registered the biggest decline in overall health index scores.
Among the UTs, Chandigarh ranked first in overall performance, while Dadra and Nagar Haveli improved the most.
Among the top ten performers, seven states have improved in overall performance scores (Andhra Pradesh, Maharashtra, Gujarat, Himachal Pradesh, Jammu & Kashmir, Karnataka and Telangana). However, among the six least performing states (Uttar Pradesh, Bihar, Odisha, Madhya Pradesh, Uttarakhand, and Rajasthan), all saw decline in overall performance scores with the exception of Rajasthan, which improved by 6.3 points. Among the eight empowered action group (EAG) states, only three — Rajasthan, Jharkhand and Chhattisgarh — showed improvement in overall performance during the period.
POOR PERFORMANCE
Health index scores and development levels related
The decline in the overall health index score of five empowered action group states (states that lag behind in demographic indicators and have high infant mortality rates) — Bihar, Uttar Pradesh, Uttarakhand, Madhya Pradesh and Odisha — is attributed to the deterioration of performances in several indicators.
“While it is important to identify the challenges faced by the EAG states that hinder improvement in performance, the impressive improvement in some EAG states provides learning opportunities for the rest to identify effective actions to improve their overall performance scores,” the report said.
For instance in Bihar, the deterioration was primarily due to performance related to total fertility rate, low birth weight, sex ratio at birth, tuberculosis treatment success rate, quality accreditation of public health facilities and time taken for National Health Mission fund transfer. In Uttar Pradesh, the poor performance related to low birth weight, TB treatment success rate, average tenure of key positions at state and district level and level of birth registration.
The report also pointed to a general positive correlation between the health index scores and economic development levels of states and union territories as measured by per-capita net state domestic product (NSDP).
The first round of the Health Index was released in February 2018, which measured annual and incremental performances of states and union territories from 2014-15 (base year) to 2015-16 (reference year).
Superbugs
2015: Superbugs kill more in India than globally
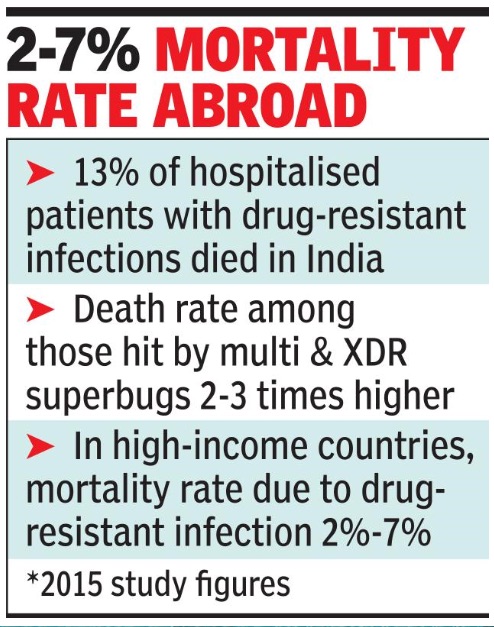
From: Durgesh Nandan Jha, Superbugs kill more in India than globally, mortality rate is 13%, November 18, 2018: The Times of India
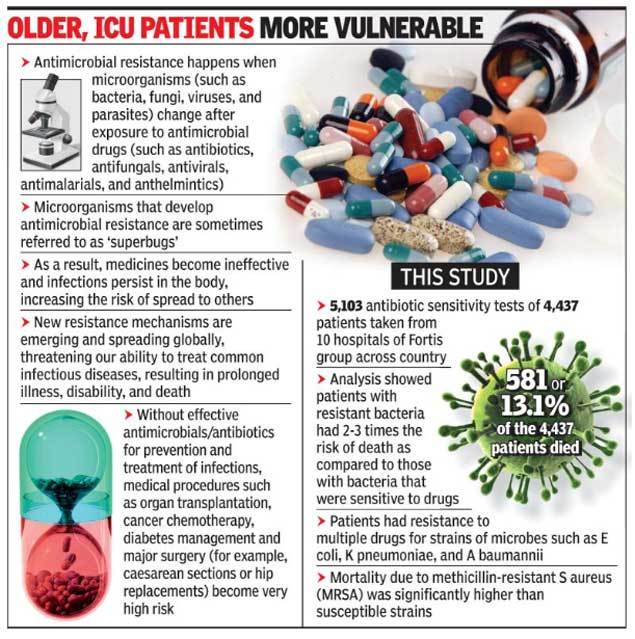
From: Durgesh Nandan Jha, Superbugs kill more in India than globally, mortality rate is 13%, November 18, 2018: The Times of India
A first-of-its-kind study conducted on 4,000 patients admitted to 10 hospitals across India, including four from the capital, shows mortality rates owing to drug-resistant bacteria in the country are more than twice compared to that in high-income countries.
According to the study, conducted by researchers from Johns Hopkins University School of Medicine and The Center for Disease Dynamics, Economics and Policy (CDDEP) among others, the overall morality rate due to drug resistant bacteria in India was 13% in 2015. Most of the patients who died were either old or admitted to ICUs when they were diagnosed with the infection. The corresponding figure in advance nations ranged between 2% and 7%.
Death rate among patients with infections caused by superbugs - Multi-Drug Resistant (MDR) bacterial infections and Extremely Drug Resistant (XDR) bacterial infections - was two to three times higher when accounting for age, sex, site of infection and the number of co-infections.
The study titled, "The mortality burden of multidrug-resistant pathogens in India: a retrospective observational study" has been published in Clinical Infectious Diseases, a global medical journal.
Ramanan Laxminarayan, founder and director of CDDEP in Washington DC, said infections caused by Gram-negative bacteria are associated with higher mortality rates compared to those caused by Gram-positive bacteria, with rates of 17.7 percent and 10.8 percent, respectively.
Toxins, environmental
2019: high toxin levels in 16% of AIIMS patients
DurgeshNandan Jha , Sep 18, 2019: The Times of India
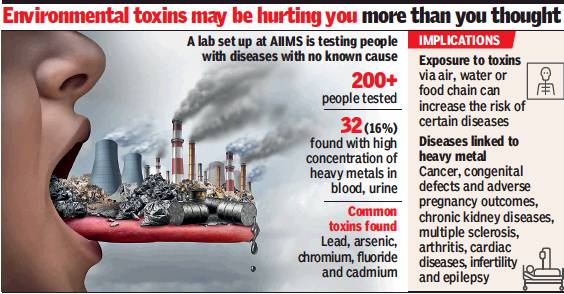
From: DurgeshNandan Jha , Sep 18, 2019: The Times of India
When doctors at AIIMS decided to run tests for environmental toxins on patients with serious illnesses whose cause couldn’t be established, they were shocked by the results. Of 216 patients tested, 32 (16%) had high levels of dangerous metals and substances, including arsenic, lead, chromium, fluoride, iron and cadmium.
The findings, doctors told TOI, reaffirm concerns about environmental toxins causing a spurt in illnesses, including cancer, neuro-development disorders, congenital diseases and gastro disorders. Most toxins get into the body through contaminated water, air and soil.
“To establish the links between toxins and diseases, we plan to screen all patients with illnesses of unknown origin for toxins,” Dr A Shariff, founder of the clinical toxicology lab at AIIMS, said.
Study to focus on cause-effect link between toxins and diseases
He added that the institute had recently set up a new lab that has facility to screen patients for more than 17 heavy metals and toxins. Diagnosis is done through a simple blood test or analysis of urine sample, Dr Shariff said. “We plan to expand the scope of testing further in the coming days,” he added.
Dr Randeep Guleria, the director of AIIMS, said identification of heavy metals in patients visiting the institute is only an index case. “Our aim is to spot trends involving patients belonging to specific areas, who have high levels of a certain toxin, and find the source,” he said.
“For example, some areas have high levels of arsenic or iron in the water and this could be causing some illness. If we can establish this link, people in the area can be made aware of it. They can be warned about the polluted water source and local administration can take policy decisions to make safe water available,” Dr Guleria said.
The incidence of lung cancer among young adults, who don’t smoke, is also diagnosed frequently. The AIIMS director said blood tests to find the presence of environmental toxins may help establish links, if any, between air pollutants and the disease.
“If we can show through research the cause and effect relationship between environmental toxins and illnesses such as lung cancer, policymakers and the public will take the threat of pollutants more seriously and act to reduce it. That is our hope,” Dr Guleria said.
According to the Lancet Commission on Pollution and Health, contaminated water, air and soil are responsible for about nine million early deaths, which is about 16% of global deaths. About 92% of these early deaths due to environmental toxicity occur in low and middle-income countries, which includes India.
Experts say children are most affected by environmental toxins as their exposure to even low concentrations during intrauterine life and early childhood can result in lifelong physical and/ or mental disabilities, if not death. “There are multiple global researches that link environmental toxins to neuro-development disorders in children,” said a paediatric neurologist.
Vaccination
72% of children not getting vaccinated on time
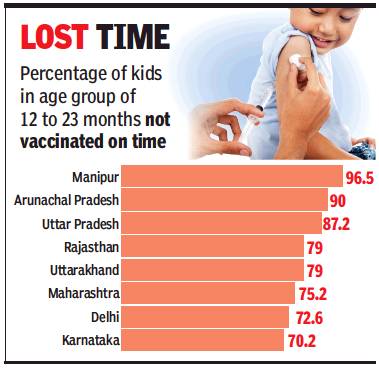
From: Shivani Azad, 72% of children not getting vaccinated on time: Survey February 6, 2018: The Times of India
‘Immunisation Delayed In 73% Of Kids In Delhi’
According to the recently published National Family Health Survey (NFHS) IV, as many as 72.5% of children surveyed in the age group of 12 to 23 months, considered a crucial period in a child’s development and immunity-building, were not getting immunised on time. The report indicates that the situation is the worst in Manipur, where 96.5% children in this age group were not immunised on time. This was followed by Arunachal Pradesh at 90%.
Almost all the major states in the country have fared poorly in terms of ageappropriate vaccination, the survey reported. While UP has 87.2% children in this category, Maharashtra has 75.2%, Delhi 72.6%, Rajasthan 79% and Karnataka 70.2%. Uttarakhand, too, has fared poorly with 79% children not getting age-appropriate immunisation.
The timing of the vaccination, say health experts, is crucial in order to ensure that the child develops immunity for a given disease at the correct age.
Therefore, realising the need to monitor the administration of age-appropriate vaccination, a separate section was included in NFHSIV for the first time.
“Non-adherence to vaccination schedule is one of the reasons for high infant mortality rate in our country. In fact, the recent NFHS data also shows that the infant mortality rate in India is currently at a high 41deaths per 1,000 live births,” said Dr DS Rawat, senior paediatrician and former director general (health) of Uttarakhand.
Elaborating on possible reasons behind these high numbers, Dr Bharti Rana, Uttarakhand state immunisation officer, told TOI that geographically-challenging terrain and acute staff crunch may be probable causes especially in many Northeastern states which have shown a dismal performance.
Interestingly, the survey indicated that while the overall percentage of immunisation in the country in the past decade had increased from 44 % in 2005-06 to 62 % in 2015-16, urban parts of the country showed a mere 6% increase — from 58% to 64% while rural areas recorded an impressive 22% rise in vaccination of children.
The survey also revealed that there was an almost 1% increase in the number of children who received no vaccinations at all — from 5.1% in 2005-06 to 6% in 2015-16. Children in Meghalaya topped this list with 22.1% of the children surveyed in the state in the age group 12 to 23 months having never been vaccinated.
Vitamin D deficiency
The findings of a 2018 study
Sushmi Dey, Vitamin-D link to obesity, diabetes, June 26, 2018: The Times of India
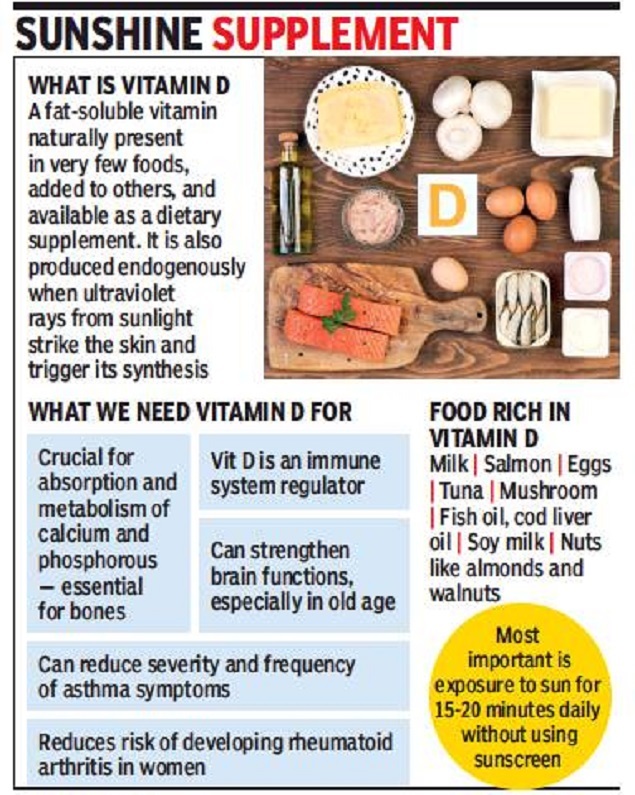
what is vitamin D;
what we need vitamin D for;
food rich in vitamin D
From: Sushmi Dey, Vitamin-D link to obesity, diabetes, June 26, 2018: The Times of India
HIGHLIGHTS
Only 5.5% of women in the country have the vitamin in sufficient amount
The findings point to high vitamin-D deficiency among women in north India, particularly those in the lower socio-economic strata
Several studies in India have shown high prevalence of the deficiency and its association with obesity
Vitamin-D deficiency is leading to increasing incidence of obesity and diabetes among Indian women, according to a study in British Medical Journal (BMJ). Findings of the cross-sectional population-based study shows that 68.6% women in India are vitamin-D ‘deficient’, whereas almost 26% have been marked ‘insufficient’.
Only 5.5% of women in the country have the vitamin in sufficient amount. The study has been conducted by researchers from AIIMS, Diabetes Foundation of India and National Diabetes, Obesity and Cholesterol Foundation. Vitamin-D deficiency is a major public health problem worldwide. Several studies in India have shown high prevalence of the deficiency and its association with obesity.
However, the latest study concentrates on women. The researchers behind the study argue that women in India are more likely to have the deficiency as many of them are confined to households and have clothing patterns that reduce exposure to sunlight.
The findings point to high vitamin-D deficiency among women in north India, particularly those in the lower socio-economic strata.
“We believe these are very important observations. Given fast and severe worsening from pre-diabetes to diabetes in Indians, I believe a simple, cost-friendly vitamin-D supplementation would prevent diabetes in many women,” says Dr Anoop Misra, chairman, Fortis C-Doc, one of the authors of the study.
Walking habits, inactivity, obesity
2017: Indians 8th laziest among 46 nations
Table 1
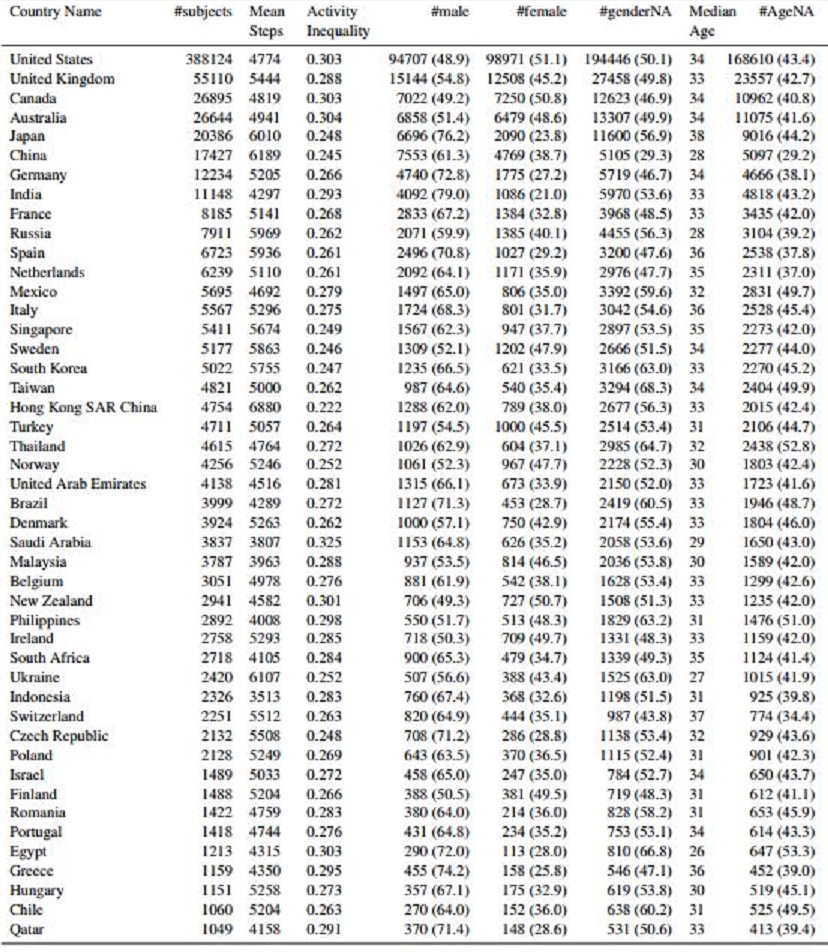
From Large-scale physical activity data reveal worldwide activity inequality, Nature, journal,
Summary of dataset statistics for the 46 countries with more than 1000 subjects (693,806 subjects in total; Methods). Countries are ordered by number of subjects in sample. Country-level analyses are restricted to these 46 countries. Percentages are in parentheses. NA refers to missingness in data. Table continued on table 2 with additional columns.
Table 2

From Large-scale physical activity data reveal worldwide activity inequality, Nature, journal,
Summary of dataset statistics for the 46 countries with more than 1000 subjects (693,806 subjects in total; Methods). Countries are ordered by number of subjects in sample. Country-level analyses are restricted to these 46 countries. Percentages are in parentheses. NA refers to missingness in data. (Continued from table 1.)
See also
Drugs and Pharmaceuticals: India
Drugs, pharmaceuticals, medical devices made by Indians
Public Health And Vital Statistics: India (Main, post-1947 page) post- 1947 statistics in general
Public Health And Vital Statistics, 1909: India
Public Health And Vital Statistics, India: 2014-2016
Public Health And Vital Statistics, India: 2016-2017
Public Health And Vital Statistics, India: 2017-2018
Healthcare and public health: Delhi
...and on several other states
