Air pollution: Delhi
(→Crop stubble fires) |
(→The twelve worst spots) |
||
| Line 1,437: | Line 1,437: | ||
=Most polluted areas in NCR= | =Most polluted areas in NCR= | ||
| − | ==The | + | ==The worst spots== |
| + | ===2017, 2018=== | ||
[https://epaper.timesgroup.com/Olive/ODN/TimesOfIndia/shared/ShowArticle.aspx?doc=TOIDEL%2F2018%2F01%2F28&entity=Ar00502&sk=5D95CDC0&mode=text Jayashree Nandi, 12 areas in city where you can never breathe clean air , January 28, 2018: ''The Times of India''] | [https://epaper.timesgroup.com/Olive/ODN/TimesOfIndia/shared/ShowArticle.aspx?doc=TOIDEL%2F2018%2F01%2F28&entity=Ar00502&sk=5D95CDC0&mode=text Jayashree Nandi, 12 areas in city where you can never breathe clean air , January 28, 2018: ''The Times of India''] | ||
| Line 1,483: | Line 1,484: | ||
“NO2 is high in all high traffic areas and in some with industrial emissions. Benzene, on the other hand, is an air toxin. It should be removed from the environment and we need a different approach for it,” said Anumita Roy Chowdhury, executive director, Centre for Science and Environment (CSE), adding that localised monitoring is helping them target local sources of pollution. | “NO2 is high in all high traffic areas and in some with industrial emissions. Benzene, on the other hand, is an air toxin. It should be removed from the environment and we need a different approach for it,” said Anumita Roy Chowdhury, executive director, Centre for Science and Environment (CSE), adding that localised monitoring is helping them target local sources of pollution. | ||
| − | + | [[Category:Bangladesh|PAIR POLLUTION: DELHIAIR POLLUTION: DELHIAIR POLLUTION: DELHIAIR POLLUTION: DELHI | |
| − | + | AIR POLLUTION: DELHI]] | |
| + | [[Category:Development|PAIR POLLUTION: DELHIAIR POLLUTION: DELHIAIR POLLUTION: DELHIAIR POLLUTION: DELHI | ||
| + | AIR POLLUTION: DELHI]] | ||
| + | [[Category:Economy-Industry-Resources|PAIR POLLUTION: DELHIAIR POLLUTION: DELHIAIR POLLUTION: DELHIAIR POLLUTION: DELHI | ||
| + | AIR POLLUTION: DELHI]] | ||
| + | [[Category:Environment and Pollution|PAIR POLLUTION: DELHIAIR POLLUTION: DELHIAIR POLLUTION: DELHIAIR POLLUTION: DELHI | ||
| + | AIR POLLUTION: DELHI]] | ||
| + | [[Category:India|PAIR POLLUTION: DELHIAIR POLLUTION: DELHIAIR POLLUTION: DELHIAIR POLLUTION: DELHI | ||
| + | AIR POLLUTION: DELHI]] | ||
| + | [[Category:Pages with broken file links|AIR POLLUTION: DELHIAIR POLLUTION: DELHIAIR POLLUTION: DELHIAIR POLLUTION: DELHIAIR POLLUTION: DELHIAIR POLLUTION: DELHIAIR POLLUTION: DELHI | ||
| + | AIR POLLUTION: DELHI]] | ||
| + | [[Category:Places|PAIR POLLUTION: DELHIAIR POLLUTION: DELHIAIR POLLUTION: DELHIAIR POLLUTION: DELHI | ||
| + | AIR POLLUTION: DELHI]] | ||
==Sahibabad== | ==Sahibabad== | ||
Revision as of 22:30, 18 September 2021
This is a collection of articles archived for the excellence of their content. |
Historical trends: Changes in pollution levels over the years:
2000-2015: University of Miami’s analysis
The Times of India Jan 07 2016
Jayashree Nandi
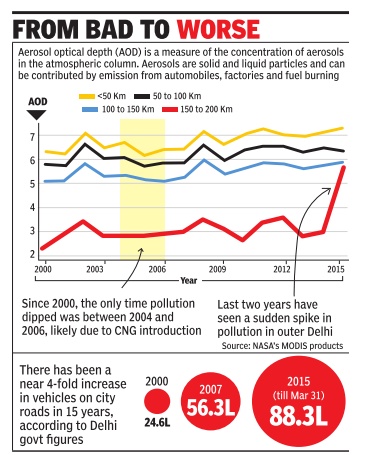
Air pollution has been increasing in and around Delhi since the year 2000 with just two blips between 2004 and 2006, a new analysis has revealed. This contradicts government agencies' claim that there is no definite trend of deteriorating air quality .
Using satellite measurements, an American scientist has found a steady increase in both PM2.5 (fine, respirable particles) and PM10 (coarse particles) in Delhi's air between 2000 and 2015, with the annual averages ranging from 74 to 92 micrograms per cubic metre.
Naresh Kumar, associate professor of environmental health at the University of Miami, USA, analysed satellitebased aerosol optical depth (AOD) in and around Delhi 2000 onwards, using data from Moderate Resolution Imaging Spectroradiometer (MODIS), on board the NASA satellites Terra and Aqua. AOD measures the concentration of aerosols or solid and liquid particles suspended in air that can arise from human activities, such as driving and construction, or natural factors like dust and water vapour.
His analysis shows the worst air quality in a 50km radius around Connaught Place and the cleanest in a range of 150-200km, showing how urbanization causes pollution.The AOD around Connaught Place ranged from 0.6 to 0.7, whereas in the US it was less than 0.2.
Kumar says industries and burning of garbage and plant matter could also be driving up air pollution, especially in winter when a blanket of cold air makes the dispersion of pollutants difficult. About ve hicles, he says, they are among the main sources of PM2.5 and reactive gases, such as nitrogen oxides and carbon monoxide, and volatile organic compounds. “If the city wants to cope with air pollution, it needs a multi-sectoral approach.“
Kumar is also tracking the impact of the odd-even experiment in Delhi but hasn't drawn any conclusions yet.“Weather plays an important role in dispersion and transport of air pollution. The 1952 London smog was caused by high levels of air pollution and cold air masses.“ But he says halving the number of diesel vehicles on the road will certainly reduce people's local exposure to pollutants.
Kumar is running a map: precise.ccs.miami.edudelhi that shows air pollution data in real-time. Each place, he says, has a more or less fixed capacity to disperse air pollution. “The capacity will remain the same in the future unless artificial filters are installed to check the increasing pollution in the city . The problem is that the pollution from anthropogenic (human) activities has been increasing dramatically without any effective mechanism to clean the air pollution, assuming it will disperse automatically .“
2011-18
From: Atul Mathur, Sep 7, 2019: The Times of India
See graphic:
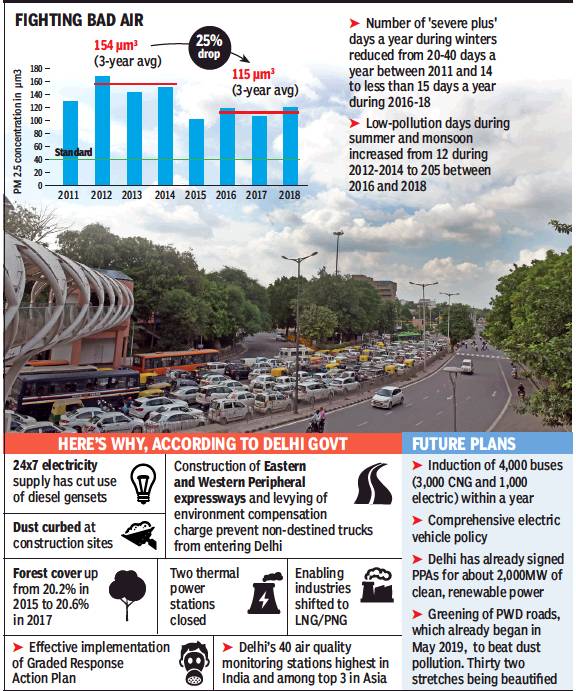
2011-18: air quality and pollution levels in Delhi.
2012-19 Aug: air quality improves steadily
August 17, 2019: The Times of India
From: August 17, 2019: The Times of India
More ‘good’ air days this year than in past 7 years
New Delhi:
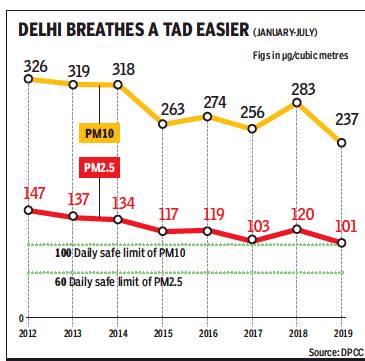
Delhiites breathed a lot easier as light rain kept the air “good”. However, this may not be considered a short-term phenomenon as data provided by Delhi Pollution Control Committee (DPCC) shows that the first seven months of the year also recorded much better air in the corresponding period since 2012.
The average air pollution levels from January to July this year, both in terms of PM10 and PM2.5, have been lower than the corresponding period in the last few years.
While the average PM2.5 level has been 101 micrograms per cubic metre (µg/ m3), it was 147 in the corresponding period in 2012. Similarly, the average PM10 level in 2012 between January to July was 326 µg/m3. This has now come down to 237 µg/m3 this year. The safe values for PM10 is 100 µg/m3, while it is 60 for PM2.5. DPCC clarified that between 2012 and 2017 data was collected from four air quality monitoring stations, while it was calculated from 24 stations in 2018 and 2019. However, Anumita Roy Chowdhury from Centre for Science and Environment (CSE) said the analysis has generally fallen in with the trend witnessed in the last few years, including studies by SAFAR and Central Pollution Control Board (CPCB).
“If you look at the annual data, you can see that we have arrested pollution over the last few years and it has stabilised to an extent,” Roy Chowdhury added.
In the last two years, the capital has seen the impact of the graded response action plan (GRAP) being put in place during winter. The comprehensive action plan (CAP) was implemented last year directing for action to be taken across various sectors. “All coal power plants have been shut down in Delhi. The industrial belts and Delhi, in general, are shifting to cleaner fuels. We are also cracking down on diesel vehicles, so small changes are being seen in terms of pollution. This is a longterm fight and we need to continue to crack down upon such problems,” Roy Chowdhury said.
Delhi’s air quality has been oscillating between “good” and “satisfactory” categories for the past one week, making it one of the longest spells of clean air this year. The authorities have attributed the improvement in air quality to increased rainfall and wester n disturbance.
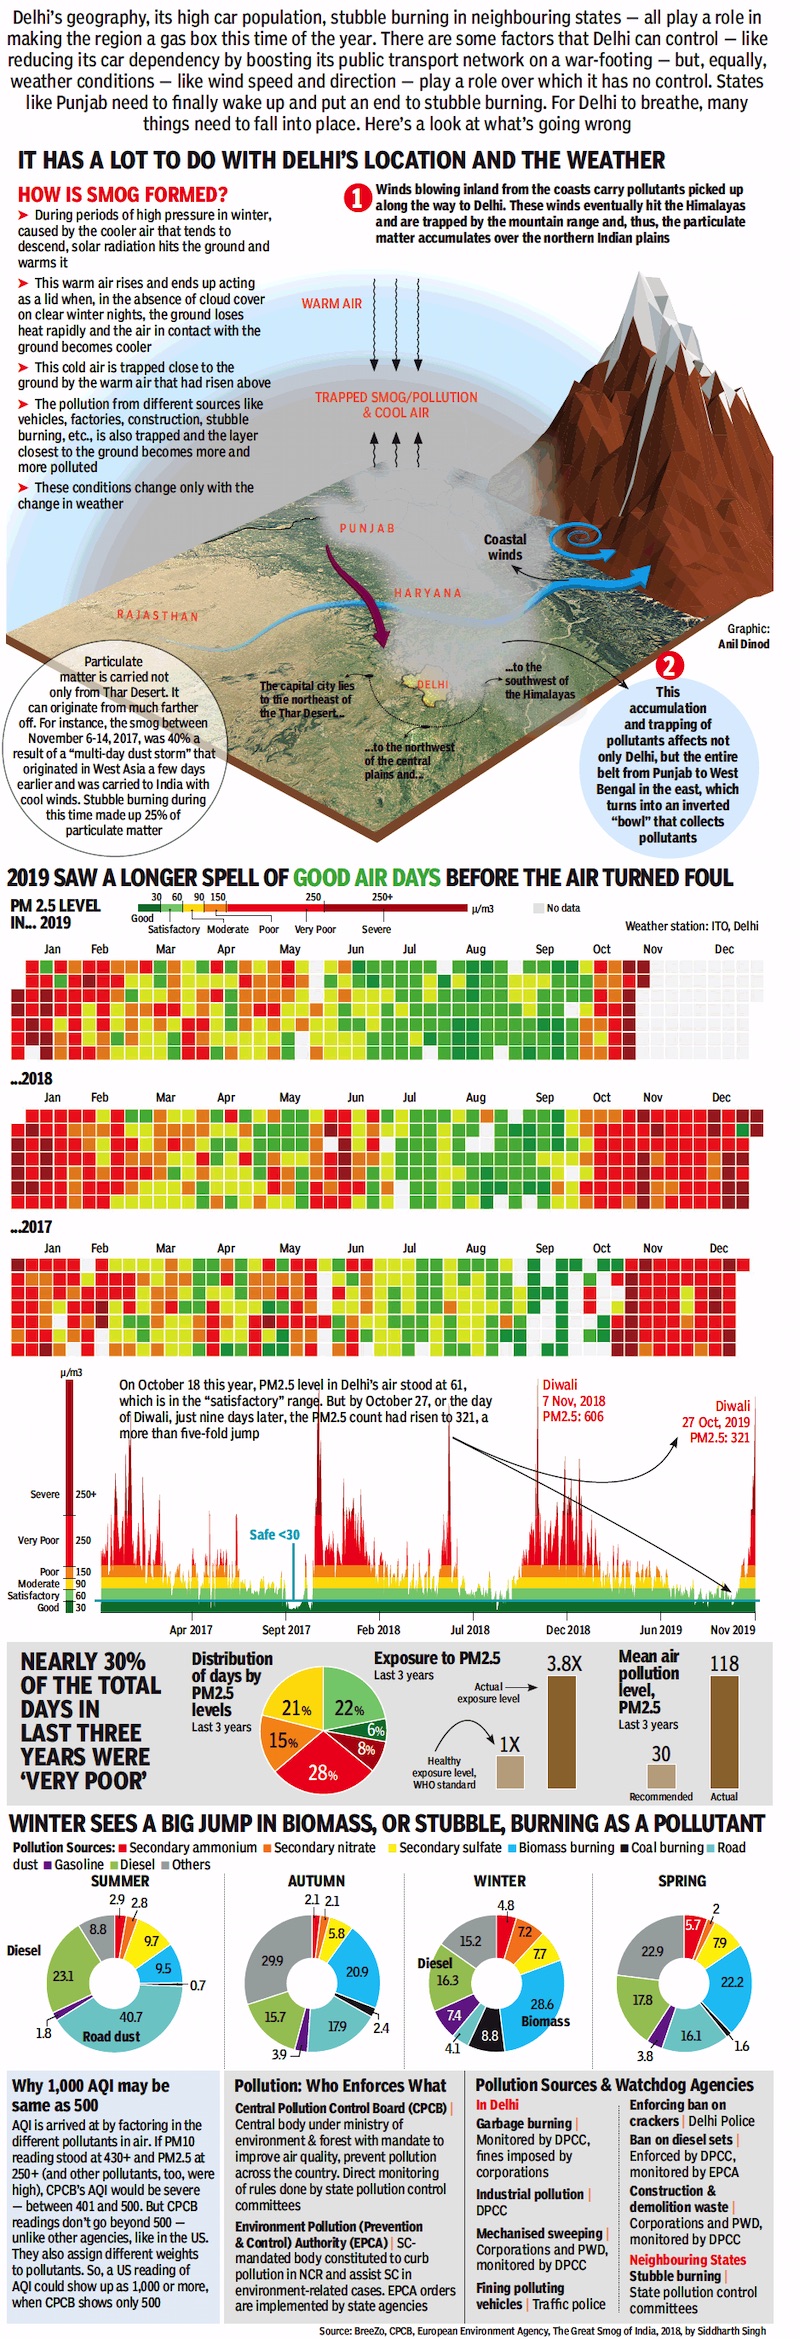
2017-19: trends and causes of Air pollution in Delhi
From: Nov 5, 2019: The Times of India
See graphic:
2017-19: trends and causes of Air pollution in Delhi
Causes of pollution
2000-18
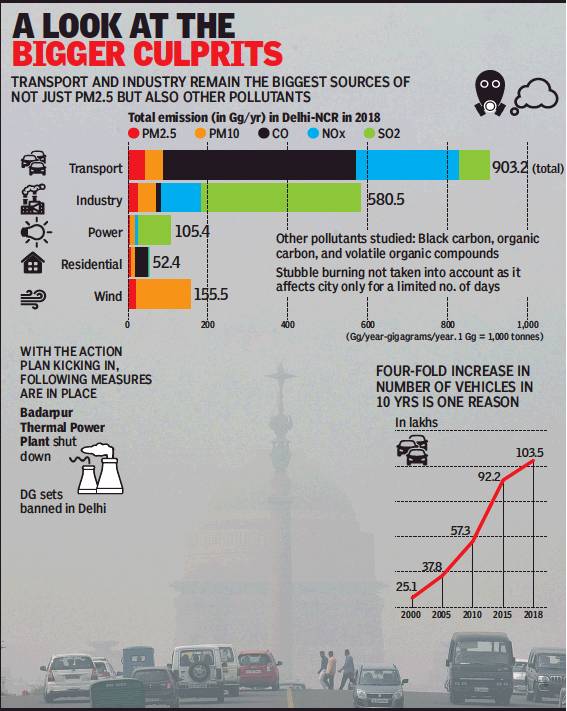
2000-18: growth in number of vehicles
From: October 16, 2018: The Times of India
See graphic:
The share of various sources of pollution in Delhi in 2018
2000-18: growth in number of vehicles
2010-18
Stubble burning in neighbouring states may be drawing everyone’s attention during the peak pollution days in the capital in pre-winter harvest season, but it is the vehicular emission which is the biggest culprit followed by industrial emission in making Delhi’s air dirty.
Both these sectors pollute the entire NCR the most round the year through emitting different kinds of pollutants while biomass burning simply adds to the woes during a short period of 15-20 days.
The ministry of earth sciences (MoES) on Monday released its new emission inventory, showing how transport and industry emit highest amount of pollutants whether it is the deadly PM2.5 or the hazardous nitrogen oxide (NOx) and sulphur dioxide (SO2).
“The emission inventory suggests that there is a substantial increase of emissions from transport and industrial sector (in the past eight years), while the contribution from residences have shown a substantial decline,” said the MoES secretary, M Rajeevan.
The emission inventory is the most effective tool used to identify and quantify the amount of pollutants emitted into the air. It may help the government in dealing with the problem through policy interventions by factoring in real reasons of pollution.
In its comparative analysis, the ministry’s report shows that the total emission of PM2.5 (particulate matter less than 2.5 micrometres in diameter) increased in the city by 15% in 2018 as compared to 2010. It also shows the transport sector emitted the most PM2.5 (41%) followed by wind blown dust from roads and other sources (21.5%) and industries (18.6%) in the capital. The PM2.5 can penetrate deeply into lung and cause respiratory problem.
Asked the status of emission from stubble burning, Rajeevan told TOI that the report did not take into account emission from crop residue burning as it is a seasonal phenomena which is restricted to only few days during the harvest period. “Overall, its contribution is not much if you look at the annual emission inventory data,” he said.
A comparative study shows that the emission from residential sector has been reduced drastically in 2018 as compared to 2010 due to high penetration of LPG connections. The ministry claims it to be the result of the government’s Ujjwala scheme which is meant for providing LPG connections to BPL families. It, however, says the burning of cow dung cake in outskirts of Delhi and brick kiln making are hampering the gain of LPG replacement to an extent.
Asked about emissions from transport and industrial sectors when everyone these days has been talking about stubble burning, Sunil Dahiya, clean air campaigner of the Greenpeace India, said, “Industries and transport are the most important consistent sources of pollution throughout the year and should not be allowed to hide behind biomass burning which must be tackled but is a 15-20 days episodic event.”
Referring to the launch of ‘Air Quality Early Warning System’, Dahiya aid, “We hope that the forecasting and prediction system will help take stringent actions on polluting industries and transportation system as well.”
2000-2017: Why Delhi’s pollution has been growing
DPS RK Puram Study Analysed Met Data From 2000 To 2017
The increase in Delhi’s pollution levels in the last few winters may be attributed to meteorological conditions, which are not only bringing pollutants from north India due to stubble burning, but also trapping it in the capital — a study by Delhi Public School (RK Puram) has found.
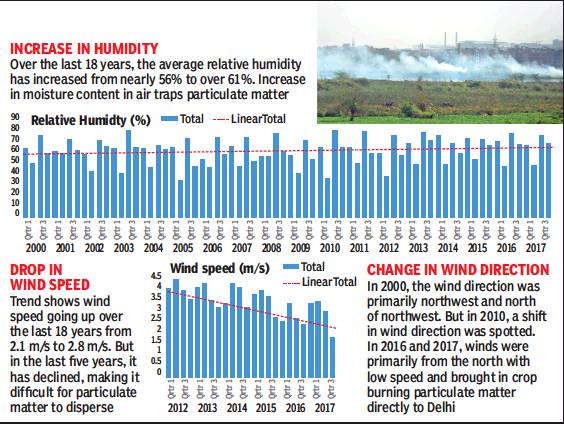
The study— which analysed IMD’s data between 2000 and 2017— found that there had been a slight increase in relative humidity, coupled with a drop in average wind speed over the past five years. It further spotted changes in wind direction over this period and found that there had been a shift in the direction from northwest in 2000 to north in winter months, which directly brought in stubble burning pollutants from Punjab and Haryana.
The study was carried out to determine the factors responsible for the increase in pollution during winters and looked at a number of parameters, including wind speed and directions, PM 2.5 and PM 10 levels, temperature variations, rainfall and humidity levels, the school said.
It found that in terms of wind direction, there had been a general change from northwest and north of northwest in 2000 to northern winds, which was first observed in 2010 and in particular in the past two years.
“This explains why high pollution is observed in October and November. Winds from Punjab and Haryana were bringing in particulate matter that persists in Delhi as it acts as a sink. Diwali and New Year celebrations with firecrackers further add to pollution levels,” the study stated. The research found two other factors that assisted this phenomenon — relative humidity and wind speed.
While between 2000 and 2017 there had been a general rise in wind speeds until 2010, thereafter a decline was reported. The average wind speeds in Delhi fell from 3m/s to less than 2m/s in the last five years — meaning there was less air movement and dispersal of pollutants.
The study also pointed out the increase in average relative humidity between 2000 and 2017 from 56% to over 61%, which provided more moisture in the air to trap the particulate matter.
“The IMD data from 2000 to 2017 was analysed for around two months to determine the reasons for the change in Delhi’s weather and why pollution levels have been rising. The study also looks at why occurrence of loo has reduced, which has been primarily attributed to an increase in morning and evening temperature variations,” said Niva Chhonkar, head of biology department, and one of the researchers.
The project was handed over by the principal, Vanita Sehgal, and chairman of DPSS, VK Shunglu with the other researchers, including the head of geography department Rupa Das and students Aryaman Sharma and Anandita Tewari of Class XI.
Graphic
From: July 8, 2018: The Times of India
See graphic:
2000-2017: Delhi’s pollution has been growing because of increase in humidity, drop in wind speed and change in wind direction
2017-18: 26% in summer/ 36% winter is Delhi’s fault, rest external
August 17, 2018: The Times of India
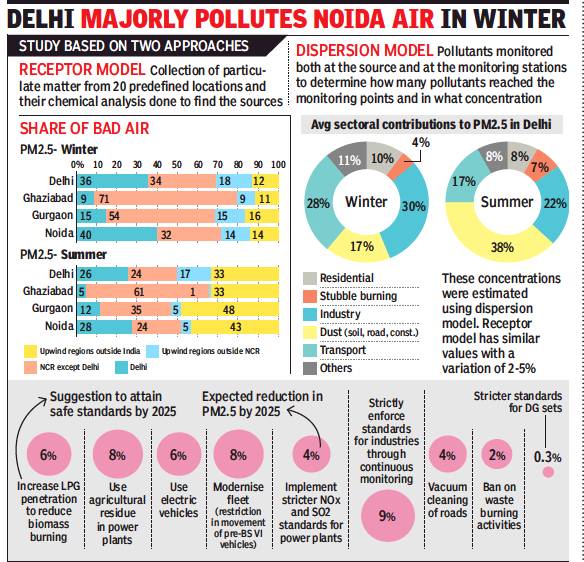
From: Jasjeev Gandhiok, 36% of Delhi’s winter bad air is its own doing: Study, August 17, 2018: The Times of India
Summer Share Is 26%, But Factors Outside India Damage More
Delhi itself may be responsible for just 26% of its PM2.5 (microscropic, respirable particles) pollution, a new study released on Thursday revealed. This figure goes up to 36% in the winter months. Most of the pollution in this category are attributed to upwind regions beyond the city.
These are the findings of the source-apportionment study jointly carried out by The Energy and Resources Institute (TERI) and Automotive Research Association of India (ARAI) to derive sectorial contributions to air pollution in Delhi and NCR. Data for the study was derived from 10 days of air quality monitoring in nine stations in Delhi, four in UP and seven in Haryana in winter and summer of 2016-17.
The study says Delhi itself contributes around 26% to the microscopic particles concentration in summers while NCR contributes around 24%. A whopping 33% come from “upwind regions outside India” and another 17% from “upwind regions outside NCR”. In winter, Delhi accounts for around 36% of the PM2.5 level, while NCR adds 34% and regions outside NCR and India together contribute 31% of the polluting particles.
“In summers, the contribution of outside sources is higher on account of higher wind speeds and enhanced atmospheric transport of pollutants,” explained the study. “In the NCR towns, the contribution of emissions from Delhi varied as per their location with respect to Delhi and prevailing winds with Noida, which is downwind of Delhi, receiving 28% and 40% of its PM 2.5 concentrations from Delhibased sources, respectively, in summer and winter.”
The study made use of two approaches to calculate the sources of pollution in the region: a receptor model involving chemical analyses of all samples collected from the 20 stations, and a dispersion model aimed at capturing the dispersal and movement of pollutants from the sources to the monitoring stations. In both the models, Delhi’s leading source of pollution in summers was ‘dust’, which contributed to around 38% of the total PM2.5 concentration. In winters, industry and transport were the major contributors, injecting 30% and 28%, respectively, in the PM2.5 levels.
The report noted that within the 30% contribution of industries, brick-making accounted for 8%, power stations 6% and stone crushers 2%. In transport’s 28% share, trucks were responsible for 8%, twowheelers 7%, three-wheelers 5% and cars a mere 3.4%.
“It is shocking how low Delhi’s contribution to the pollution is,” said Ajay Mathur, director general, TERI. “It shows that action is required not just in Delhi, but in the entire NCR region and even beyond, particularly areas upwind of NCR.”
The study suggests remedial measures such as enhanced LPG penetration to reduce biomass burning, use of agriculture residue in power plants to prevent crop burning and coal usage, and stringent pollution standards for industries, among others.
“If the present measures remain and additional measures suggested are implemented, there can be considerable drop in PM2.5 and PM10 levels by 2025-2030,” said Mathur. The study had taken as factors the secondary pollutants created due to sulphur oxide and nitrogen dioxide emissions never before included in pollution studies.
2018>19: C&D waste, road dust among top polluters
Ritam Halder, Oct 19, 2019: The Times of India
From: Ritam Halder, Oct 19, 2019: The Times of India
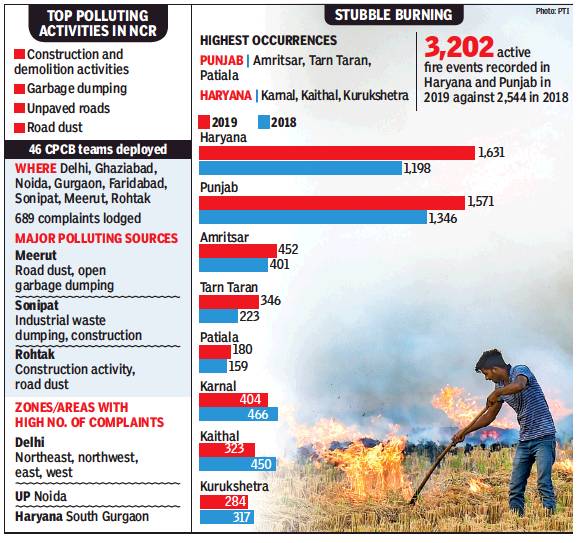
Construction and demolition activities, garbage dumping, unpaved roads and road dust are the top polluting activities plaguing NCR, Central Pollution Control Board inspection teams have found.
CPCB has deployed 46 teams that are inspecting different areas in Delhi, Ghaziabad, Noida, Gurgaon, Faridabad, Sonipat, Meerut, and Rohtak.
This year, Sonipat, Meerut and Rohtak were the three new cities where CPCB sent teams to identify pollution sources. In Meerut, road dust and open garbage dumping, in Sonipat industrial waste dumping and construction activity while in Rohtak construction activity and road dust are the primary causes of pollution, an official said, adding that total 689 complaints have been registered with the apex pollution control board till date.
“In Delhi, North East, North West, East and West districts are the zones with the highest number of pollution complaints. Same is the case with Noida under UPPCB and South Gurgaon under HSPCB,” he said.
CPCB officials also pointed out the challenges faced in implementing the graded response action plan measures in NCR.
These include inadequate response of agencies during field actions, jurisdictional issues, poor performance of complaint redressal, delay in redressal of grievances, extremely low public participation, enforcement of directions — dependence on courts or tribunals, multiple agencies — lack of ownership and lack of resources and infrastructure.
The apex pollution board officials also pointed out how the number of stubble burning incidents has crossed 3,200 in Punjab and Haryana, with highest occurrences in Amritsar, Tarn Taran, Patiala, Karnal, Kaithal and Kurukshetra.
“A total of 3,202 active fire incidents have been recorded in Haryana and Punjab in 2019 against 2,544 such incidents in 2018. In Haryana,1,631stubble burning instances have been reported in 2019 till now while in Punjab, 1,571 such case were recorded,” the CPCB data showed.
Crop burning significantly contributes to increasing pollution in the city. A senior CPCB official said that at present, around 7% pollution in Delhi is caused due to stubble burning in surrounding states.
“However, depending upon the wind speed and direction, its contribution might increase in the coming days,” he said.
The data provided by CPCB showed that in Punjab this year, the top three areas where the highest number of instances of stubble burning was recorded were Amritsar, Tarn Taran, Patiala. Amritsar recorded 452 instances, Tarn Taran 346 and Patiala witnessed180 cases, it said.
In Haryana, the top three areas where highest number of instances of stubble burning were recorded were Karnal, Kaithal and Kurukshetra, the data said.
In Karnal, 404 instances were observed while in Kaithal, 323 incidents were observed and in Kurukshetra, 284 active fire incidents were observed, the data showed.
Most farmers growing rice and wheat in north India prepare their fields for the wheat crop in October-November by burning the crops.
2019, Feb: construction/ demolition; garbage top causes
From: Ritam Halder, The truth is in Delhi’s air: What builds destroys too, March 27, 2019: The Times of India
Construction, Demolition To Blame For 60% Of PM Emission
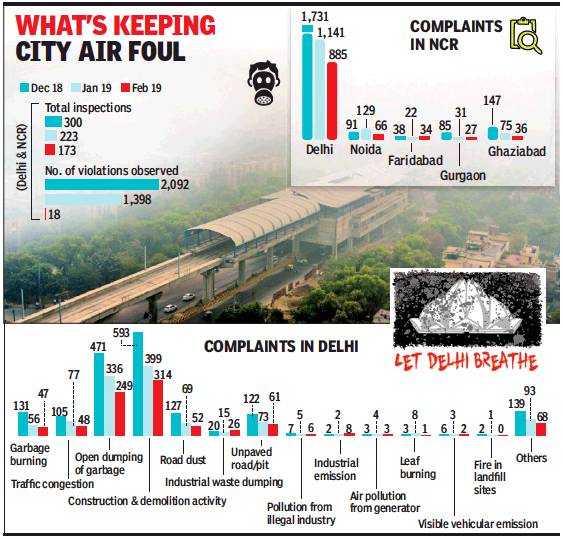
As Delhi and its neighbours struggled to rein in the monster of pollution for yet another winter, data showed that construction and demolition activity was the biggest source of foul air in the National Capital Region from December 2018 to February 2019. The data was collated from the Central Pollution Control Board inspections and complaints received online.
Of the complaints received on the SAMEER web app of CPCB in December, 593 related to construction and demolition. The numbers went down in the subsequent two months, but were still high at 399 and 314, respectively. Particulate matter — PM10 and PM2.5 — is the primary pollutant in Delhi, with levels often shooting up to 10 times the permissible limit. A study conducted by IIT-Kanpur in 2016, on behalf of the Delhi environment department, stated that road dust and dust particles from construction and demolition sites comprised nearly 60% of this particulate matter. Soil, road dust and airborne fly ash are the major sources of PM10 pollution in summer, forming a layer that envelopes the city.
While 131 complaints of garbage burning were recorded in December, in January, the number stood at 56, coming down further to 47 in February. Traffic congestion complaints were 105, 77 and 48, respectively, in the three months. For road dust, 127 complaints were received in December, 69 in January and 52 in February.
“A lot of complaints are coming in on the web app. People are even putting in complaints regarding encroachments, burning of wires, foul smell from some nearby drain, and so on. These can’t be categorised in the prominent sources of air pollution, but we are keeping a tab on these too and forwarding the complaints to the authority concerned,” a senior CPCB official told TOI.
The apex pollution control board had last year put up a list of hotspots in NCR. These are Anand Vihar, Bawana, CRRI Mathura Road, DTU, Dr Karni Singh Shooting Range, Dwarka Sector-8, Jahangirpuri, Mundka, NSIT Dwarka, Narela, Okhla Phase-II, RK Puram, Rohini, Shadipur, Wazirpur, Faridabad Sector-16A, Vikas Sadan, Gurgaon, Haryana, Vasundhara (Ghaziabad), Knowledge Park-III, Greater Noida Sector-125, Noida, UP and RIICO Industrial Area III, Bhiwadi.
2020: Seasonal variation in the sources of pollution
Priyangi Agarwal, June 22, 2021: The Times of India
From: Priyangi Agarwal, June 22, 2021: The Times of India
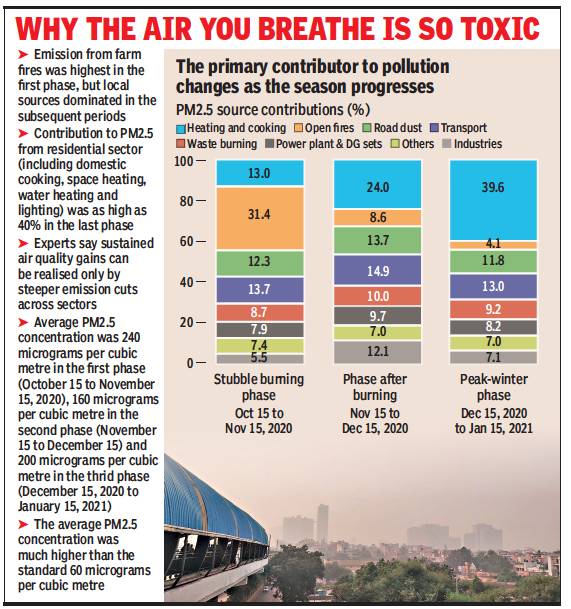
An analysis of the PM2.5 contribution of various sectors to Delhi’s air in the winter of 2020 by the Council on Energy, Environment and Water (CEEW) has revealed that emission from farm fires was highest in the first phase of the season, but local sources dominated in the subsequent periods. Emissions from household solid fuel usage for cooking and space heating was the primary contributor, followed by road dust and transport.
At 31.4%, stubble burning dominated the phase from October 15 to November 15, 2020, according to the study. Local sources were mostly responsible for the pollution in the peak winter season as household heating and cooking significantly increased to 39.6% during the phase from December 15, 2020, to January 15, 2021. The average contribution of road dust and transport sectors remained around 12% and 14%, respectively, during the winter.
Waste burning’s contribution to PM2.5 was estimated at 9%. Emissions from power plants and diesel-generator sets largely remained unchanged at 7%.
Kurinji Selvaraj, programme associate, CEEW, told TOI: “While emissions from regional sources, such as stubble burning, dominated at the start of the winter last year, contributions from local sources, such as household emissions (space heating), primarily drove the second episodic 'peaking' of the pollution levels in Delhi in the subsequent months. This makes a case for active control of local sources in the upcoming winter to keep pollution under check.”
Delhi should proactively use air quality forecast and early warning systems to execute emission control measures in advance, targeting prominent sources during forecasted high-pollution days, Selvaraj said. The study was jointly conducted by Kurinji Selvaraj, Adeel Khan and Tanushree Ganguly.
According to the study, the average transport contribution to Delhi’s air in the winter period last year was 14%, but the congestion levels were almost 92% lower in April 2020 compared with the same period in 2019. As the lockdown restrictions began to be relaxed and economic activity resumed in the latter half of the year, congestion levels were only 20–25% lower between August and December 2020 than the corresponding congestion levels in 2019. The lower congestion levels are representative of the reduced traffic volumes and vehicular emissions.
The study stated that the average PM2.5 concentration was 240 micrograms per cubic metre in phase 1 (October 15 to November 15, 2020), 160 micrograms per cubic metre in phase 2 (November 15 to December 15) and 200 micrograms per cubic metre in phase 3 (December 15, 2020 to January 15, 2021). Delhi residents were exposed to air that does not meet the National Ambient Air Quality Standards (60 μg/m3) for more than half of 2020 despite low economic activity levels due to the pandemic-induced lockdown.
Coal-based industries
2021
February 26, 2021: The Times of India
From: February 26, 2021: The Times of India
Coal ban: Delhi pays for neighbours’ laxity
Polluting Fuel Being Used Widely In NCR Towns
New Delhi:
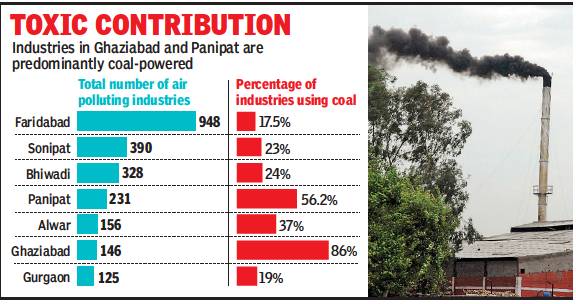
Delhi may have cleaned up its act by banning coal, but it is allowed in the rest of National Capital Region (NCR). Coal-based industries are still considered a major source of pollution in the region, highlights State of India’s Environment 2021, a report released by Centre for Science and Environment (CSE).
The report states the share of industries using coal especially in Ghaziabad and Panipat, was found to be 86% and 56.2%, respectively, which could be a lead factor behind the high PM2.5 and PM10 levels in the region.
The assessment, carried out in the seven major industrial centres in NCR —Ghaziabad, Panipat, Sonipat, Faridabad, Gurgaon, Alwar and Bhiwadi — was carried out in 2020 to identify industrial pollution hotspots and the major air polluting industrial sectors. The study found that coal was the most consumed fuel in all seven districts, with around 1.4 million tonnes of coal being used annually in the industries. The second most consumed fuel was agro-waste.
“We are still way behind in bringing in fuel switch in the whole of Delhi-NCR and coal is still the king of fuels for industries,” the report states. It also calculated the chimneybased industrial pollution load of different districts to find the industrial hotspots and their share in industrial air pollution in a district.
“The findings clearly highlight the industrial areas and sectors that the authorities need to focus on to bring down pollution levels in these major industrial districts,” it says.
A 2018 source apportionment study conducted by Automotive Research Association of India, a research and development organisation set up by the automotive industry with the central government and TERI, a Delhi-based non-profit organisation, had shown that the share of industrial pollution in NCR was much higher compared to Delhi. The share of industrial sector in terms of PM10 was 2% in Delhi, while it was 28% in the rest of the NCR. The PM2.5 count for the same category was 3% and 24%, respectively. Citing CPCB data, the current report states that out of 88 major industrial clusters in the country, 35 showed an overall “environmental degradation”, 33 worsening air quality, 45 an increase in water pollution, and at 17, land pollution has become worse.
“Better usage of Continuous Emission Monitoring System, data for deterrence, engagement of concessionaires for the management of industrial waste, identification of illegal industries, introducing concept of common boilers (wherever possible) and developing strategy to curb fugitive emissions from industries are some of the steps that the government can take,” it points out. “But the gamechanging move would be bringing in fuel change in all air polluting industries in Delhi-NCR.”
Coal-fired (thermal) power plants
2020-21
June 17, 2021: The Times of India
Eleven coal-fired power plants in National Capital Region (NCR) contributed just 7% to Delhi's PM2.5 pollution on an average between October 2020 and January 2021, while vehicles contributed 14%, according to a new study.
The findings are significant considering that Delhi government had recently moved the Supreme Court, seeking closure of the coalfired power plants in the vicinity of the city using outdated polluting technology.
On April 1, the Union environment ministry had issued a notification with amended rules allowing thermal power plants within 10 kilometers of NCR and in cities with more than 10 lakh population to comply with new emission norms by the end of 2022.
In its latest analysis, Council on Energy, Environment and Water (CEEW), a Delhi-based not-for-profit policy research institution, said, “Given the directives by Environment Pollution (Prevention and Control) Authority on account of Graded Response Action Plan implementation and presumably low demand due to lockdown, the power plants also operated at much lower levels in October and November 2020.”
“We found that energy generation from NCR coal-fired plants was 25 and 70% lower in October and November, respectively, compared with the corresponding months in 2019, implying a lower contribution in these months,” the report read. The research team of L S Kurinji, Adeel Khan, and Tanushree Ganguly found that the average contribution of emissions from the11 power plants in Delhi-NCR was 7% between October 2020 and January 2021.
“However, once the ‘fuss’ about air quality dissipated and demand picked up, the daily energy generation levels scaled up to 2019 levels in December 2020 and January 2021,” it said. The share of vehicular emissions to Delhi's PM 2.5 pollution was 14% on an average between October 2020 and January 2021.
According to the study, a relatively longer stubble-burning period and unfavourable meteorological conditions were primarily responsible for Delhi’s worsening air quality in winters last year. Household heating and cooking were responsible for 40% of the pollution burden in December 2020 and January 2021. PTI
Crop stubble fires
See Crop stubble burning: India
…cause winter pollution
Jasjeev Gandhiok, Dec 12, 2019 Times of India
From: Jasjeev Gandhiok, Dec 12, 2019 Times of India
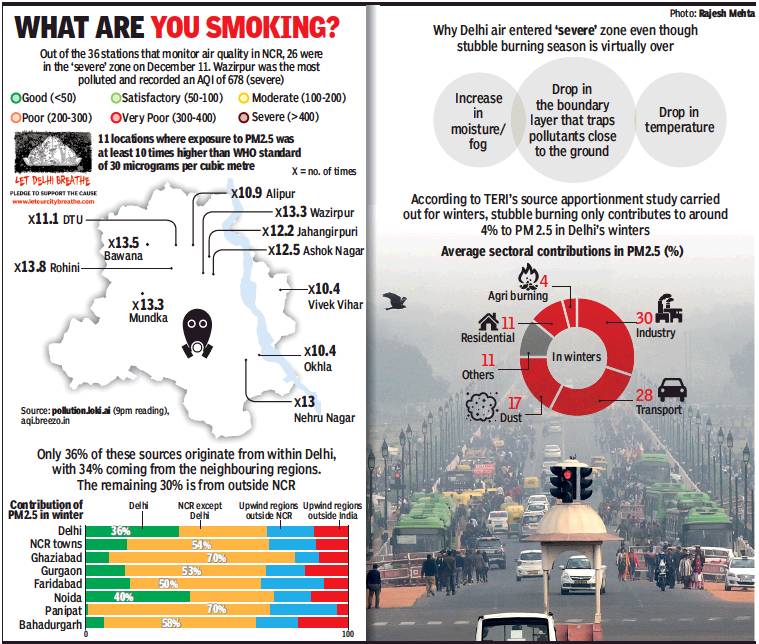
The stubble burning season is virtually over, but as Delhi’s air quality slips into the “severe” zone again, it begs the question what’s fouling up things now. Data showed that farm fires’ contribution to Delhi’s overall PM 2.5 concentration was below 5% on Wednesday, but pollution levels at most stations were at least five times the standards.
In fact, the contribution of stubble burning was never more than 50% this winter season, touching a high of 44% in November, according to the daily data analysed by System of Air Quality and Weather Forecasting And Research .
According to experts, a mix of meteorological factors — an increase in moisture/fog, a drop in the boundary layer that traps pollutants closer to the ground and a drop in the temperatures — is playing its part, leading to a rise in the contribution of local factors.
A source-apportionment study carried out jointly by The Energy and Resources Institute and Automotive Research Association of India (ARAI) in 2018 had revealed that the contribution of industries to Delhi’s overall PM 2.5 concentration in winter was the highest at 30%, followed by the transport sector (28%). Dust contributed 17%, followed by others (10%) — smaller local sources like DG sets, refuse burning, crematoria, airport, restaurants, incinerators and landfills.
The researchers said it was difficult to analyse the overall contribution of stubble burning because of its episodic nature.
“The sectoral contributions are averaged for the whole modelling/monitoring period and, hence, don’t highlight the contribution of agricultural burning, which happens during a certain number of days,” the study stated.
To blame Delhi alone for high pollution wasn’t right either, the study indicated, stating local sources from within the city contributed only 36% to its air, with 34% coming from NCR towns. The remaining 30% comes from outside Delhi-NCR, with 18% from the regions upwards of the capital and 12% from outside India.
Sagnik Dey, associate professor at IIT-Delhi, said the capital generally recorded a second ‘peak’ pollution period in late December and the beginning of January, owing to adverse meteorological conditions. “Stubble burning does not play a part at this time of the year, but the low temperature, calm winds and fog can all lead to pollutants getting trapped in Delhi-NCR,” Dey said.
Kuldeep Srivastava, scientist at IMD, said Delhi was likely to see a return of dense fog in the second half of December, a phenomena that usually carried on through mid-January.
BreeZo, a data analytics programme and app, on Wednesday showed Delhi’s PM2.5 concentration at some air quality monitoring stations to be 13 times the WHO standard (30 micrograms per cubic metre).
Account for 70% of pollution on some days
Crop fires sometimes have 70% share in Delhi’s air pollution Amit Bhattacharya, `Crop fires had 70% share in city's peak air pollution' Contribution, Nov 08 2016 : The Times of India
Up From Zero On Nov 1: Expert
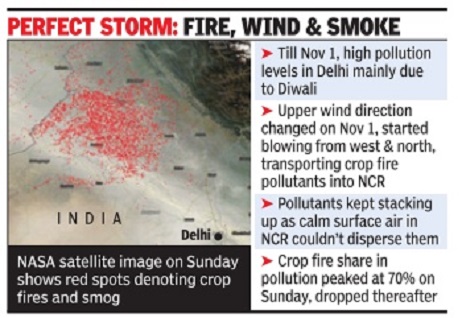
Crop fires in Punjab and Haryana contributed as much as 70% of the pollution load in Delhi on Sunday , [6 Nov] the city's worst air day in a long time, a leading government scientist said, basing his assessment on computer models used to determine the capital's air quality index.
Gufran Beig, program di rector of Safar (System of Air Quality and Weather Forecasting and Research), under the earth sciences ministry, said on Monday that the proportion of pollutants from crop fires in Delhi's air rose dramatically from almost zero on November 1 to a peak of 70% on November 6.
“Safar's chemistry transport model gives a clear picture of the share of pollution from external sources. It shows pollution load from crop fires in Punjab and Haryana rose steadily after November 1 due to favourable upper air winds,“ Beig said.
The smog cleared significantly on Monday , helped by a pick-up in surface winds and a change in upper-air direction. “The share of cropburning in Delhi's air quality was down to 50% and dropping,“ the scientist said. Like a perfect storm, various factors fell in place to create the dense smog spell over NCR, which SAFAR programme director Gufran Beig described as an “extreme pollution event“.“While the surface air was calm over the capital, upper air wind direction changed around November 1, when winds blew in from between west and north, directly transporting pollutants from crop fires,“ the scientist said.
The calm surface winds and an air ridge over NCR prevented the pollutants from dispersing, leading to an accumulation of toxic chemicals in the air.
Beig said the PM 2.5 concentrations in Delhi's air were at unprecedented levels on Sunday .
“Since we started SAFAR five years ago, we have never seen the value of PM 2.5 concentrations crossing 700µg m3. Just as extreme weather events are increasing so are extreme pollution events such as this one,“ he said.
SAFAR's figures on contribution of biomass burning in Delhi's air pollution come on a day when Union environment minister Anil Madhav Dave said crop burn ing was responsible for just 20% of the pollution level in the national capital.
That figure is based on source apportionment studies that have variously put the external contribution to winter pollution in Delhi at 20% to 35%. Beig said these studies give an average which would hold true in general terms but can't be used for specific events.
“This is like telling you what the normal rainfall at a place is. SAFAR's figures, on the other hand, are based on the actual conditions that existed during this period,“ the expert said.
Due to surface winds picking up, Beig predicted that the pollution levels would drop on Tuesday , while still staying in “severe“ zone, and come down further to “very poor“ levels on Wednesday .
…cause winter pollution
Jasjeev Gandhiok, Dec 12, 2019 Times of India

From: Jasjeev Gandhiok, Dec 12, 2019 Times of India
The stubble burning season is virtually over, but as Delhi’s air quality slips into the “severe” zone again, it begs the question what’s fouling up things now. Data showed that farm fires’ contribution to Delhi’s overall PM 2.5 concentration was below 5% on Wednesday, but pollution levels at most stations were at least five times the standards.
In fact, the contribution of stubble burning was never more than 50% this winter season, touching a high of 44% in November, according to the daily data analysed by System of Air Quality and Weather Forecasting And Research .
According to experts, a mix of meteorological factors — an increase in moisture/fog, a drop in the boundary layer that traps pollutants closer to the ground and a drop in the temperatures — is playing its part, leading to a rise in the contribution of local factors.
A source-apportionment study carried out jointly by The Energy and Resources Institute and Automotive Research Association of India (ARAI) in 2018 had revealed that the contribution of industries to Delhi’s overall PM 2.5 concentration in winter was the highest at 30%, followed by the transport sector (28%). Dust contributed 17%, followed by others (10%) — smaller local sources like DG sets, refuse burning, crematoria, airport, restaurants, incinerators and landfills.
The researchers said it was difficult to analyse the overall contribution of stubble burning because of its episodic nature.
“The sectoral contributions are averaged for the whole modelling/monitoring period and, hence, don’t highlight the contribution of agricultural burning, which happens during a certain number of days,” the study stated.
To blame Delhi alone for high pollution wasn’t right either, the study indicated, stating local sources from within the city contributed only 36% to its air, with 34% coming from NCR towns. The remaining 30% comes from outside Delhi-NCR, with 18% from the regions upwards of the capital and 12% from outside India.
Sagnik Dey, associate professor at IIT-Delhi, said the capital generally recorded a second ‘peak’ pollution period in late December and the beginning of January, owing to adverse meteorological conditions. “Stubble burning does not play a part at this time of the year, but the low temperature, calm winds and fog can all lead to pollutants getting trapped in Delhi-NCR,” Dey said.
Kuldeep Srivastava, scientist at IMD, said Delhi was likely to see a return of dense fog in the second half of December, a phenomena that usually carried on through mid-January.
BreeZo, a data analytics programme and app, on Wednesday showed Delhi’s PM2.5 concentration at some air quality monitoring stations to be 13 times the WHO standard (30 micrograms per cubic metre).
Industrial pollution
The Times of India, December 20, 2016
Jayashree Nandi Industry's top choice of fuel cheap but deadly
EPCA's Plea In SC To Ban Use Of Furnace Oil Brings Threat To Air In Focus
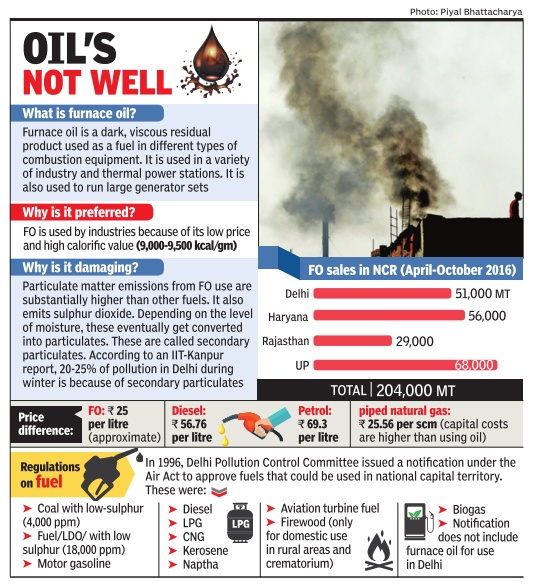
The national capital region (NCR) may be one of the most polluted regions in the country but many industries located are still running on an extremely polluting fuel -furnace oil.
A substantially cheaper alternative to natural gas and diesel, FO, as it is called in industrial terminology , is marginally better than bitumen in quality .It emits substantially higher particulate matter (PM) and secondary sulphate particles, said scientists.
The widespread use of FO came to light only recently after the Supreme Court-mandated Environment Pollution Control Authority (EPCA) investigated its use in NCR and submitted a report to SC. The report also highlighted the use of pet coke, another high sulphur fuel, in NCR.
Industries in Ghaziabad's Sahibabad and Loni Road industrial areas admit that they use FO despite knowing how harmful it is for environment.A large steel company TOI visited in Sahibabad, for instance, runs its generator on FO and natural gas.
“It's a 30:70 ratio, with FO making 70% of the fuel. It's cheap and serves the purpose. I don't think the Supreme Court can ban it because industries are a powerful lobby . Also, what will oil refineries do with the FO they generate?“ said its head of purchase. FO is priced around Rs 25 per litre, compared to Rs 56.76 for diesel, Rs 69.3 for petrol and Rs 24.5 per standard cubic meter for piped natural gas.
About three months ago, the price of FO fell to Rs 15 per litre due to the dip in crude oil prices. “The prices fell seven times in the past year or so. It just makes economic sense for industries to opt for a cheaper fuel. Of course, it's way more polluting and you can tell from the chimney smoke whether a factory is using FO. It's usually black or blue smoke. That's why we invested in piped gas supply ,“ said a senior representative from another steel company's hot rolling and heat treatment division.
TOI also found several dyeing, paper recycling and glass industries using FO.
A representative from Indo Petro, a dealer, said, “Many industries in Delhi too use it illegally because it's cheaper.“
Anant Bhargav, director of IFP Petro Products, said, “The government can have Bharat Standard (BS)-type norms for industrial fuel. Some industries even use very toxic tyre oil made from used rubber and ty res. Major dealers supply these fuels.“
Around 30 forging industries use FO in Ghaziabad, added an Industrial Area Manufacturer's Association member.
Mukesh Sharma, scientist at IIT Kanpur and author of Comprehensive Study on Air Pollution and Green House Gases (GHGs) in Delhi -the latest source apportionment study , said, “The PM emissions from FO are substantially higher than other liquid or gaseous fuels. Since the sulphur content in FO and pet coke is high, a large amount of sulphur dioxide (SO2) is released that converts into fine sulphate particles in the atmosphere.“
The sulphur content in FO is 15,000 to 20,000 ppm and about 70,000 ppm in pet coke compared to around 50 ppm in diesel. Scientists recommend that high sulphur fuel should only be used in cement industries because the calcium oxides generated in these factories can neutralise the sulphur emission.
During a recent hearing in SC, a lawyer representing the Centre sought time to respond to EPCA 's submission. The apex court has given the Centre four weeks to examine whether pet coke and FO, if used as industrial fuel, is harmful.
“In case the government comes to the conclusion that its use is indeed harmful, it may consider issuing appropriate directions in terms of Section 3(2)(v) of the Air Act,“ the order said.
According to EPCA 's report, a big manufacturer of solar panels, a glass company and steel companies are using FO. Apart from PSUs, a private company also supplies FO.
Factories in residential areas
From: Mayank Manohar & Paras Singh , These 51,837 factories shouldn’t even be there, August 20, 2018: The Times of India
Polluting Units Flourish In Residential Areas Of City
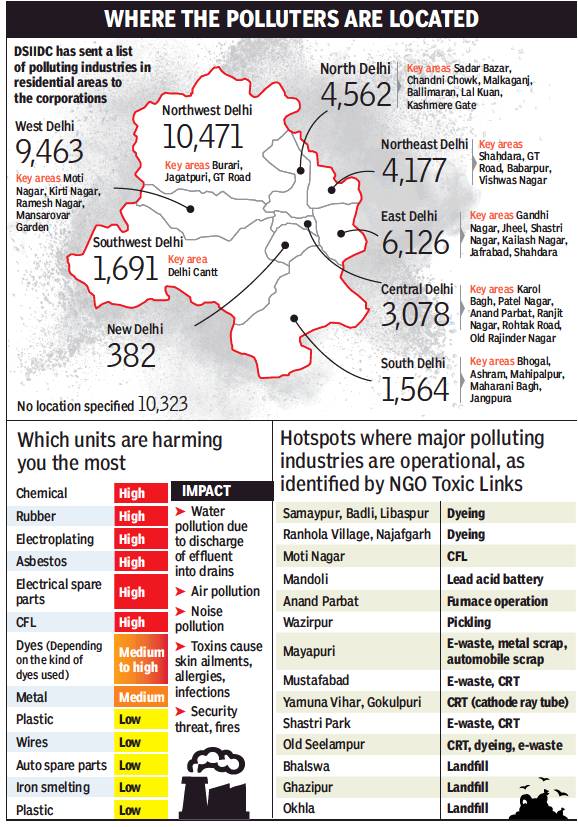
Many residential areas in Delhi are no longer distinguishable from planned industrial areas. This is because thousands of polluting industries brazenly run from these places right under the nose of the authorities. The Delhi State Industrial and Infrastructure Development Corporation (DSIIDC) listed 51,837 units operating from non-conforming/residential areas and asked the three municipal corporations to initiate action against them.
Delhi’s air, already polluted by dust, industrial and vehicular emissions and soot from crop burning, is additionally assailed by these illegal industrial units that deal with dyes, chemicals, rubber, asbestos, plastics, electrical and auto spare parts, iron smelting and fluorescent lights.
These pollute water by discharging effluent directly into drains and air by emitting noxious particles. In 1996, DSIIDC had, under the relocation scheme for industrial establishments, allotted plots to factory owners running their units from residential areas. And as far back as 2003, the Supreme Court, in its judgment in MC Mehta v Union of India, had directed that all industrial units that had come up in non-conforming areas on or after August 1, 1990 should be closed within a given timeframe. But, even in 2018, as the DSIIDC listing proves, they continue operations from residential areas.
According to Master Plan Delhi 2021, only 28 domestic small-scale industries like matchstick making, incense sticks and garland making are allowed from residential areas. Under MPD, all polluting industries are to be shifted out of Delhi by 2021.
The analysis of the data released by DSIIDC shows most violations in Moti Nagar, Kirti Nagar, Ramesh Nagar, Jangpura, Najafgarh and Mansarovar Garden, all in west Delhi, Bhogal, Ashram, Mahipalpur, Maharani Bagh and Jangpura in south Delhi, Gandhi Nagar, Jheel, Shastri Nagar, Kailash Nagar, Jafrabad and Shahdara in east Delhi; and Sadar Bazaar, Chandni Chowk, Malkaganj, Ballimaran, Lal Kuan and Kashmere Gate in north Delhi. Other highly affected areas are Karol Bagh, Patel Nagar, Anand Parbat, Rohtak Road, Rajinder Nagar, Old Rajinder Nagar in central Delhi, Shahdara, GT Road, Babarpur and Vishwas Nagar in northeast Delhi, and Burari and Jagatpuri in northwest Delhi.
In 2014, NGO Toxics Link identified 18 hotspots in Delhi, including Samaypur, Badli, Okhla, Ghazipur, Mayapuri, Moti Nagar, Yamuna Vihar, Gokulpuri, Shastri Park and Wazirpur. The report cited Central Pollution Control Board’s data for 2010 showing Delhi among the cities with the most polluted air. “In 1975, vehicular population in Delhi and Mumbai was same. But by 1997, Delhi had three times more vehicles than Mumbai. Vehicular pollution contributed 6% of the total air pollution load in Delhi. Another 25% was generated by industries and coal-based thermal power plants,” the report stated.
The municipal corporations have only listed 32,541 illegal factories in areas under their jurisdiction — 11,805 under the East Delhi Municipal Corporation, 11,214 under the north body, and 10,023 in the south. EDMC has so far verified 2,251 units, and reported that 1,145 of these were found to have shut down. “The survey is going on, and we have issued notices to the industries that we have inspected so far,” said an EDMC official. The north civic body, in its survey, found 9,522 units operating from residential areas, while 874 it had listed were found vacant and 818 were sealed.
Many of the listed units are either locked or closed, said SDMC officials. “We have directed the zonal officials to find out whether the industries deemed to be operating illegally were still running or had shut down. Those still found operating will be sealed for failure to relocate as required by the Delhi Municipal Corporation Act,” said an SDMC official.
Sources in the civic bodies disclosed that these industries are illegal not only because they run from unauthorised areas, but also because they do not have the licence to operate. “It is totally up to the enforcement agencies to keep track of the polluting factories operating from residential areas,” a source declared. Despite several orders of Delhi HC and DSIIDC, the corporations have failed to take action. On July 9, hearing the Bawana Factory Welfare Association vs Govt of NCT & Others case, an HC bench expressed unhappiness “on the tardy action on this issue by the corporations”.
Dust in Delhi
From: February 28, 2018: The Times of India
See graphic:
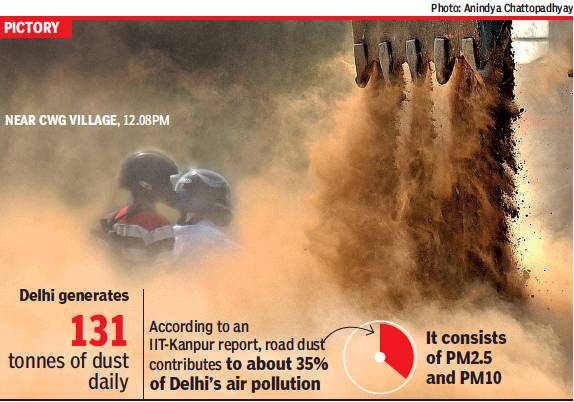
131 tonnes of dust are generated every day in Delhi
Dust pollutes Delhi more than cars: Government
Dhananjay Mahapatra & Amit Anand Choudhary
The Times of India Jan 08 2015
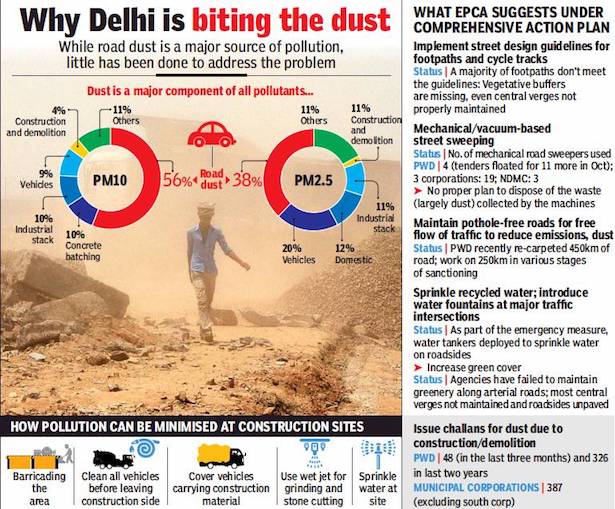
The various pollutants that contribute to Delhi’s air pollution, and their relative share
From Mayank Manohar & Risha Chitlangia, November 15, 2017: The Times of India
See graphics
Concentration of particulate matter, SO2 and NO2 respectively by vehicles and industries
Dust is a major components of pollutants in Delhi
The various pollutants that contribute to Delhi’s air pollution, and their relative share
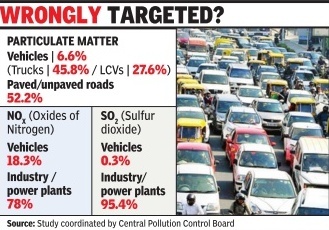
SC told vehicles contribute just 6.6% and dust's share is 52% : Ministry of Environment and Forest
The major source of pollution in the capital is dust particles and not vehicular emissions, the ministry of environment and forest (MoEF) submitted before Supreme Court.
While dust contributed 52% of particulate matter in the air, pollutions from vehicles, including trucks and light commercial vehicles, accounted for just 6.6%, the ministry said.
“In Delhi, vehicles contribute only 6.6% particulate matter (PM) emission, 18.3% oxides of nitrogen (NOx) and 0.3% of noxious sulphur dioxide (SO2) emissions whereas dust particles from pavedunpaved roads contributed 52% of particulate matter pollution,“ the ministry said, quoting a Source Apportionment Studies conducted in Delhi, Kanpur, Pune, Mumbai, Chennai and Bengaluru.
“The source apportionment study carried out in Delhi reveals that re-suspension of the dust is also the major source of particulates in the ambient air. There is a need to focus on initiation of steps to reduce re-suspension of dust and managementregulation of construction activities,“ MoEF said.
Of the total particulate matter and NOx pollution caused by vehicles, private cars were responsible for 22% while trucks caused 45.8% and light commercial vehicles 27%, it said.
“Industry power plants contribute 78% of NOx and 95.4% of SO2 content in the ambient air,“ the ministry said. It also responded to several suggestions made by se nior advocate Harish Salve, who as amicus curiae had personally filed an application drawing the court's attention to the deteriorating ambient air quality of the capital, which squandered the advantage of converting its entire city passenger transport fleet to cleaner fuel CNG on court's orders more than a decade back.
Clarifying that the National Green Tribunal headed by former SC judge, Swatanter Kumar, was already seized of the issues raised by Salve, the ministry said Salve's suggestion to restrict plying of private cars on alternative days might not be feasible.
“It may not be an effective and feasible option as people using personal cars are not likely to shift the mode of travel. Persons using two-wheelers are likely to shift to public transport, which may lead to excessive pressure on services without yielding much benefit,“ it said and informed the court that it has sought views of public transport providers on this issue.
Salve had also said schoolchildren were the worst sufferers of the deterioration in ambient air quality and suggested closure of schools on `red alert days', when the air quality nosedives. “Exposure of school going children to higher level of pollution occurs only for limited period during travel, while Air Quality Index (AQI) is based on 24hourly average standard and prolonged exposures. Moreover, most schools are closed for winter breaks (when the air quality becomes worse),“ it said.
The ministry of road transport and highways said that “it is high time that the pollution control authorities conduct studies for apportionment of causes of pollution in habitations including Delhi.All increase of pollution is always ascribed to automobiles based on studies done overseas“.
Green activists disagree
The Times of India, Jan 09 2015
Green activists: Govt misled court on Delhi's pollution
Neha Lalchandani
The government's submission before the Supreme Court that the major source of pollution in the capital was dust particles, and not vehicular emissions, was dismissed by environmental activists as ridiculous, with some even questioning the intent behind the environment ministry's stand.
The ministry of environment and forest had told the court that dust was responsible for 52.2% of the pollution load in Delhi while vehicles contributed only 6.6%. But a paper by the Indian Institute of Tropical Meteorology , which started maintaining Delhi's air quality data since the Commonwealth Games, says vehicles contributed to 32% of the total particulate matter of size 2.5 micron and less (PM 2.5) in 2010. The figure has since risen to 36%. Other sources, including unpaved roads and construction activity, contributed 28% in 2010, which came down to 26% in 2013. Sources pointed out that the MoEF report talks about PM in general, not drawing a difference between PM 10 and PM 2.5. The latter is universally considered to be the more harmful of the two, and its levels are considered when drawing up policy.
Questioning the intent behind MoEF's submission, the Centre for Science and Environment accused the ministry of trying to scuttle the role of vehicles in Delhi's rising air pollution “at the behest of automobile companies as combating pollution today requires tough measures to restrain cars and encourage public transport“.
The IITM report, titled `Emissions inventory of anthropogenic PM2.5 and PM10 in Delhi during Commonwealth Games 2010' and authored by Saroj Kumar Sahu, Gufran Beig and Neha S Parkhi says, “The present estimated wind blown dust is more than the total estimation from all other sources and more than four folds in comparison to transport emission. The resuspended dust is associated with the vehicular movement on the road and is directly proportional to the number of ve hicle, its weight and speed as well as the amount of dust on roads.“ It also states that vehicles are the likely cause for even this. “It is likely to be more serious in a city like Delhi due to more vehicles...H ence the transport sector which has direct contribution through fossil fuel combustion and indirect related to road condition provide the key to better air quality in NCRD if properly mitigated.“
Anumita Roychowdhury , who heads CSE's clean air campaign, said, “MoEF has only cited the PM10 inventory , which is the coarse particles.Their limited study , which looked at PM 2.5 levels, was withdrawn by NEERI as it was based on a flawed methodology and ended up blaming cooking LPG for 61% of PM2.5 in Delhi.
Even after stating the government has implemented the SC order on relocation of polluting industries, the re port claims that industry and power plants are still responsible for 78% of nitrogen oxides and 95.4% of sulphur dioxide in the capital. Point is, even dust becomes the carrier for emissions.“
A study carried out by CSE has found that on national holidays when traffic volume is less, pollution is lower.“For instance, on Republic day of 2013, PM2.5 levels in RK Puram declined compared to the previous day from 244 microgramme per cum to 153 microgramme per cum and again rose to 178 microgramme per cum on January 27 and to 345 microgramme per cum by January 28. Similar trends were observed elsewhere,“ said Roychowdhury .
40% smog was Gulf dust; Stubble Burning 25%/ Nov 2017
Amit Bhattacharya, 40% of smog was dust from Gulf: SAFAR, November 17, 2017: The Times of India
Stubble Burning Contributed 25%; Rest Local Emissions
Dust travelling thousands of kilometres from a severe storm in the Gulf contributed significantly to the weeklong killer smog that choked Delhi-NCR and much of north India from November 7 onwards, an analysis by the government’s air quality research body, SAFAR, has concluded.
SAFAR said dust coming in from the Gulf constituted nearly 40% of pollutants in the smog while stubble-burning in Punjab and Haryana contributed around 25%. Making up the remaining 35% was pollution produced locally in Delhi-NCR.
In a nightmarish confluence of factors, favourable upper winds carried the dust from the Gulf and smoke from crop burning into Delhi-NCR while an anti-cyclonic wind circulation over the region pushed these pollutants towards the surface and trapped them there as surface conditions were calm.
The incursion of these pollutants began on the night of November 6 and continued till November 10, said Gufran Beig who heads SAFAR. “By 5pm on November 7, the air quality had dropped to severe levels,” he said.
PM 2.5 concentration was recorded at 537 micrograms (µg)/m3 on November 7, nine times the 24-hour average standard. It rose to a peak of 640 g/m3 the next day. According to the SAFAR analysis, if external sources of pollution had not played a role, Delhi’s air quality on November 8 would have been closer to 200 g/m3.
More significantly, the analysis said that the measures initiated by the environment pollution control authority (EPCA) under the graded response action plan (GRAP) may have helped reduce pollution by as much as 15%. That was the observed offset in SAFAR’s offline model between known anthropogenic and weather induced natural sources and observations from the ground.
The incursion had ceased by November 10, SAFAR said. “There was no pumping and influence of stubble burning and Gulf storm dust after November 10 night, owing to slowing down of upper air winds and change in wind direction,” the analysis stated.
The storm had hit Saudi Arabia, Iraq and neighbouring countries on October 29, sending a massive cloud of sand and dust into the air that was visible in NASA satellite images. SAFAR said the storm continued up to November 4. This dust rose 1.5 to 3km into the atmosphere “where winds became very strong (15-20kmph) and direction became towards India (westerly, north-westerly) and dust affected larger region of Delhi.”
While local weather conditions had taken over by November 11 evening, it took another couple of days for pollutants to get flushed out of the region, it said. This was because the inversion layer (the height at which a warmer layer of air exists) fell from 1,600m to just 45m in eight hours on November 11, trapping pollutants close to the ground and delaying recovery of air quality by another two days.
Local sources, not crop fires, cause 90% of pollution: EPCA/ 2019
Oct 16, 2019: The Times of India
Local sources of pollution in Delhi and NCR mainly contribute to the poor air quality that plagues the national capital every winter. They need to be tackled on a priority basis, the Supreme Court-mandated Environment Pollution (Prevention and Control) Authority has said.
“Incidents of external biomass burning cannot be ignored. These are worsening the pollution levels in Delhi-NCR. But biomass burning is contributing less than 10% to the pollution, which means local sources account for 90% of the pollution. Uttar Pradesh, Haryana and Delhi; all are to blame,” EPCA member Sunita Narain said.
“Chimney and dust pollution as well as open burning of plastic and rubber scrap are major causes for concern,” the expert added.
While chief minister Arvind Kejriwal has often blamed stubble burning in the neighbouring states for the deterioration in air quality in the city, SAFAR, the ministry of earth science's air quality and weather forecast service, has said that the share of stubble burning in the PM 2.5 concentration in Delhi has remained less than 10% so far. PM 2.5 stands for particulate matter less than 2.5 microns in diameter. They can be breathed deep into the lungs, and may even get into the bloodstream.
The effect of stubble burning ranged from 0 to 9% between October 10 and October 13, revealed a SAFAR report released on Monday. “Delhi's air quality index (259) is at the higher end of the poor category. It touched the very poor category last night for a brief period, indicating the peak impact of stubble fires to a maximum of 8%,” it had said in the report.
“The impact of biomass burning is going to be negligible soon due to the change in circulation pattern,” the SAFAR report said.
EPCA also said that illegal godowns have come up on agricultural land in Bahadurgarh district of Haryana. They are burning waste that cannot be recycled, it added.
“Plastic segregation and recycling are important for the city. The Delhi Development Authority has given land for it at Tikri Kalan and Ramky Enviro Engineers Limited lifts the waste that cannot be recycled for controlled burning in waste-toenergy plants,” Narain said.
“The problem is that it is overflowing outside Tikri. There are illegal segregation units that burn the waste that cannot be recycled,” she said.
Kejriwal had requested the Supreme Court and the National Green Tribunal to do something about stubble burning in neighbouring states.
The Graded Response Action Plan to curb air pollution in Delhi-NCR came into force on Tuesday, rolling out stricter measures depending on the need to discourage private vehicles on roads, use of diesel generators, and closing brick kilns and stone crushers.
Non-linear city structure; poor air circulation
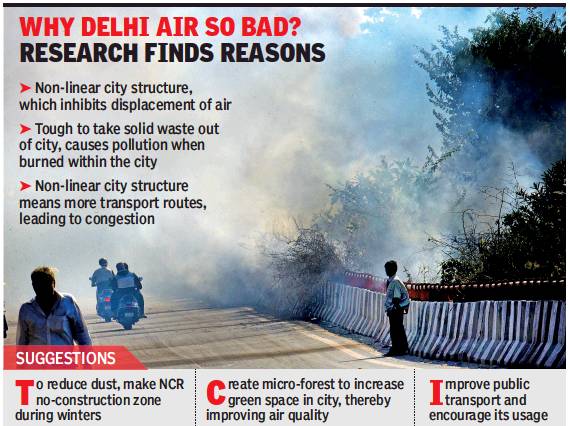
From: Mohammad Ibrar, Studies on Delhi air failed due to use of wrong parameters, says Jamia prof, March 5, 2018: The Times of India
A professor of environmental studies at Jamia Millia Islamia has claimed that the studies conducted on Delhi’s air pollution are faulty as these were conducted against wrong parameters.
Citing the non-linear and amorphous structure of the city and poor air circulation as the major reasons behind the city’s air pollution, S M Akhtar suggested creation of microforests perpendicular to major wind directions in the city and making winter a no-construction season.
The studies on air pollution in Delhi have failed as these have used the same tools as those applied in linear cities like Mumbai, Kolkata and Chennai, Akhtar said. “There is a need to study Delhi’s urban form and population density pattern.” Delhi is a city that is expanding at all directions, he added.
Akhtar claimed that the major source of the environmental problem is yet to be identified. “I believe that the major source of pollution is dust particles from construction sites and material transportation that also catalyse depletion of watersheds and green mass of the city.”
Accordingto his study, Delhi’s concentric form and growth makes the replacement and natural revitalisation of air mass polluted by human activities very tough. “This was corroborated when we witnessed the comparison of the linear north-south urban forms of Mumbai, Chennai and Kolkata though they have a higher population density.”
Elaborating the point, Akhtar said that in linear cities, the form and orientation allows the east-west wind that travel in India to regularly replace the air mass in the city. “The linear form also allows a spinal public route for transportation that is difficult in a circular city like Delhi as it has multiple and longer routes that makes it a compulsion for many to increasingly use private transport, leading to congestion.”
The professor suggested improvement of public transport as a major step to help Delhi. Akhtar also said creation of micro-forests perpendicular to the major wind directions of the city would replenish air “much like how it was done in New Raipur”.
New green patches will also improve the city’s rainwater retention capacity and replenish groundwater, he added.
Population increase
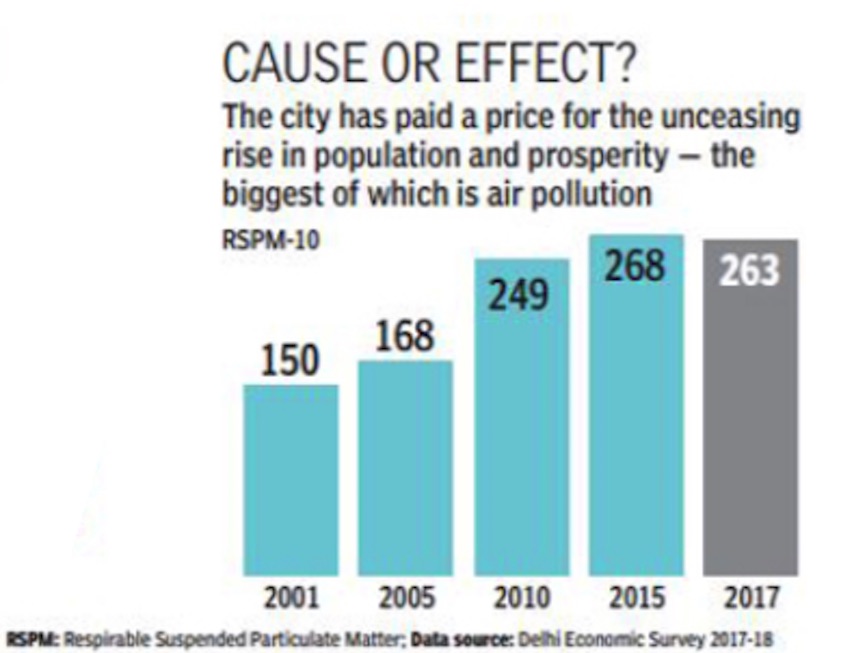
From: March 23, 2018: The Times of India
See graphic:
One of the disastrous impact of unceasing rise in population and prosperity has been a rise in air pollution. Level of air pollution in Delhi, 2001-17
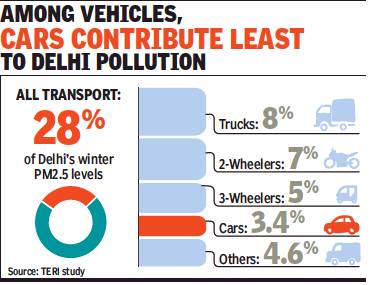
Within the transport ector, the share of 2- wheelers, three-wheelers, cars and trucks.
From: Ritam Halder, Let only CNG vehicles ply in city on bad air days: EPCA, November 13, 2018: The Times of India
Relaxes Ban On Construction, Entry Of Trucks
The Supreme Court-appointed Environment Pollution Control and Prevention Authority (EPCA) on Monday asked a task force led by the Central Pollution Control Board (CPCB) to consider banning all vehicles, except those running on CNG, in the capital during bad air days, keeping in mind the high pollution levels post-Diwali in the city.
The EPCA urged the task force to “consider” this measure and to recommend if it needed to be brought into the National Capital region (NCR) soon, if the next few days see continuation or deterioration of the air quality.
“We will, based on this discussion and review of the air quality situation, inform you tomorrow of this or other measures that would need to be taken to contain pollution in the region,” EPCA chairperson Bhure Lal said in a letter to NCR authorities.
“Public health is of utmost priority and this emergency step may be the only option we have,” the letter, a copy of which is with TOI, states.
Earlier in the day, the task force relaxed the ban on construction activities in NCR and also partially allowed trucks entry into Delhi. “In view of poor dispersion, low temperatures and high humidity during night hours, construction activities and truck traffic (into Delhi) may be permitted only during daytime between 6am to 6pm… Enforcement agencies should keep strict vigil and ensure firm actions against the violators,” it said.
The ban on industries using coal and biomass, including brick kilns, will be lifted on Tuesday. This ban did not include power plants and waste-to-energy plants.
Diesel use and air pollution on a rise in Delhi
Air pollution and Diesel use rising fast in Delhi
December 17, 2014
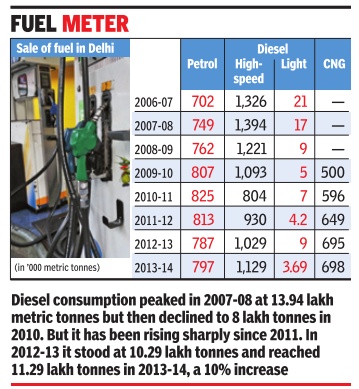
Consumption of diesel in Delhi has been increasing steadily since 2010 while that of petrol is declining. Simultaneously, air pollution--especially the concentrations of PM 2.5 (fine, respirable particles) and PM 10 (coarse pollution particles) --is on the rise.
Diesel consumption peaked in Delhi in 2007-08 at 13.94 lakh metric tonnes but then declined to 8 lakh tonnes in 2010, possibly due to higher taxes on the fuel. But it has been rising sharply again since 2011. In 2012-13 it stood at 10.29 lakh tonnes and reached 11.29 lakh tonnes in 201314, a 10% increase.
Particulate matter (PM) is associated with diesel emissions. Analysis by Centre for Science and Environment (CSE) shows PM10 levels have increased by about 75% since 2005 with occasional dips.
Anumita Roy Chowdhury of CSE's Clean Air Programme says increasing diesel consumption in Delhi is worrying. “The data only shows massive dieselization in Delhi. Diesel primarily contributes to emissions of particulate matter (PM) and oxides of nitrogen (NOX), which are both increasing.“
She said diesel vehicles emit five times more PM than petrol vehicles. “I think die sel and, if required, diesel vehicles need to be taxed in a way that the increased revenue can be used for refineries to produce clean diesel.Delhi needs 10ppm sulphur fuel by 2020,“ Roy Chowdhury added.
Diesel pricing was de-regulated earlier this year, which means it is now linked to the global market without any government intervention.
The other concern with diesel consumption is its health consequences. World Health Organization has graded diesel emissions as carcinogenic (causing cancer). Roy Chowdhury said that it is in the same category as tobacco.
The consumption of CNG has increased from 5 lakh metric tonnes in 2009 to 6.98 lakh metric tones in 2013-14.Consumption of kerosene has seen a sharp decline over the years from 1.62 lakh metric tonnes in 2006 to 1.07 lakh metric tonnes in 2010 and just 9,000 metric tonnes in 2013-14.
Stubble burning adds to Delhi's pollution: Nasa
Jayashree Nandi, May 13, 2018: The Times of India
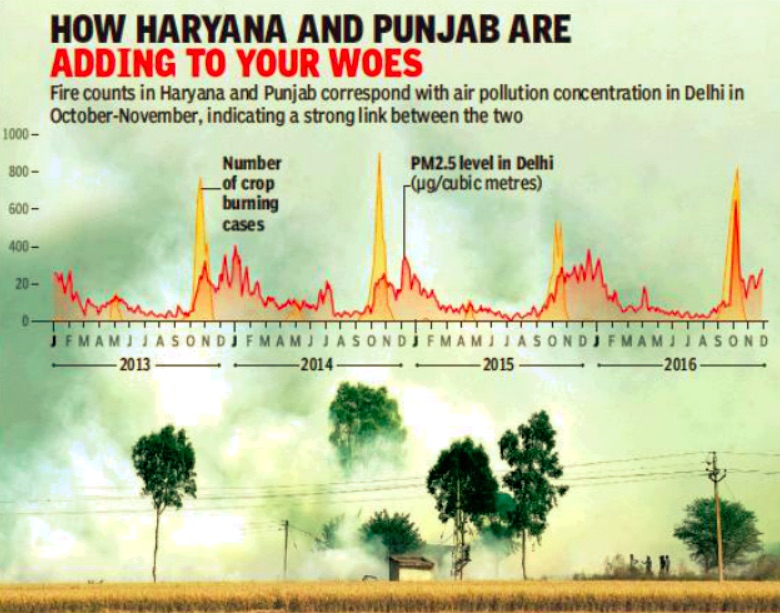
From: Jayashree Nandi, May 13, 2018: The Times of India
A new study by Nasa scientists has concluded that there is a strong link between agricultural fires in Punjab and Haryana and PM2.5 levels in Delhi during the post-monsoon months of October and November.
PM2.5 concentrations in Delhi, which is downwind to Punjab and Haryana, show a coherent increase — rising often from as low as 50 micrograms per cubic metres (µg/ m3) before the onset of the burning season to 300µg/m3 at the beginning of November when burning is under way.
During the crop burning season of 2016, the seven-day average peaked to a record high of 550µg/m3. This could also explain the severe smog episode in November 2016 when PM2.5 concentration peaked to more than 700µg/ m3 on November 5, 2016. But the study also cautions that the impact of emissions from local sources, including more than 9.5 million vehicles, industries and construction activities, cannot be ruled out. However, this study could give the government clues to averting smog episodes. While the link between crop burning and winter pollution peak was being speculated for long, this is the first scientific study to correlate fire counts in Punjab and Haryana with wind direction and parallel rise in PM2.5 concentrations in Delhi.
The study that analysed satellite data for 15 years (2002-2016) also revealed an increasing trend in crop fires. It found that there is a shift in the distribution of fires from October to November. This study, which has been accepted recently to be published in the journal of Aerosols and Air Quality Research (AAQR), uses fire data from satellites, pollution data from Nasa’s A-train sensors and PM2.5 concentrations measured at the US Embassy in Chanakyapuri.
Scientists also conducted aback trajectory (path taken by air pollution particles in the past) using a National Oceanic and Atmospheric Administration (NOAA) model. Compared to paddy stubble burning in October-November, fire counts in May (wheat stubble burning season) were found to by lower by a factor of six to eight.
As far as post-monsoon pollution is concerned, just by excluding PM2.5 data for October and November, the annual mean concentrations decreased by 10%, 7%, 12% and 13% for 2013, 2014, 2015 and 2016, respectively. “Overall, the fire counts and PM2.5 concentrations showed a linear relationship, which yields an increase in PM2.5 of 33µg/m3, given an increment in fire counts by about 100 …” the study concluded.
Back-trajectory modelling also gave scientists a clue as to why Delhi may be worst affected by crop fires. Days with extreme levels of PM2.5 were mostly associated with northwesterly winds from crop burning areas, “suggesting a profound impact of smoke transport on modulating air quality over Delhi”, the study said.
While concluding that crop fires are on the rise in Punjab and Haryana, satellite data also reveal that the number of fires was higher in October between 2002 and 2009. But this trend has now changed and a majority of fires are being recorded in November.
The number of fire counts detected between 2009 and 2016 was found to be 32% higher than those found between 2002 and 2009 by one of the satellites. But, in 2016, fires were at a record high, which also possibly explains the severe smog episode in 2016 in Delhi. “The crop burning season of 2016 has been most anomalous with maximum fire hotspots (17,804) detected over the Punjab-Haryana region … compared to average fire counts (14,310) detected between 2011 and 2015, the total fire counts in 2016 were 24% higher,” the study added.
In 2016, fire counts were up by 44% compared to the average count recorded between 2002 and 2015.
The study was led by Hiren jethva, scientist from the Universities Space Research Association at the Nasa Godard Space Flight Center; co-authors include scientists Duli Chand, Omar Torres, Pawan Gupta, Alexei Lyapustin and Falguni Patadia. The Pacific Northwest National Laboratory and Morgan State University were also part of the study.
Contribution of stubble burning to pm2 5 levels: 2019, 20
Vishwa Mohan, November 24, 2020: The Times of India
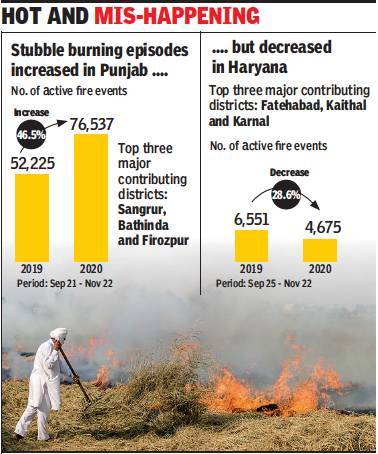
Top three major contributing districts, 2019-20
From: Vishwa Mohan, November 24, 2020: The Times of India
Contribution of stubble-burning to PM2.5 levels in Delhi-NCR went up from 10% in 2019 to 15% this year
NEW DELHI: Average contribution of stubble burning to the concentration of PM2.5 in Delhi-NCR during peak phase has increased from 10% in 2019 to over 15% this year with Punjab reporting an increase of 48% in fire incidents while these declined by 28% in Haryana.
An analysis by the environment ministry done on the basis of inputs from the CPCB and institutions of the ministry of earth sciences also shows that the number of days observed with more than 10% contribution of stubble-burning to PM 2.5 has increased from 21 days in 2019 to 26 days this year.
The maximum contribution of 42% was observed on November 5 this year. The period to analyse the contribution of biomass burning in overall air pollution varies marginally, considering early beginning of peak phase linked to harvesting and stubble-burning.
Though isolated events of biomass burning are still being reported, their contribution to overall air pollution will not be significant as both Punjab and Haryana have completed the harvest of paddy and covered nearly 50% of the areas with Rabi crops – wheat, oilseeds and pulses.
Stating that crop residue burning in northwest regions as “one of the sources of air pollution for Delhi-NCR during October-November”, the ministry noted that Punjab during September 21-November 22 period reported substantial increase of over 46% in its total count of active fire events (AFE) this year compared to the corresponding period in 2019.
On the other hand, Haryana almost during the same period (September 25-November 22) reported a decline in cases of stubble-burning by over 28%.
“Though both states this year reduced their respective acreages of non-Basmati paddy, the increase in number of cases of stubble burning in Punjab is something which needs to be examined,” said an official.
Non-Basmati paddy straw is not used as fodder as it contains high silica that animals can’t digest. Instead of using in-situ management of stubble that entails costs, farmers prefer to burn it as an easy solution, leading to increase in air pollution in Delhi-NCR.
Increase in cases of stubble burning in Punjab is, however, a clear indication of poor enforcement of ban on biomass burning, which has always been considered politically unpopular move, particularly this year when the state witnessed protests agaist central farm laws leading to possibly slack enforcement.
“It needs to be probed why farmers in Punjab resorted to stubble-burning in a big way this year after reporting consistent decline in such episodes in past three years,” said an official.
“In 2020, all the districts of Punjab except SBS Nagar have shown an upward trend in their AFE contribution, witnessing the lack of ground level implementation of the Central supported scheme,” said the ministry in its analysis.
In Haryana, on the other hand, districts such as Fatehabad, Kaithal and Karnal continue to be major AFE contributors but still show a reduction by 40% in comparison to 2019. Other key paddy-cultivating districts such as Palwal and Kurushetra have shown major reduction by 50-60% this year.
In order to support farmers, the Centre had in 2018-19 initiated a scheme for in-situ management of crop residue. The scheme is meant to support states for extending subsidies to individual farmers and custom hiring centers (CHC) for buying machinery and other in-situ farm implements to manage stubble-burning. During 2018-19 and 2019-20, over Rs 1,178 crores of funds were released under the scheme. Even during 2020-21, release of Rs 600 crore has been approved by the Centre.
Summers: dust, power plants/ 2019
Jasjeev Gandhiok, July 6, 2021: The Times of India
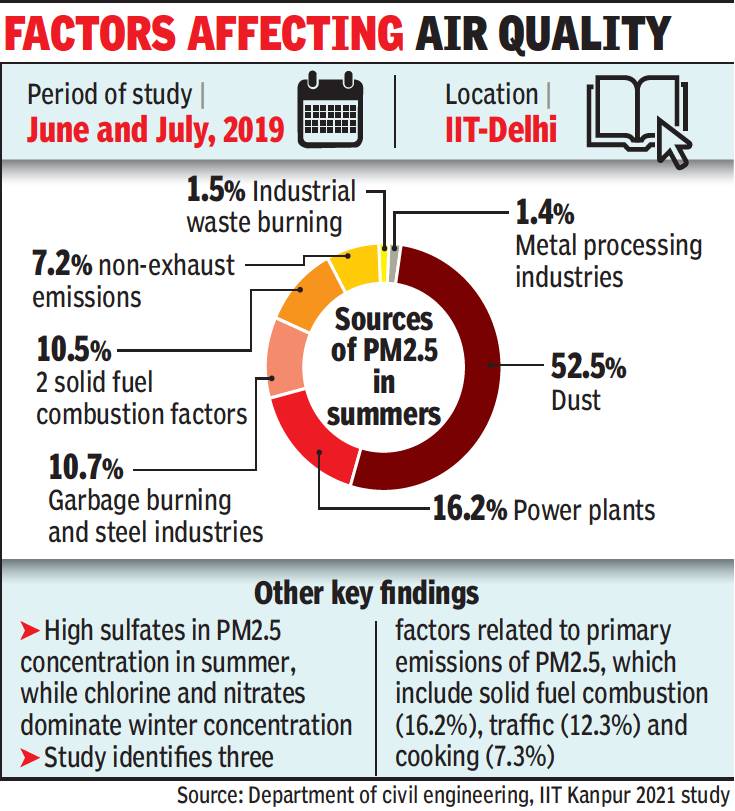
From: Jasjeev Gandhiok, July 6, 2021: The Times of India
After dust (52.5%), power plants are the biggest contributor to Delhi’s PM 2.5 concentration during summers, a new study led by the department of civil engineering at IIT Kanpur has found. Among organic aerosols found in the city’s air during the summers, solid fuel combustion has emerged as the biggest contributor (16.2%), followed by traffic (12.3%) and cooking (7.3%), it reveals.
Sachchida N Tripathi, head of the civil engineering department at IIT Kanpur, who carried out the study, said realtime source apportionment was done in June and July of 2019 to focus on the variation in summer pollution as compared to winter pollution. Concentration of sulfates and organic aerosols increases considerably during the summers as compared to high chlorine and nitrate composition in the winters, he added. “After dust, power plants were found to be the second biggest contributor. While dust is a known factor in the summers, high sulphur in the air, which reacts with the heat to release sulfates, was found to be a key component too,” said Tripathi.
“Through this study, one can tell which is the biggest contributor in terms of pollution and action can then be directed towards that problem.”
A technology was set up at IIT Delhi for the study in which IIT Jodhpur, Physical Research Laboratory at Ahmedabad, Laboratory of Atmospheric Chemistry, Switzerland and Central Pollution Control Board (CPCB) also took part.
Tripathi said the contribution to pollution from cooking came as a surprise. “Past studies have not been able to capture cooking as a source and that allows greater concentration in that regard,” the IIT Kanpur professor added.
The study also found a higher percentage composition of primary organic aerosols during the summer months. “The difference between the percentage composition of primary organic aerosols (traffic, biomass burning and cooking) and secondary organic aerosols was 28.4% as compared to only 4% in winter indicating the dominance of secondary sources in summer,” it stated.
Tripathi says the real-time source apportionment has helped them identify the change in the sources of industrial waste burning and solid-fuel combustion in the region, which changes from southeast in winter to south-west in the summer months. “This is primarily due to the change in wind pattern and meteorological conditions. Due to this, power plants in the vicinity are playing a key role and bringing pollutants to Delhi,” he added.
The Delhi government had recently filed a petition in the Supreme Court seeking closure of the ten thermal power plants situated in the neighbouring states that have been using old/outdated polluting technology.
Vehicles from neighbouring areas add to Delhi pollution: CSE, 2016
The Times of India, June 4, 2016
Delhi has the distinction of having the highest vehicular population among the metros. However, the actual daily number of the roads is much higher than the figure of 88 lakh that is toted out as the number of cars in the capital.This is because there is a massive daily influx of passenger and commercial vehicles from other parts of the National Capital Region.
In fact, a new Centre for Science and Environment (CSE) survey has found that the number of vehicles entering Delhi daily is almost as many as those that are registered in the city every year. The video recorded survey showed an average of 3.7 lakh cars and 1.27 two-wheelers entering the city every day . If all 124 entry points to the capital were considered, the number could be as high as 5.65 lakh. CSE recalled that the Economic Survey of Delhi for 2014-15 had found 5.69 lakh vehicles were registe red in Delhi that year, of which cars and SUVs accounted for 1.65 lakh vehicles.
The study was conducted in June 2015 through 24-hour video recording of all categories of vehicles entering and exiting Delhi at nine entry points. These included Kundli border on NH1; Tikri border on NH10; Rajokri on NH8; Badarpur on NH2; Kalindi Kunj; two points at Ghazipur border on NH24; and two points at Shahdara border on NH-19.
The survey , released to mark the World Environment Day on June 5, said that the effort to reduce the number of trucks entering the city by imposing an environmental compensation charge seemed to have been negated by the large number of passenger vehicles coming to Delhi.
“Delhi's battle against pollution, congestion and energy guzzling can get more difficult if its own explosive motorisation gets further aggravated by the huge daily influx of vehicles from outside,“ said Anu mita Roychowdhury , executive director, CSE. “This new analysis reconfirms that ineffective public policy on public transport connectivity is increasing dependence on personal vehicles, leading to enormous pollution and ill-health in Delhi-NCR.“
She also pointed out that an equal number of vehicles went out of Delhi daily, contributing to pollution in the NCR towns as well.
Researchers found that of the approximately four lakh cars entering the city , 55% were cars, 11% SUVs and 27% were two-wheelers. The number of two-wheeler entering the city -around 1.65 lakh from all entry points -is 43% of all new two-wheelers registered in 2014-15.
CSE highlighted the fact that cars driving into Delhi had the highest per capita CO2 emissions at nearly 3,031 gramskm, followed by SUVs at 1,919 gmkm. The buses crossing the border had the smallest CO2 footprint at 539 gm km. “ Against this trend, how will Delhi-NCR participate in India's commitment of an intended national determined contribution of reducing energy intensity by 35% by 2030?“ wondered the green body .
The survey also found that the total number of diesel cars, taxis and SUVs entering Delhi are 2.5 times the total registration of diesel vehicles in the city in 2014-15. “Among all the fuels used in Delhi, diesel still remains the highest. To that is added the daily influx of diesel vehicles that are higher than the local fleet,“ CSE said in its statement.
Now wonder, the organisation said, lung cancer incidence in the city has increased by over 33.3 % since the middle of the last decade. It warned that growing motorisation and dieselisation were continuously adding to the toxic risk in Delhi where the National Cancer Registry Programme showed the highest increase in lung cancer risk among all metro cities.
Effects on health
2011/ increase in cancer and asthama
Air pollution back as big health threat in city
TIMES NEWS NETWORK
The Times of India, Sep 1, 2011
New Delhi: Ten years after the city’s public transport switched to CNG, air pollution has again become a major threat to public health in Delhi, say environmentalists. With 69 lakh vehicles plying on city roads, a growth of about 60 lakh in 20 years, experts say oxides of nitrogen (NOx) and particulate matter (PM) are now at critically high levels.
NOx and PM are known to cause cancer and asthma. Medical experts say signs of deteriorating health are already manifest. The Delhi cancer registry maintained by AIIMS shows a 2-3% rise in lung cancer cases every year.
Dr Vinod Raina, a cancer specialist at AIIMS says till some years ago, 14-15 lung cancer cases were reported for every 1 lakh cancer patients. “Of late, we have been getting about 13,000 new cases of cancer each year, of which 10% come in with lung cancer. And, 30% of lung cancer patients have nothing to do with smoking,” he said.
The Centre for Science and Environment says vehicular pollution has returned as a big threat in Delhi. “About 55% of Delhiites stay within a 500m distance from main roads where vehicular pollution is at an all-time high. After public transport was converted to CNG, pollution has become invisible but is still on the rise,” said Anumita Roychowdhury, associate director, CSE.
In the 1990s, when the issue of air pollution was first raised, only particulate matter was being monitored. Now there is also a red alert on NOx and PM. AIIMS has been tracking hospital admissions and has found that they have been rising in winter months when pollution levels rise,” Roychowdhury said.
2013-17: 17 lakh respiratory infections, 981 deaths
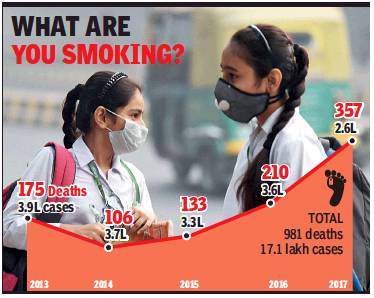
From: DurgeshNandan Jha, 17L respiratory infections, 981 deaths in 5 yrs in capital, August 8, 2018: The Times of India
Parl Report Highlights How Polluted Air Is Huge Risk Factor
The capital witnessed 981 deaths due to Acute Respiratory Infection (ARI) from 2013 to 2017. Over 17 lakh others were diagnosed with ARI, stated a standing committee report tabled in Parliament on Tuesday.
The report said the polluted air in Delhi-NCR is a significant risk factor for a number of pollution-related diseases and health conditions, including respiratory infections, and recommended immediate corrective and preventive strategic steps in consultation to mitigate the air pollution.
The committee, which held three meetings with authorities concerned and analysed the whole gamut of air pollution in Delhi-NCR in the past nine months, said it was surprised to note that the health ministry was not taken on board in the high-level task force on air pollution which is, in a way, indicative of ignorance as well as denial about negative impact of air pollution on human health. “The committee recommends that considering the severe health hazards of air pollution, ministry of environment, forest and climate change should take immediate corrective and preventive strategic steps in consultation with the health ministry,” the committee advised.
It has asked the health ministry to aggressively start an awareness campaign to educate people about the adverse health effects of air pollution, and the ways and means to minimise its adverse impacts.
In 2016, the World Health Organisation (WHO) put Delhi amongst the 20 most polluted cities in the world in terms of PM2.5 levels.
An epidemiological study conducted in 2008 on effects of air pollution on human health (adults) in Delhi, referred to by the parliamentary committee in its report, shows citizens of the city were more susceptible to respiratory symptoms compared with those living in rural areas.
The United Nations Children’s Fund (UNICEF) had said last year there is growing body of scientific research that shows that air pollution can permanently damage a child’s brain.
UNICEF also said that south Asia has the largest proportion of babies living in areas where air pollution is at least six times higher than international limits (10 micrograms per cubic metre). “Pollution is one of the biggest health hazards of our times. Apart from the government agencies, people need to realise this urgently too and take preventive measures,” Dr Arvind Kumar, centre for chest surgery at SGRH, said.
In a recent analysis conducted by him that involved 150 in-house patients suffering from lung cancer from March 2012 to June 2018, Dr Kumar found nearly half of the patients were non-smokers. While conventional wisdom states that smoking is its main cause, but now, there is strong evidence that points to the increasing role of air pollution in the rise of the cases, he said.
Calling polluted air in Delhi a significant risk factor for a number of pollution-related diseases and health conditions, the parliamentary committee on Tuesday said infants, children and asthmatic patients were most vulnerable to it.
2018: 218 Deaths Every Year
March 23, 2021: The Times of India
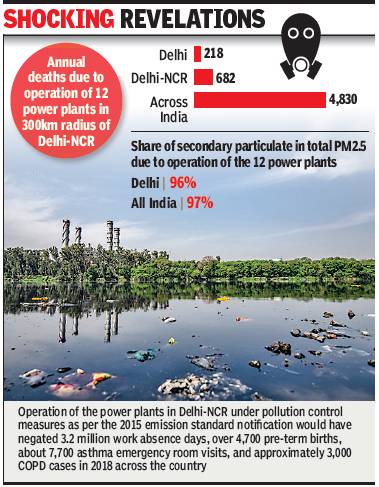
From: March 23, 2021: The Times of India
A report by Centre for Research on Energy and Clean Air (CREA) estimated that the emissions from 12 power plants in 300-km radius of Delhi-NCR has resulted in 218 deaths in Delhi and 682 in districts of Delhi-NCR annually.
The report, “health and economic impacts of unabated coal power generation in Delhi-NCR”, which was released during a webinar on Monday, estimated 4,830 annual deaths nationally due to the emissions from these 12 power plants. “The analysis was done considering the emissions of different pollutants from these plants, meteorological factors, dispersion and exposure of particulate matter to a graded population,” said Sunil Dahiya, analyst, CREA.
According to the CREA report, if the power plants would have followed the 2015 emission standard notification, they would have negated 3.2 million work absence days, over 4,700 preterm births, about 7,700 asthma emergency room visits, and approximately 3,000 COPD cases in 2018 across the country.
“Delays in installing sulphur dioxide (SO2) and nitrogen dioxide (NOx) control facilities are leading to over 13 deaths and Rs 19 crore cost burden daily in the country, which could be reduced by 63%, if all the power plants install pollution-control devices and operate at same plant load factor (measure of the output of power plant against its overall operating capacity) as they operated in 2018,” stated the report.
The assessment of the emissions showed that coal-fired power plants operational within 300-km of Delhi-NCR in 2018 led to a cost burden of nearly Rs 6,700 crore to the population in the country, and of these, Delhi faced the burden of Rs 292 crore. The study also revealed that during 2018, over 2,110kg mercury was emitted into the atmosphere by the 12 operational coal fired power plants in and around the national capital.
CREA’s research highlighted that the health and economic impacts of coal-based power generation in Delhi-NCR were not limited to the region, but to many states. “Precursor gases, such as SO2 and NOx emitted by the power plants go on to form secondary particulate pollution, which can then travel hundreds of kilometers, exposing populations far from the point of origin to incremental hazardous pollution levels. Our study shows that this contribution was as high as 96% for Delhi-NCR from operation of 12 thermal power plants. It is important to reduce the emissions of SO2 & NOx if we want to control air pollution,” said Dahiya.
The Extent of the problem
An overview
Understanding air pollution in Delhi in 5 steps/ 2017
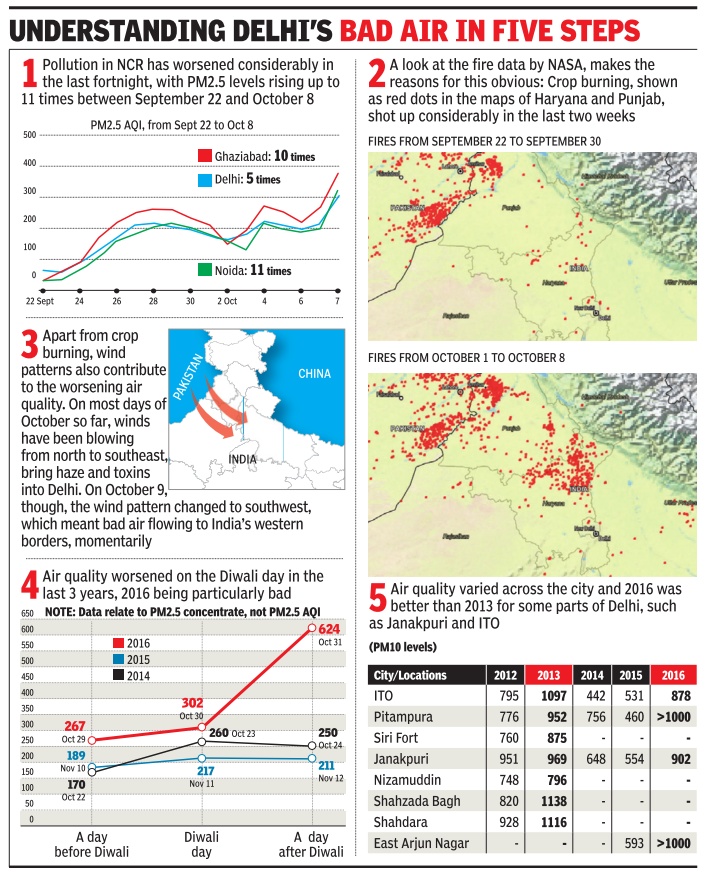
From October 10, 2017: The Times of India
See graphic, Understanding air pollution in Delhi in 5 steps
Delhi: air and noise pollution
2016
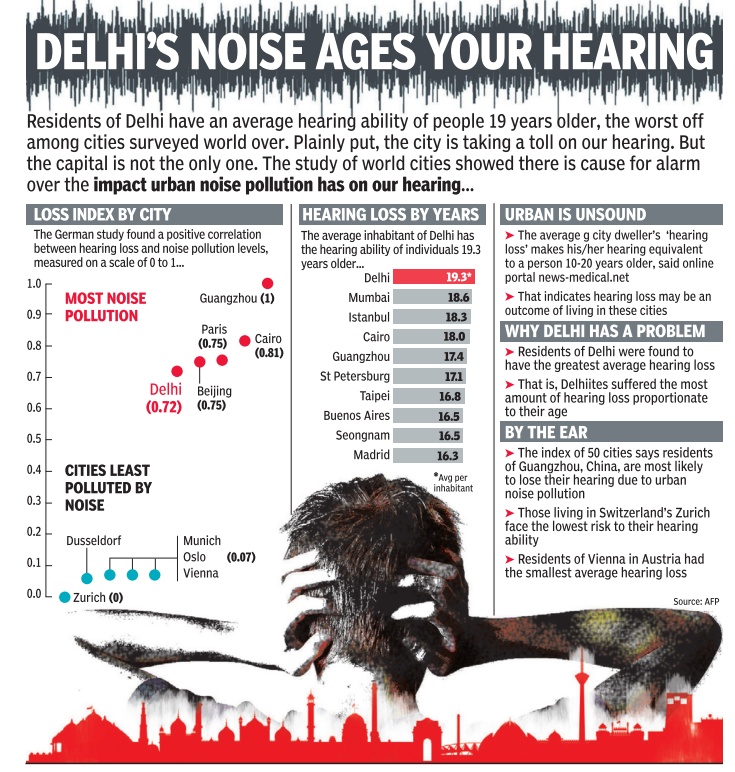
See graphic :
Delhi, air and noise pollution
Area-wise
1998-2014
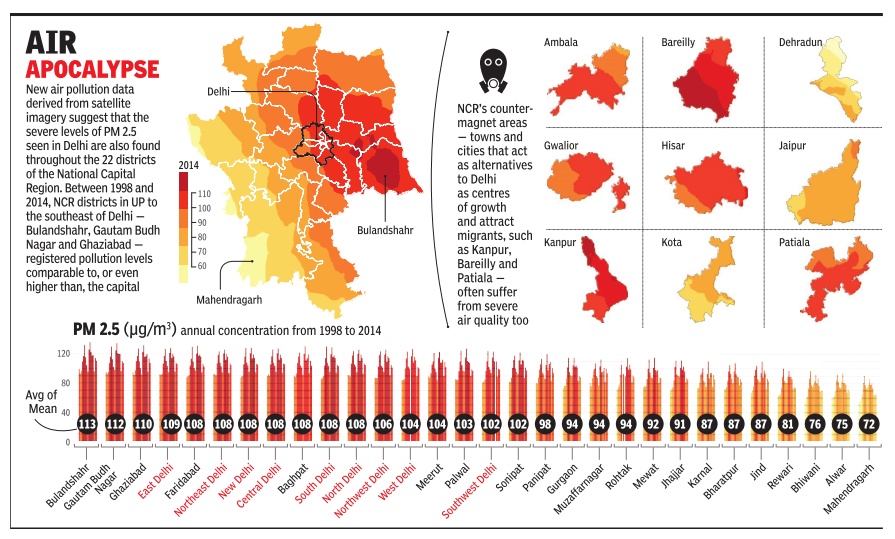
See graphic Levels of air pollution in Delhi, region-wise, 1998-2014
The least, worst affected parts of Delhi; other Metro cities/ 2018
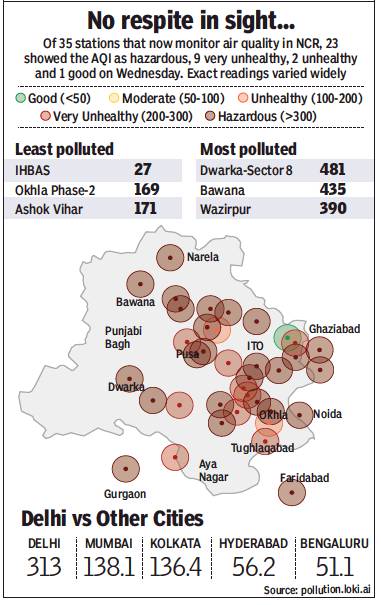
The position in India’s other Metro cities/ 2018
From: Delhi cites NASA photos, slams NCR states for stubble burning, October 18, 2018: The Times of India
See graphic:
Crop stubble burning: The least and worst affected parts of Delhi
The position in India’s other Metro cities/ 2018
Location-wise
Ambient Air Pollution (AAP) database
2014
Delhi has the worst air pollution in the world: WHO PTI | May 7, 2014
NEW DELHI: Delhi is the most polluted city in the world when it comes to air quality, according to a WHO study released today.
The 2014 version of the Ambient Air Pollution (AAP) database contains results of outdoor air pollution monitoring from almost 1600 cities in 91 countries.
India's national capital has the highest concentration of PM2.5 — particulate matters less than 2.5 microns— form of air pollution, which is considered most serious.
This form of concentration consists of tiny particles that put people at additional risk of respiratory diseases and other health problems, the World Health Organization said.
The situation is so bad in Delhi that its air has PM2.5 concentrations of 153 micrograms and PM10 concentrations of 286 micrograms — much more than the permissible limits.
In comparison, Beijing, which was once considered one of the most polluted cities, has PM2.5 concentration of 56 micrograms and PM10 concentration of 121 micro grammes.
Air quality is represented by annual mean concentration of fine particulate matter (PM10 and PM2.5, particles smaller than 10 or 2.5 microns).
The database covers the period from 2008 to 2013, with the majority of values for the years 2011 and 2012.
"Many factors contribute to this increase, including reliance on fossil fuels such as coal fired power plants, dependence on private transport motor vehicles, inefficient use of energy in buildings, and the use of biomass for cooking and heating," WHO said.
Limitations of WHO’s data
2016>2017
Without 2017 data, WHO pollution report doesn’t give clear picture, May 3, 2018: The Times of India
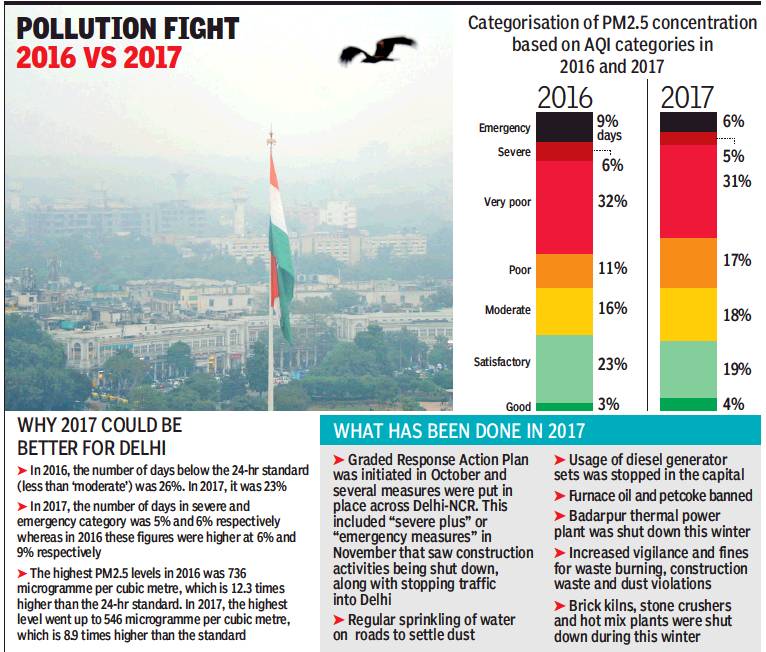
From: Without 2017 data, WHO pollution report doesn’t give clear picture, May 3, 2018: The Times of India
Several Measures, Including Graded Response Plan, Initiated in 2017
While Delhi’s air quality, according to the latest WHO database for 2016, is at its worst, pollution bodies and the environment ministry say it’s not a true reflection of the current reality because several measures and actions were taken in 2017, including implantation of the Graded Response Action Plan.
According to WHO’s database for 2016, Delhi was ranked at sixth position in the list. The average PM 2.5 levels were, however, recorded at 143 micrograms per cubic metre — the worst since 2010, when Delhi was ranked as the most polluted city in the world with an average concentration of 141 micrograms per cubic metre.
According to the Union environment ministry, the data for 2017 has shown an improvement since 2016 and 2018 so far has also fared better than 2016 — indicating cleaner air due to the efforts that were made in 2017.
“CPCB data based on Continuous Ambient Air Quality Monitoring Stations (CAAQMS) indicates that the annual average PM 2.5 concentration in 2016 was 134 micrograms per cubic metre and 125 micrograms per cubic metre in 2017. Similarly, for PM 10, the figures were 289 micrograms per cubic metre in 2016 and 268 micrograms per cubic metre in 2017. Therefore, even PM 10 levels came down in 2017 against 2016,” the ministry said in a statement on Wednesday.
According to the environment ministry, significant action was taken in Delhi-NCR in the past year, which included the formulation and implementation of Graded Response Action Plan, banning of pet-coke as fuel, strict surveillance of coal-fired plants, augmentation of air quality monitoring stations and formulation of a comprehensive action plan by the ministry of environment, which is further likely to bring an improvement in 2018.
Dipankar Saha, the former head of CPCB’s air laboratory, said that improvements took place in 2017 despite adverse meteorological conditions in that year. “The meteorological conditions, especially during winter in 2017, were much worse when compared with 2016. The air quality, however, showed an improvement due to strict implementation of GRAP and other measures on the ground,” Saha added.
CPCB officials said that AQI data for 2017 already showed improvements as compared with 2016, which is evident due to the work that has been put in. “There were more number of good, satisfactory and moderate days in 2017 than in 2016. The number of severe days also came down in 2017,” an official said.
Anumita Roy Chowdhury of CSE feels that while groundwork has been done in 2017, the focus needs to shift from one city to the national situation. “Urgent intervention is needed for implementing the National Clean Air Action Plan with a strong compliance strategy to meet clean air standards in all cities. It requires hard action,” said Chowdhury.
Homes: inside them
2018
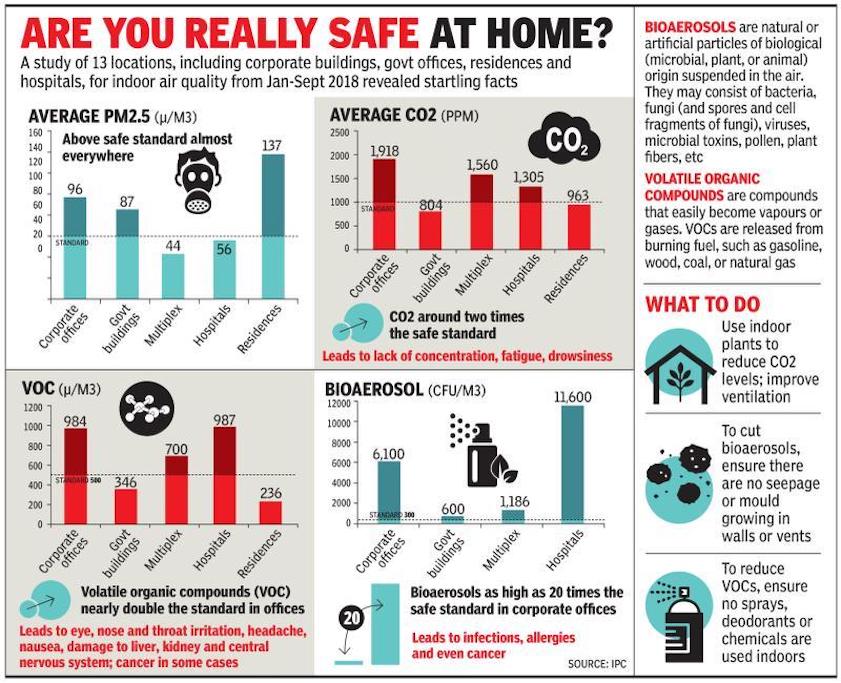
From: Jasjeev Gandhiok, Home truth: Delhi air is probably as bad inside, November 5, 2018: The Times of India
As Delhi’s air quality deteriorates by the day, you may be using masks to avoid inhaling the toxic air during your commute. Once you enter your workplace, the mask probably comes off, and you feel safer in the air-conditioned ambience. But are you truly breathing in safer air? Perhaps not. A recent study of 13 buildings in Delhi carried out by the Indian Pollution Control Association (IPCA) determined that while the levels of PM2.5, the microscopic, breathable particulate pollutants, was regulated, the air contained volatile organic compounds, bioaerosols and carbon dioxide beyond safe limits.
The study, conducted between January and September, found the use of devices like air purifiers helped contain PM2.5 pollution indoors, but harmful gases and compounds were largely ignored. The highest average PM2.5 level was recorded at 137 micrograms per cubic metre, over two times the safe standard, but relatively lower than the air outside. Multiplexes and hospitals had the lowest PM2.5 contamination, partly owing to the use of air purifiers.
Track the pollution level in your city
The study, however, cautioned that bioaerosols — particles of biological nature consisting of bacteria, fungi, viruses, microbial toxins, pollen and plant fibres — present indoors was a huge concern. While their presence in government buildings was discovered to be twice the safe level, they were, at 6,100 cfu/m3, over 20 times beyond acceptable limits in corporate offices. Similarly, high levels of volatile organic compounds were found in both residential and corporate complexes.
“People focus mostly on PM2.5 pollutants when VOCs and bioaerosols can be equally dangerous,” noted Priyanka Kulshrestha, head, research and communication, IPCA. “VOCs frequently contain carcinogens like benzene, while exposure to high bioaerosol levels can cause diseases, allergies, even cancer.”
The study also recorded high CO2 levels, almost twice the safe standard in corporate offices. This can affect concentration and lead to lower efficiency by increasing drowsiness and fatigue.
Kulshrestha recommended the introduction of indoor air purifying plants and proper ventilation to help improve indoor air quality. “Windows in an office should be opened at regular intervals to bring down the concentration of VOCs or gases and to lower CO2 levels,” she said. “To prevent bioaerosols, mouldy walls and vents need to be cleaned regularly. VOCs can be controlled with the use of chemicals and sprays.”
Home truth: Air is probably as bad inside
However, Arun Sharma, professor at the University College of Medical Science, suggested a balance in these basic measures. “If you keep the windows open for too long, the PM 2.5 level could become extremely high. Improving ventilation should not mean windows and vents stay open a too long time,” said Sharma.
Experts said the symptoms of problems caused by indoor pollutants include irritation in the skin, eyes or body and often coughing and wheezing. A high CO2 level makes one feel tired and sleepy.
Public places: Delhi
2014?
Jayashree Nandi, Dec 11 2014
The air in which one breathes through the day may be far worse than what the government's pollution monitoring. Because we often spend long hours near emission sources--on footpaths, along heavily congested roads, in an auto rickshaw in peak traffic and even in parks during morning walks.
To assess what our real exposure may be like, TOI, in association with Centre for Science and Environment (CSE), spent a day monitoring hourly PM 2.5 (fine, respirable particles) on CSE's portable air quality monitoring device in front of schools, hospitals, shopping areas and traffic cop booths.
The idea was to understand what kind of air pollution levels children on their way to schools or patients outside hospitals may be exposed to. The hourly PM 2.5 averages logged at these locations were compared with the ambient air quality monitored by Delhi Pollution Control Committee (DPCC)'s monitoring stations near the locations.
The results were very disturbing -outside Mother's International School on Aurobindo Marg, for instance, the average for 8 am to 9 am was 718 micrograms per cubic metre! While there is no official safe standard for an hourly average, the 24-hour average for PM 2.5 in India is about 60 micrograms per cubic metre. The machine-TSI DustTrak DRX Aerosol Monitor 8533 showed peaks up to 800 micrograms per cubic metre, about 13 times the daily standard. During the same period, DPCC's RK Puram monitoring station recorded an hourly average of just 325 micrograms per cubic metre.
Inside All India Institute of Medical Science (AIIMS) campus, between 9.10 am and 10.10 am, the hourly average was 493 micrograms per cubic metre. Considering that patients with low immunity go to the hospital, they may be exposing themselves to more complications in such conditions.
As it got warmer and sunnier, PM 2.5 concentrations started plunging. At RK Puram, in front of Delhi Public School, the hourly average was 248 micrograms per cubic metre and later at Saket, in front of a shopping mall, the concentration was about 178 micrograms per cubic metre.
The exercise of monitoring exposure levels through the day also revealed the diurnal variation in pollution levels with air quality improving considerably in the afternoon (1 pm to 4 pm), especially if it is sunny and warm. The air quality started declining once again after 4.30 pm. This exercise also revealed that areas with a smooth but less vehicular traffic can have relatively much better air quality . In front of Dr Ram Manohar Lohia Hospital, for instance, traffic flowed smoothly . Here, the PM 2.5 concentrations ranged between 100 and 180 micrograms per cubic metre, far lower than other locations.
Government pollution monitoring agencies have claimed that such exposure monitoring may be “unscientific“ as such devices are mainly meant for “industrial“ projects and that there is no official standard for hourly readings. “Both pieces of information are valuable. The legal standard is indeed based on daily average concentrations measured at a fixed location. As our research demonstrates, air pollution levels in Delhi vary substantially with time and place, depending on where one is. In many locales, like in traffic, particulate matter levels are much higher than what official monitors indicate,“ said Joshua Apte of Lawrence Berkeley National Laboratory , who has done similar research in Delhi.
PM levels
2009-17
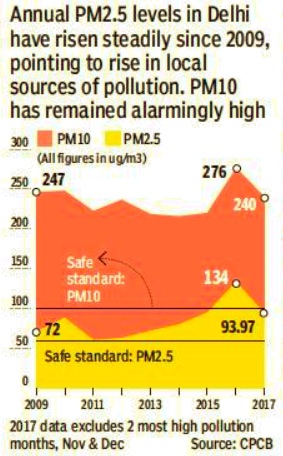
From November 14, 2017: The Times of India
See graphic, PM10 and PM2.5 levels, 2009-17
2015?
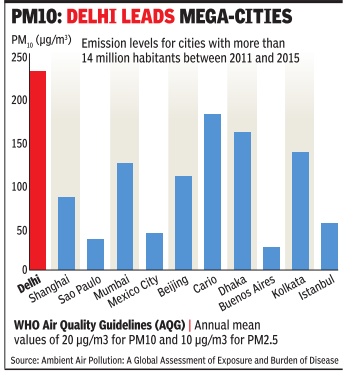
The Times of India
See graphic PM10 emission levels in Delhi, Mumbai, Dhaka, Kolkata
PM2.5, PM10 trends show failure to control local emissions
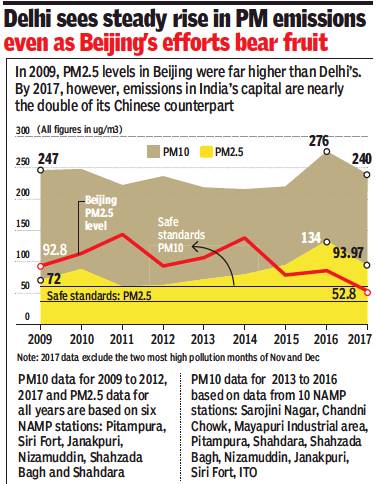
From: November 14, 2017: The Times of India
See graphic:, 2009-17, PM emissions decrease in Beijing but increase in Delhi
The pollutants
High levels of oxides of nitrogen (Nox) and particulate matter (PM)
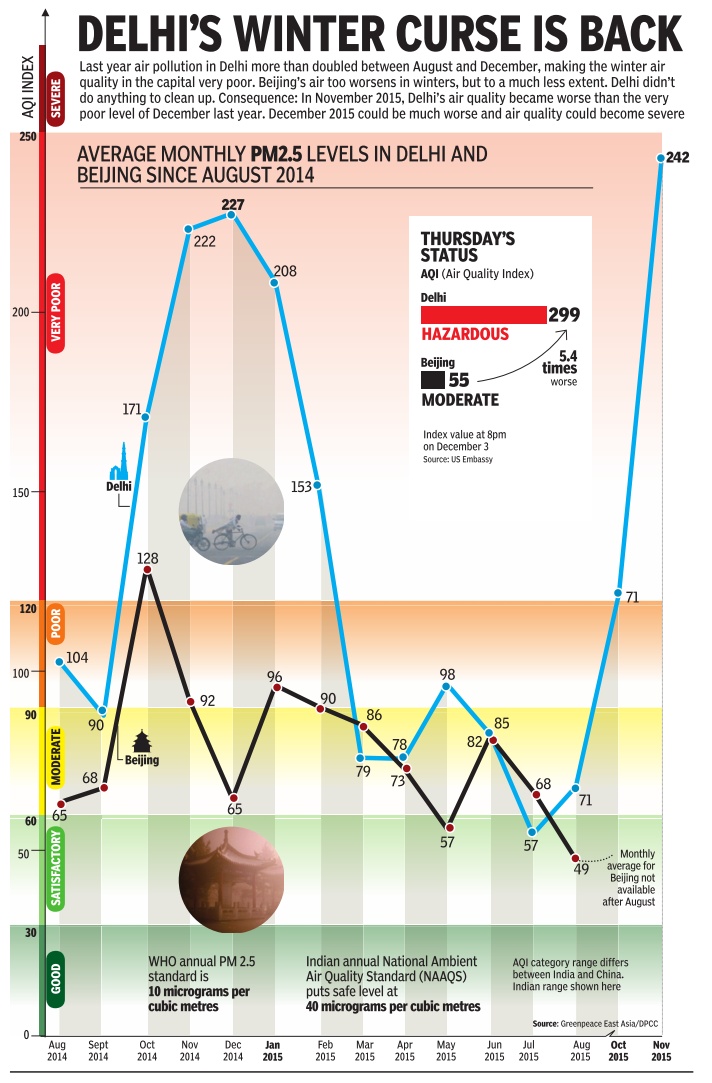
The Times of India, Sep 1, 2011
Air pollution back as big health threat in city
Air pollution has again become a major threat to public health in Delhi, say environmentalists. With 69 lakh vehicles plying on city roads, a growth of about 60 lakh in 20 years, experts say oxides of nitrogen (NOx) and particulate matter (PM) are now at critically high levels.
NOx and PM are known to cause cancer and asthma. Medical experts say signs of deteriorating health are already manifest. The Delhi cancer registry maintained by AIIMS shows a 2-3% rise in lung cancer cases every year.
Dr Vinod Raina, a cancer specialist at AIIMS says till some years ago, 14-15 lung cancer cases were reported for every 1 lakh cancer patients. “Of late, we have been getting about 13,000 new cases of cancer each year, of which 10% come in with lung cancer. And, 30% of lung cancer patients have nothing to do with smoking,” he said.
The Centre for Science and Environment says vehicular pollution has returned as a big threat in Delhi. “About 55% of Delhiites stay within a 500m distance from main roads where vehicular pollution is at an all-time high. After public transport was converted to CNG, pollution has become invisible but is still on the rise,” said Anumita Roychowdhury, associate director, CSE.
“In the 1990s, when the issue of air pollution was first raised, only particulate matter was being monitored. Now there is also a red alert on NOx and PM. AIIMS has been tracking hospital admissions and has found that they have been rising in winter months when pollution levels rise,” Roychowdhury said.
BREATH OF FOUL AIR
Delhi cancer registry at AIIMS shows 2-3% rise in lung cancer cases every year. 30% of these patients don’t smoke 55% of Delhiites stay within 500m from main roads, where vehicular pollution is at all-time high Commuters travelling in AC vehicles suffer 35-55% less pollution as compared to those in autos Environmentalists say levels of NOx and particulate matter in Delhi’s air now a major threat to public health.
AC cars may keep you fit
Air pollution is posing serious health hazards for the people of the national capital.
Researchers from Berkeley University carried out a survey in Delhi between February and May 2010 to analyse the impact of pollution on those using public transport.
The study – Concentration of fine, ultrafine and black carbon particles in autorickshaws in New Delhi, India – published in Atmospheric Environment, says those travelling in autos and cars with windows rolled down are exposed to 1.5 times more PM 2.5 concentrations than the ambient air. Exposure to ultrafine particles are 8.5 times higher. Joshua Apte, who headed the research, said those travelling in air-conditioned vehicles suffered 35-55% less pollution as compared to those in autos.
Season-wise
Monsoons and Air pollution in Delhi
2014-18
Priyangi Agarwal, February 25, 2021: The Times of India
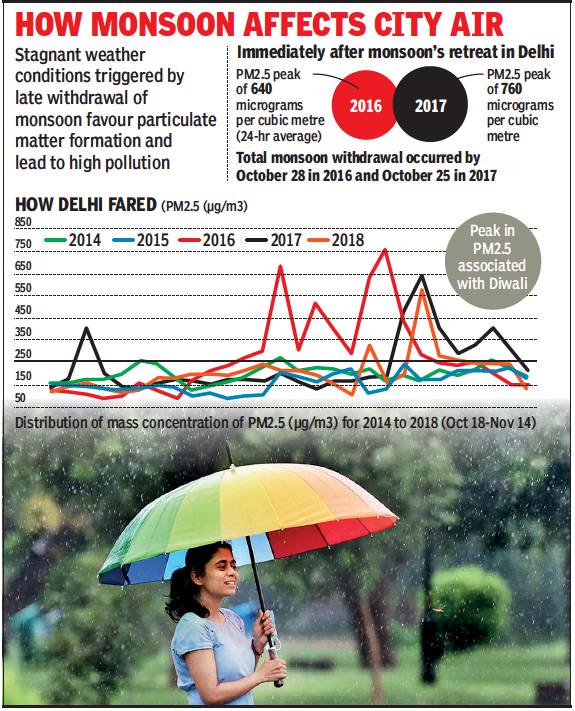
From: Priyangi Agarwal, February 25, 2021: The Times of India
A recent study by Indian Institute of Tropical Meteorology (IITM) has mentioned that stagnant weather conditions, including low wind speed, descending air and compressed boundary layer, triggered by the late withdrawal of monsoon, favoured particulate matter formation, thereby resulting in extreme levels of pollution.
The analysis of air pollution data of five years (2014-2018) revealed that 2016 and 2017, which were marked by a delayed withdrawal of monsoon, witnessed PM2.5 particles touching a peak level of 640 and 760 micrograms per cubic metre (24-hour average), respectively, on a single day immediately after the monsoon retreat. However, the years in which monsoon withdrawal was normal did not show such extreme levels of pollution.
After the daily 24-hour average of PM2.5 from October 18 to November 14 for five consecutive years (2014–2018) was analysed, it showed two unusual record-breaking prolonged extreme pollution events, one in 2016 (October 28 to November 12) and another in 2017 (November 6 to November 15).
During this period, PM2.5 levels surpassed 250 micrograms per cubic metre, considered “severe plus” level as per Indian standards. PM2.5 levels generally remain high during winter and such extended extremely elevated levels were not observed in other years.
“In 2017, the PM2.5 level touched a peak of 760 micrograms per cubic metre(24-hour average), surpassing World Health Organisation standards by 30 times and Indian national standards by 12 times, jeopardising the lives of citizens. Though the sources of high emissions were different in 2016 and 2017, the underlying mechanism that triggered the emergency episodes with longevity was related to the late withdrawal of monsoon-induced stagnation conditions,” said the study.
The study, which was done by Gufran Beig, Aditi Rathod, Suvarna Tikle, Sujit Maji and SB Sobhana from IITM, suggested that such unusual monsoon patterns spurred extreme pollution events. If monsoon withdrawal is normal, the associated anticyclone occurs at a higher altitude because the temperature is still warmer and it is unlikely to lead to a stagnation condition.
Monsoon withdrawal occurred by October 28 in 2016 and October 25 in 2017, which was considered late. In both these cases, winter had already set in and the temperature was cooler. These unusual conditions impacted the total circulation system and, hence, easterlies could not enter the Delhi region. The delayed monsoon withdrawal and associated anticyclonic circulation resulted in trapping externally generated pollutants ceaselessly under colder conditions, leading to historic air quality crisis in 2016 and 2017 in Delhi, the study stated.
The analysis, which was published in Journal of Environmental Sciences, concluded, “Stagnant weather conditions triggered by late withdrawal of monsoon favoured formation of particulate matter and made the situation extremely explosive, thereby causing an air quality crisis. The changing circulation patterns were likely one of many factors leading to stagnation conditions. It would be premature at this stage to link extreme pollution events with climate change as more data is needed through future work. Prolonged high pollution exposure leads to cause-specific morbidity and mortality.”
November’s air quality
2016, 2017
See graphic, Air quality, November 2016-2017
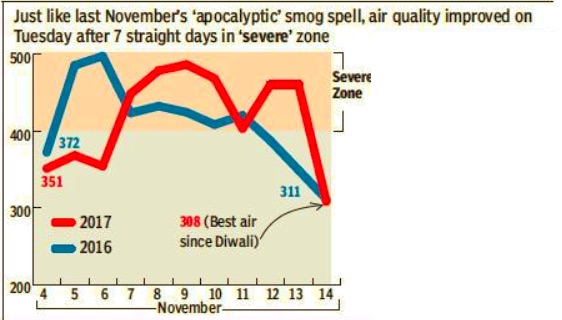
From Jasjeev Gandhiok, November 15, 2017: The Times of India
Oct- Feb, 2016> 2017
March 1, 2018: The Times of India
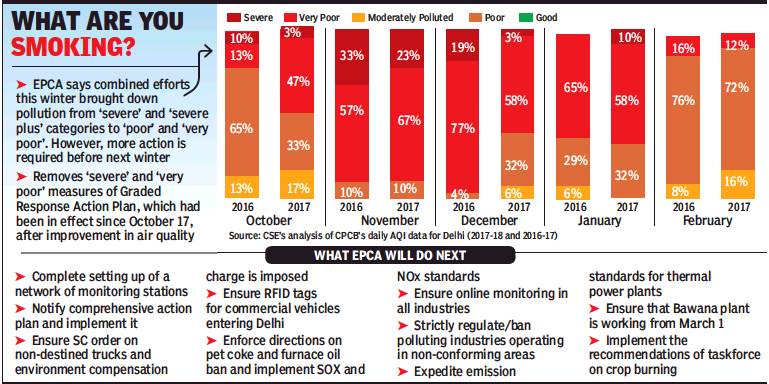
From: March 1, 2018: The Times of India
Air quality in the capital and surrounding regions has shown sign of improvements this winter — bettering from severe and severe plus categories to poor and very poor. However, there is still a long way to go to combat air pollution in the long term, states an assessment report released on Wednesday by Environment Pollution (Prevention and Control) Authority (EPCA).
The SC-appointed body also lifted the “severe” and “very poor” category measures falling under the Graded Response Action Plan (GRAP) citing improvement in air quality, which has largely remained between “moderate” and “poor” over the last few weeks. EPCA also lifted the ban on diesel generators in the capital and allowed opening of Badarpur thermal power plant. However, the plant will be shut down completely by July 31.
“The air in the NCR is so polluted and toxic that all our combined efforts have reduced pollution merely from the severe-severe plus categories to poor-very poor,” said EPCA member Sunita Narain. She added that air pollution at this level was still hazardous even for healthy people and much more efforts were required to bring it down to the good and moderate levels.
The data from October 1, 2017 to February 25, 2018 pointed towards a slight improvement in the air quality as compared to the same time last year. An analysis of Central Pollution Control Board’s air quality index data showed that the number of days in the severe category decreased for each month in comparison to the previous year, except in January. In February, 16% of the days were in the moderately poor category, compared to 8% in the previous year.
The data of PM2.5 from the four major monitoring stations — Mandir Marg, Punjabi Bagh, RK Puram and Anand Vihar — showed little impact with pollution levels remaining high. The levels at hotspot areas, particularly Anand Vihar, also showed no signs of improvement.
“We must not lose the momentum in our fight for clean air and forget the fact that right to breathe is fundamental,” said Bhure Lal, EPCA chairperson.
Vehicular pollution
2020: District-wise
Mohammad Ibrar, February 21, 2021: The Times of India
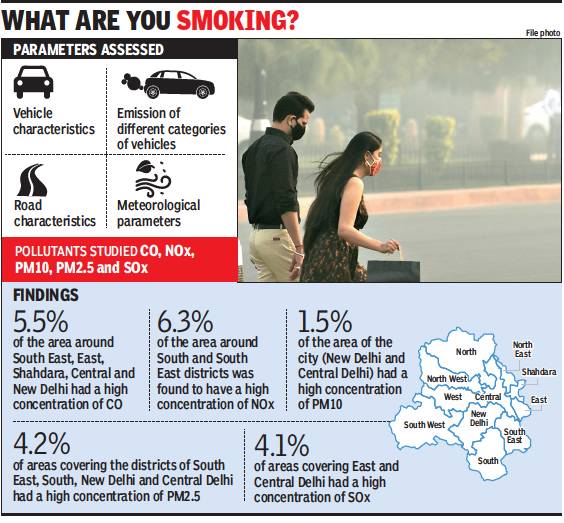
From: Mohammad Ibrar, February 21, 2021: The Times of India
A study on the ambient air quality assessed in 2020 that in terms of five pollutants —CO, NOx, PM10, PM2.5 and Sox — the air quality was ‘excessively poor’ in South-West, West, New Delhi, Central, North-East, East and South-East districts for three air pollutants (PM10, PM2.5 and NOx).
The study, published in the journal, Elsevier — Journal of Transport & Health, in 2020 was conducted by researchers from Delhi Technological University, Amity University, Haryana, and Indraprastha University.
In the study the researchers focused on understanding the influence of trafficinduced criteria air pollutants along 36 transport corridors in the capital’s 11 districts and assessed the associated health risks.
“We classified vehicular pollutants into five different distribution categories — low, moderately low, moderate, moderately high, and high,” said Rajeev Kumar Mishra, assistant professor, DTU. “The spatial distribution maps were developed using Geographic Information System covering 36 transport corridors. The study demonstrated the concentration of three of the five ambient air pollutants, namely NOx, PM10 and PM2.5.”
Mishra said the ambient air quality in South, Central, East and New Delhi districts were in the high and moderately high categories, and thus requiring adequate control measures.
The researchers used parameters like vehicle characteristics, emission factor, road characteristics and meteorological factors to estimate the emission and concentration of pollutants in the corridors. Co-researcher Amrit Kumar said, “We observed higher concentrations of carbon monoxide in districts like South-East, East, Shahdara, Central and New Delhi because these have regular trans-border fleets.”
Similarly, NOx was higher in South and South-East due to the mixed land-use pattern, characterised by commercial and residential areas and the highest traffic density among the districts. PM2.5 and PM10 levels were higher in Shahdara, South-East, South, New Delhi and Central districts.
The study also reported on expected cases of human exposure to respiratory mortality, cardiovascular mortality and total mortality due to pollution. “The high respiratory mortality and cardio-vascular mortality on the ISBT Flyover and Wazirabad Road, as well as Panchkuian Road, Janpath, Tilak Marg and Sansad Marg routes, we surmised, could be due to vehicular pollution,” said Mishra.
The researchers felt it was of paramount importance for policymakers to focus on the reports findings and bring in suitable remedial measures. “We have to also look at the local sources of pollution in Delhi. Traffic pollution and biomass burning also add to the pollution and need to be considered,” said Mishra.
YEAR-WISE DEVELOPMENTS
2016 vs. 2017: air quality
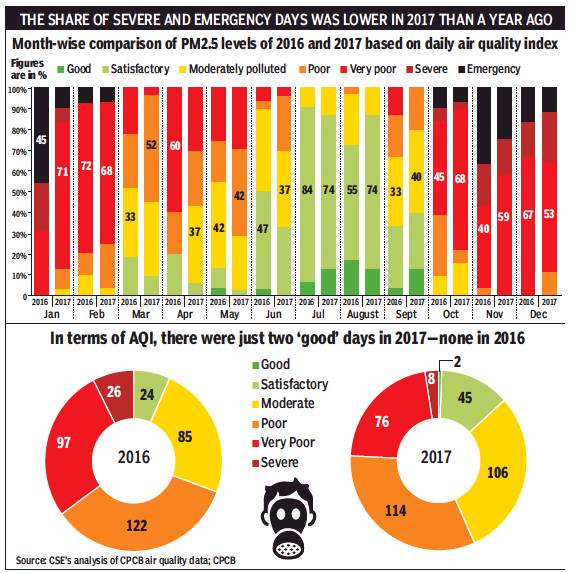
From: Jayashree Nandi, When just 2 ‘achhe din’ in a year are cause for cheer, January 3, 2018: The Times of India
In Terms Of AQI, 2016 Didn’t Have A Single Good Day: CPCB
Even though Delhi experienced a deadly smog episode spanning more than a week in November, a recent report by the Central Pollution Control Board indicated that the overall air quality might have improved in 2017 compared to 2016. In a note, “significant achievement 2017”, CPCB scientists listed steps that the pollution watchdog took last year and displayed monthwise air-quality data, indicating that while the number of “satisfactory” and “moderate” days increased in 2017, “very poor” and “severe” days came down.
The note also claimed that there was no high-level coordination in 2016, but, in 2017, there was a review of the situation by the PMO, secretary (Union environment ministry) and the chief secretary. To back this, CPCB noted that the number of continuous or real-time monitoring stations were increased from 18 to 38 in Delhi; another four were installed in Haryana, three in Uttar Pradesh and two in Rajasthan. It stated that there was now a 24X7 unified control room, which dealt with public grievances, forecast, remote-sensing data access, real-time data access and calculating a particulate matter-based AQI.
CPCB claimed that a 42-point action plan, which was developed in 2015 under the then environment minister, Prakash Javadekar, was implemented in 2017. At a review meeting in 2016, it was found that hardly any of the 42 points were implemented in 2016. Among other steps, CPCB listed formation of 40 air-quality monitoring teams, notification of construction and demolition waste norms, and a decision to leapfrog to BS-VI-compliant fuel in 2018 in the capital.
“Delhi is significantly impacted by meteorological factors. There is also intrusion of pollutants from the nearby areas.
The improvement we are seeing basically backs the fact that if we can control ground-level emissions, we will see some difference in air quality. In 2017, the onset of winter was late, but we still managed to see some improvement. Increasingly, the clear seasonal variations seen earlier are shifting and this also impacts air quality,” Dipankar Saha, head of CPCB’s air quality lab, said, adding that “multiple agencies had taken action to control air pollution in 2017 under the graded response action system”.
For the first time since May 2015 (when AQI mapping started), Delhi recorded two “good” air-quality days in 2017. Also, “very poor” days reduced from 97 in 2016 to 76 in 2017 and “severe” days came down from 26 to eight. “This basically shows that the duration, frequency and intensity of smog episodes will reduce if action is taken to control emissions. GRAP came into force last October, but some action was taken since January 2017 like the Badarpur power plant was shut for the entire winter and an environment compensation charge was imposed on trucks. Now, GRAP has ensured consistent action,” Anumita Roychowdhury, executive director, Centre for Science and Environment, said.
Last week, a top CPCB scientist had said that the agency might consider using advanced LiDAR (Light Detection and Ranging) devices to vertically monitor the air quality of NCR.
This year is likely to be even more eventful for those tracking how the capital fights air pollution because the oil ministry has promised to roll out BS-VI in Delhi in 2018.
“The moment you improve fuel quality, the emission control systems in the existing fleet will perform better, wear and tear will be less and PM emissions will be lower. But the maximum benefit will be felt when the automobile technology is advanced to support BS-VI fuel. SC has directed the environment ministry to notify the comprehensive action plan, which means long-term solutions will also be taken,” added Roychowdhury.
2013-17: Improvement in 2017
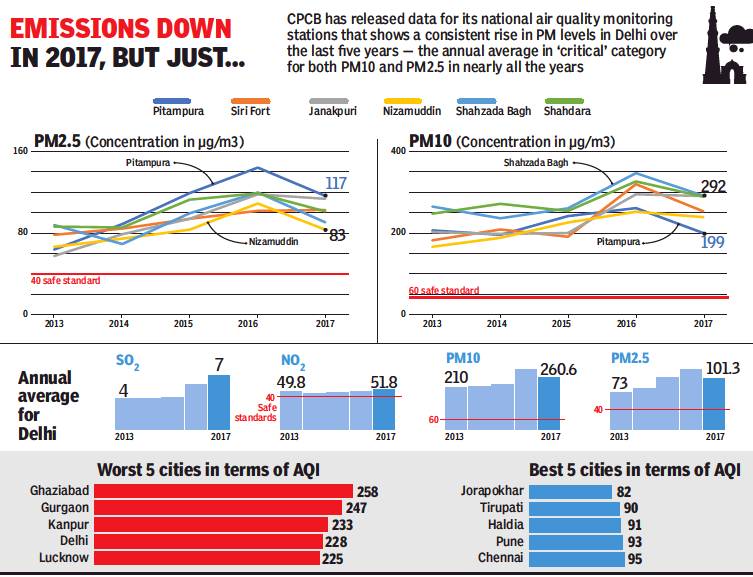
ii) PM10 (concentration in µg/m3),
iii) Annual average for Delhi, 2013-17
From: Jayashree Nandi, For first time in 5 yrs, PM levels fall in 2017 — but it’s too early to celebrate, January 10, 2018: The Times of India
Need To Build On Marginal Dip By Taking Proper Steps: Experts
If agencies can manage to sustain their efforts towards curbing emissions, 2017 may prove to be a milestone year for Delhi in terms of arresting the trend of rising particulate matter levels.
Data released by the Central Pollution Control Board for its national air quality monitoring (NAMP) stations in Delhi showed that there was a minor decline in PM levels last year — the first time since 2013.
This data corroborated CPCB’s recent claim that PM levels were lower in 2017 than 2016 and 2015 in CPCB’s network of automatic monitoring stations, which are different from those monitored under NAMP. The NAMP network consists of Pitampura, Siri Fort, Janakpuri, Nizamuddin, Shahzada Bagh and Shahdara. These locations are manually monitored and considered as primary reference by CPCB for policymaking and tracking long-term trends.
CPCB also conducts chemical speciation of pollutants at these locations. The data (being compiled since 2001) showed a consistent rise in PM levels in Delhi — the annual average was in “critical” category for both PM10 and PM2.5 in nearly all years. Data shared by CPCB also showed that annual average nickel levels in the air were in “critical” and “high” categories in 2009 and 2010, and intermittently in years after that.
On December 13, the SC directed the Union environment ministry to notify a comprehensive action plan within two weeks to mandate short-, medium- and long-term measures for all sources of pollution with deadlines. But the ministry has neither notified the plan nor held any meeting with the SC-mandated EPCA to finalise the timelines.
“If this improvement has to be sustained, then it important that the comprehensive action plan is notified and implemented immediately,” said Anumita Roychowdhury, executive director, CSE. The improvement in 2017 may be a combination of factors — both emergency action taken under the graded response action plan and SC’s orders, such as imposing an environmental compensation charge on trucks in 2016. But experts pointed out that the PM levels were still 2 to 3 times the safe standard.
An ex-CPCB chairman said: “I don’t think we should take this minor improvement very seriously as PM levels are still way higher than the standard. Maybe, we can recognise their efforts when PM pollution meets the standard. Even though CPCB claims that NAMP data is used to guide policy, there is a large variation in data monitored by them manually and data recorded by automatic monitoring stations. I have doubts about the quality of CPCB’s monitoring infrastructure.”
Dipankar Saha, head of CPCB’s air quality lab, said: “Meteorology plays a very important role in Delhi. I don’t think the improvement in air quality was because of meteorological factors; in fact, they were worse than in 2016. The improvement may be a result of coordinated action by various agencies.” He added: “There is a delay in notifying the comprehensive action plan as we need to hold meetings and consolidate various action plans into one.”
2016> 2018: Delhi-NCR’s air is cleaner
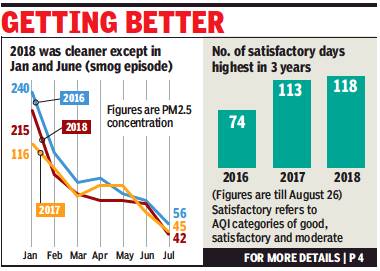
From: Jayashree Nandi, Delhi-NCR breathing cleaner air this year than in 2016 & 17, August 28, 2018: The Times of India
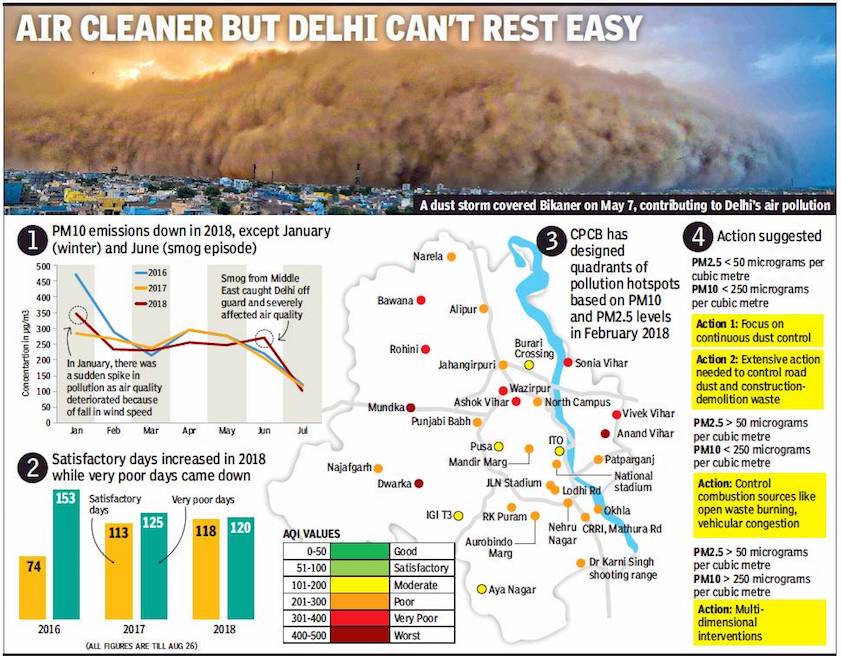
From: Jayashree Nandi, Delhi-NCR breathing cleaner air this year than in 2016 & 17, August 28, 2018: The Times of India
Focus Now On Ways to Curb Winter Pollution
The air quality in the National Capital Region has improved in 2018 compared with the last two years, Central Pollution Control Board (CPCB) said on Monday.
An improvement in PM2.5 and PM10 concentrations has been recorded this year except for two high pollution periods — in January and June.
The CPCB’s air quality index assessment during 2016-18 also suggests that the number of “satisfactory” air quality days has gone up, while there have been fewer “very poor” days this year.
Proper implementation of the graded response action plan, ban on pet coke and closure of the Badarpur power plant in winter may have led to the reduction in air pollution, CPCB officials claimed.
To sustain this improvement, CPCB plans to start action on tackling winter pollutants from September 15. Forty teams of CPCB officials will fan out across the city and report on emission sources to the Delhi government and central agencies.
Filters on roads, bus rooftops to clean air
CPCB Plans To Intensify Green Fight
The ministry of earth sciences is chipping in by developing an early warning system by October to prepare for pollution spikes. Forecast from Indian Meteorological Department is already being used.
Apart from directions to be issued to industries and brick kilns in NCR, a central package of Rs 1,100 crore for in situ crop residue management will ensure farmers can use machinery to mulch crop stubble through custom hiring centres, Prashant Gargava, CPCB’s member secretary, said.
CPCB visits to pollution hotspots, such as RK Puram, Anand Vihar and DTU may be intensified this year depending on pollution levels.
CPCB plans to utilise the Environment Protection Fund, which was created following a Supreme Court order in August 2016 when the court imposed a 1% pollution charge on sale of SUVs, to fund several pilot studies. Three of these pilots may be tested this year. Among them are WAYU air filters by National Environmental Engineering Research Institute which will be installed at five busy traffic intersections. These filters work like vacuum cleaners and also cause some turbulence to disperse pollutants. But they are effective only in a 20-30m radius and, so, CPCB will have to install as many as 57 such filters. WAYU filters were installed at traffic intersections in Mumbai earlier, but local reports suggest there was no discernible difference.
TOI had earlier sought responses from experts on investing in such technology to deal with ambient air pollution. Most scientists and experts were critical of the idea. They likened it to installing air conditioners to tackle global warming. Emissions, instead, should be tackled at source, they had said.
This time, CPCB also plans to utilise about Rs 20 lakh to install air filters on bus rooftops. When the bus moves, the air flows through the filters installed. Another pilot is to use certain chemicals that are dust suppressants at construction sites. According to CPCB officials, all these pilot projects have been approved by the department of science and technology after studying technical details for each project.
BS-VI vehicles: A strong opposition was mounted in the Supreme Court against a government proposal to allow car manufacturers a grace period to sell their BS-VI noncompliant vehicles in the country after April 1, 2020, with a lawyer saying the people were living in a “gas chamber” and even the foetus was getting affected by high pollution. The car makers, on the other hand, justified the grace period to sell their vehicles contending that India was leapfrogging from the BS IV emission norms to BS VI within a short span of time.
The arguments on the issue of air pollution in the Delhi-National Capital Region saw the lawyer, who is the amicus curiae assisting the court, also saying that the government cannot allow the citizens to die due to a health emergency.
As in 2018
Jasjeev Gandhiok, June 6, 2020: The Times of India
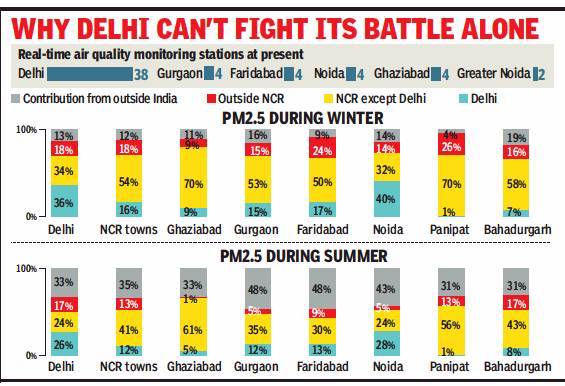
From: Jasjeev Gandhiok, June 6, 2020: The Times of India
The National Capital Region (NCR) consists of some of the most polluted cities in the world with Delhi often stealing the limelight, especially during winters when PM2.5 and PM10 levels cross 10 times the Indian safe standards.
The Graded Response Action Plan (GRAP) rolled out by Environment Pollution (Prevention and Control) Authority (EPCA) every winter to tackle pollution applies to the entire NCR. However, most plans have largely centered around Delhi, despite data showing that Noida, Gurgaon, Faridabad and Ghaziabad are potentially more polluting. The air quality monitoring stations across the capital are also far more than other more polluting regions.
Coal-based power plants at Rajghat and Badarpur have been shut, while industries have switched to cleaner fuel. Diesel vehicles, too, cannot be registered in the capital. In comparison, the neighbouring areas still have 11 coal-based power plants within a 300km radius of Delhi.
Experts believe that without considering NCR as an airshed and ensuring regional cooperation, Delhi and cities like Gurgaon, Noida, Ghaziabad and Faridabad cannot show improvement alone.
A Teri source-apportionment study in 2018 found that Delhi only contributed 36% to its own pollution in winters, with 34% coming from NCR and the remaining 30% from outside. This holds similar for other NCR cities, which often receive transboundary pollution.
Anumita Roy Chowdhury, executive director, research and advocacy, Centre for Science and Environment, said, while Delhi has cleaned up its act, the NCR needs to follow suit, however, this won’t be possible if states act individually. “Delhi has implemented the clean fuel policy and coal has been phased out. CNG and petrol are being given a push, alongside PNG for industries. However, this is not the case with NCR. A large number of polluting industries are still functioning across the neighbouring states, which means air quality cannot improve in Delhi if the surroundings are polluted,” Roy Chowdhury said.
Aarti Khosla, director, Climate Trends, an NGO, said an airshed approach has worked abroad and was needed across the Indo-Gangetic plains. “Tackling it state-wise has its limitations, especially in a region where pollution is widespread,” she added.
Tanushree Ganguly, programme associate, Council on Energy, Environment and Water, said, coal-based power plants alone account for a large chunk of pollution in NCR. “Our assessment of the existing emission inventories for Delhi finds that the contribution from power plants alone ranges from 3-11% and all the 11 coal-fired plants in NCR are situated outside Delhi,” she said.
The studies suggest that across the country the contribution of sources outside the city boundary could range from 15-50%. “While Delhi’s clean air action plan includes multiple measures that call for coordination between states, no interstate coordination mechanism has been established. Hence, to meet the democratic demand for clean air in Delhi-NCR, government-led regional coordination is must,” said Ganguly.
Ashish Jain, founder director, Indian Pollution Control Association, an NGO, said that pollutants see no boundaries, which make it a problem for the entire region and not the state alone. “They travel under the impact of various atmospheric conditions, so each state cannot have its own strategy or policy and interstate cooperation is crucial,” he added.
Most polluted areas in NCR
The worst spots
2017, 2018
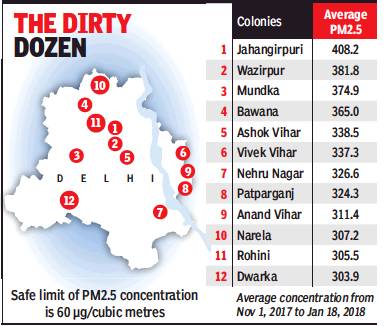
From: Jayashree Nandi, 12 areas in city where you can never breathe clean air , January 28, 2018: The Times of India
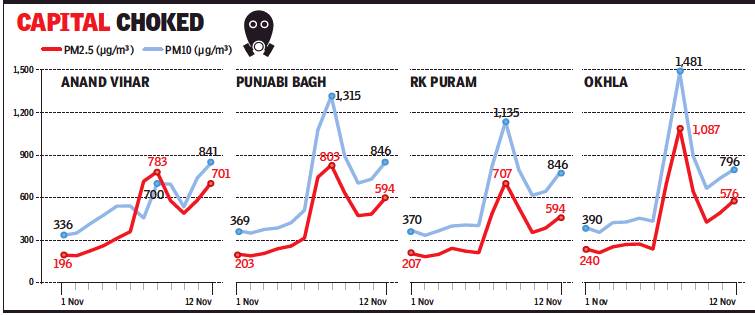
From: Jayashree Nandi, 12 areas in city where you can never breathe clean air , January 28, 2018: The Times of India
See graphics:
Air pollution in Delhi- The twelve worst spots
Diurnal variations in Air pollution in Delhi
Need For More Localised Pollution Plan
Even when the winter sky appears blue, parts of Delhi now have smog-like air quality. If you live in an industrial or peripheral area like Jahangirpuri or Anand Vihar, you are breathing heavily polluted air every day.
Last year, Delhi Pollution Control Committee (DPCC) added many new air quality monitors, so that now there is one every 7-8km.
Data from this dense network shows not only a very high level of pollution but also a sharp increase in pollutants that were earlier within the limit.
For instance, nitrogen dioxide (NO2) is usually present in a higher-than-acceptable concentration in many of the new locations being monitored.
NO2 is a respiratory irritant that also contributes to ozone pollution, particulate formation, and smog.
Winter levels of NO2 have been above 100 micrograms per cubic metre at eight locations, as compared to the 24-hour standard of 80 micrograms per cubic metre. These locations are different from those with the highest levels of PM 2.5 (fine, respirable pollution particles). DPCC scientists said vehicles might be adding to NO2 pollution.
Data worrying, but govts still lax
Without the new monitoring stations, Delhi would appear to have better air quality this year as some of the earlier stations — RK Puram, Mandir Marg, Punjabi Bagh — within the city’s core are faring better, even if their levels of PM 2.5 and PM 10 (coarse pollution particles) are at least thrice the safe standard.
However, at 12 locations the monitors showed PM 2.5 concentrations more than five times the 24-hour safe standard. These areas — Jahangirpuri, Wazirpur, Mundka, Bawana, Ashok Vihar, Vivek Vihar, Nehru Nagar, Patparganj, Anand Vihar, Narela, Rohini and Dwarka — are either industrial or semi-industrial clusters, or lie on the city’s periphery. PM 10 levels were also found to be five times the 24-hour standard at nine of the 12 locations.
“We know that Jahangirpuri, Wazirpur, Vivek Vihar and Narela may be affected by emissions from industrial activity. Bawana and some other stations may be affected by open waste burning. But it’s difficult to say right away,” said Mohan P George, head of DPCC’s air quality division.
The data is worrying, but neither the Delhi government nor the Centre has made localised plans to deal with emissions. Last year, Environment Pollution Control Authority (EPCA), which was set up by Supreme Court, ordered the Delhi government to commission a survey of illegal industries located in residential and non-conforming areas. A lawyer who represents DPCC told TOI there are between 70,000 and 1 lakh such industries in Delhi.
DPCC is in a bind because issuing show-cause notices to these industries under the Air and Water Act will amount to recognising them. So the government is considering other ways to regulate them.
Besides NO2, Benzene has become a significant pollutant at Mundka, Jawahar Lal Nehru Stadium and Anand Vihar. On some days its concentration is 2-5 times the safe standard. Benzene is a component of crude oil and petrol that can be harmful even at trace levels. Apart from vehicle exhaust, evaporation from petrol filling stations can raise benzene levels. But most petrol pumps now have vapour recovery systems installed.
“NO2 is high in all high traffic areas and in some with industrial emissions. Benzene, on the other hand, is an air toxin. It should be removed from the environment and we need a different approach for it,” said Anumita Roy Chowdhury, executive director, Centre for Science and Environment (CSE), adding that localised monitoring is helping them target local sources of pollution.
Sahibabad
It comes as no surprise that Sahibabad has been identified as one of the five most polluted areas in the National Capital Region by the Supreme Court-appointed Environment Pollution (Prevention and Control) Authority . This is because out of 356 air polluting industries in the city, around 200 are in Sahibabad alone.
“We have identified 356 air polluting industries in Ghaziabad, with more than half being in the Sahibabad area,“ said Ajay Sharma, regional officer of the Uttar Pradesh Pollution Control Board (UPPCB).
“We have also identified 21 industries in the city that run on pet coke and nine that uses furnace oil, the use of which has been banned by the Supreme Court. We have started issuing notices to these industries and by November 1, we will ensure they are sealed if they do not switch to other energy sources,“ he added.
EPCA chairman Bhure Lal -who visited Sahibabad on Tuesday -has identified a number of sources contributing to air pollution in the area and sought immediate remedial measures.
An official who accompanied Bhure Lal told TOI, “In Maharajpur area, construction debris was dumped in the open and the EPCA chair man told us to clear it. He spotted a number of places where waste burning was rampant and asked us to enforce the National Green Tribunal (NGT) ban.“
The district pollution board said it was taking these steps. “Between October 12 and 18, we fined and sealed 12 polluting industries while action was taken against four builders for dumping construction waste flouting NGT norms,“ said Sharma.
“In addition, we have recommended to the UPPCB for closure of the Carbon Continental factory near Crossings Republik along NH-24 after it was found to be flouting pollution norms,“ he added.
Ghaziabad has been listed by the Central Pollution Control Board as one of the biggest polluters, with PM10 hovering over 400 micrograms per cubic metre, four times above the safe level, for the past few days.
Sapna Srivastava, scientific officer at the state pollution board, said a more analytical approach “is the need of the hour to really understand the problem“.
Referring to a survey do ne by IIT-Kanpur last year for the Delhi region on various sources of pollution, Srivastava said, “According to the report, road dust accounts for 38% of pollution in Delhi, followed by vehicular pollution, which comes to around 20%, which I think holds true for Ghaziabad as well to a large extent.“
“Now if road dust has been identified as the primary source of pollution, we along with the civic and development agencies should come up with a comprehensive plan to tackle this issue,“ she added.
The pollutants
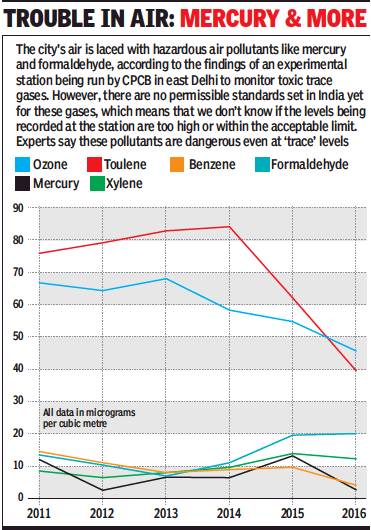
From: Jayashree Nandi, ...But particulate matter isn’t your only worry, February 5, 2018: The Times of India
An experimental station being run by the Central Pollution Control Board to monitor some toxic trace gases shows the capital’s air doesn’t just have very high particulate matter levels, but is also laced with hazardous air pollutants, such as mercury and formaldehyde. But it’s too early to say if the levels being recorded at this experimental station are too high, simply because there are no standards in India for these air toxics yet. Experts, however, say they are dangerous even at “trace” levels.
CPCB had set up a continuous air quality monitoring station based on Differential Optical absorption Spectroscopy (DOAS) at Parivesh Bhawan, East Arjun Nagar. It released data from the station from 2011 to 2016.
The station monitors sulphur dioxide (SO2), ozone (O3), nitric oxide (NO), nitrogen dioxide (NO2), formaldehyde (FOR), benzene (BEN), toluene (TOL), p-Xylene(pXy) and mercury (Hg), most of which are categorised as air toxics in the US and in Europe. These are mainly gases, particles or aerosols present in the air at levels where they pose a hazard to human health and they include volatile organic compounds (VOCs), polycyclic aromatic hydrocarbons (PAHs), heavy metals and aldehydes.
CPCB started monitoring them on an experimental basis to study whether the same technology can be used to monitor emissions at critically polluted areas like industrial clusters, thermal power plants or around, say, pesticide manufacturing units. Among the air toxins monitored here, there are safe standards set for both benzene and ozone—while O3 levels met the annual standard, the standard for benzene was breached in all years except 2016.
Unlike the US environment protection agency (EPA), India doesn’t have an air toxics programme. According to US EPA, these pollutants are known or suspected to cause cancer or other serious health effects, such as reproductive effects or birth defects, or adverse environmental effects which is why EPA monitors 187 such air toxics. They regulate air toxics from large industrial facilities as well as smaller sources.
On what could be the source for mercury or toluene being recorded by the CPCB station, Dipankar Saha, former head of CPCB air lab, said: “This is an experimental station. Scientists are still trying to understand and validate the data. The only reason this station was set up was because we wanted to see if the technology can be used for critically polluted areas without any difficulty.”
CPCB has, however, not started monitoring these hazardous air pollutants on a large scale despite their serious health implications. “We have been saying that India needs a separate air toxics programme because these are pollutants, which will have to be eliminated from air, they are carcinogens. The monitoring should be done in a more widespread manner on a long-term basis,” said Anumita Roychowdhury, executive director at the Centre for Science and Environment.
Area-wise break-up of pollutants
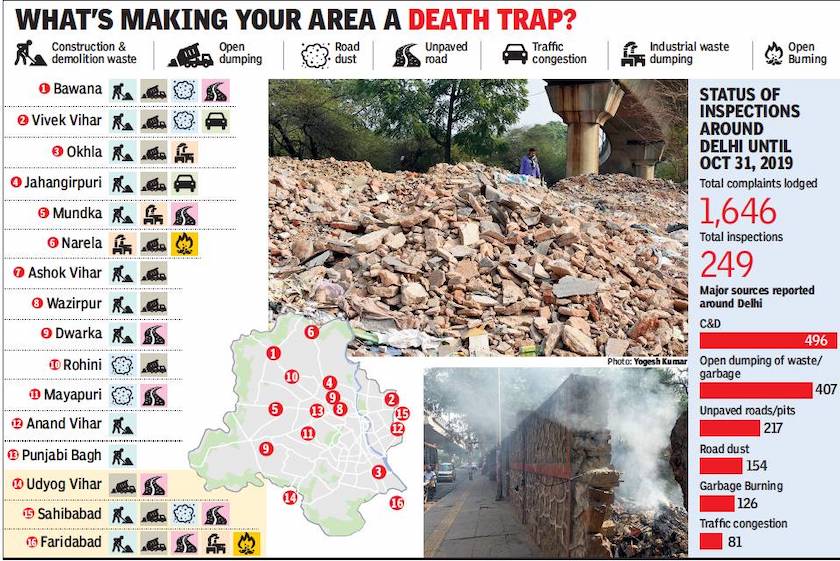
From: Ritam Halder & Jasjeev Gandhiok, Nov 8, 2019: The Times of India
See graphic:
An Area-wise break-up of pollutants in Delhi, presumably as in 2019
Ozone/ 2019
Jasjeev Gandhiok, June 20, 2019: The Times of India
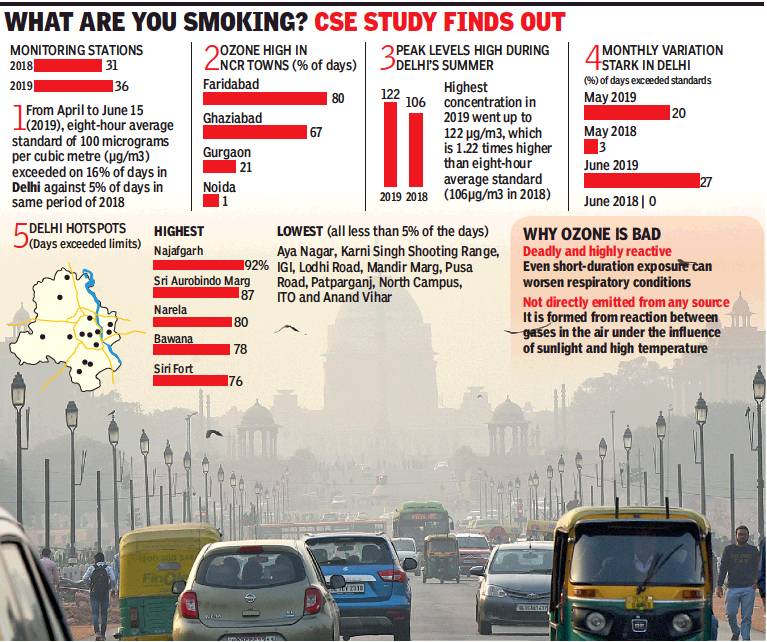
From: Jasjeev Gandhiok, June 20, 2019: The Times of India
This summer, the capital witnessed higher ozone pollution compared with the same period last year, shows a new analysis by Centre for Science and Environment (CSE).
With a strong heatwave affecting Delhi, searing temperatures have seen the average ozone levels exceeding the prescribed standards on 16% of the days between April 1 and June 15, 2019, against just 5% in 2018. The eighthour average standard for ozone exposure is 100 micrograms per cubic metre. In several residential and industrial locations, the number of days crossing the limit was extremely high — 53% to 92% of the days. The analysis highlights that among the key NCR towns, Faridabad experienced the highest share of such days at 80%, followed by Ghaziabad at 67% and Gurgaon at 21%. Noida shows much less impact with only 1% of the days breaching the limit.
In Delhi, the average count was 16% of the days, though high ozone levels were noticed in many prominent residential areas — Siri Fort (76% of the days), Sri Aurobindo Marg (87%), RK Puram (53%), JLN Stadium (71%), Dwarka Sector 8 (68%) and Rohini (63%). In the industrial and institutional areas, the situation was equally bad with Najafgarh at 92% of the days, Narela at 80%, Bawana at 78% and Jahangirpuri at 67%. The average could have been worse if some locations did not have low levels, with some crossing the safe mark in less than 5% of the days.
“This is a matter of serious concern as ozone is a highly reactive and can have immediate adverse effect on those suffering from asthma and respiratory conditions,” said Anumita Roychowdhury, CSE executive director (research and advocacy).
“There is a special reason for tracking ozone during summer,” she said, adding that ozone is not directly emitted from any source, and other gases such as nitrogen oxide and volatile organic compounds emitted from combustion sources like vehicles, industries or power plants react in the air under the influence of sunlight and temperature to form ozone.
“Summer months, with high sunshine and high ambient temperatures, increase our vulnerability to ozone impacts. The intense heatwave experienced this summer may have influenced this trend in the region, already suffering from severe air pollution,” Roychowdhury explained.
Air Quality Index (AQI), which CPCB releases every day, too, shows a disturbing trend with ozone — along with particulate matters — being the dominant pollutant of the day on 28 days between April 1 and June 5. During the same period in 2018, the count was only 17 days.
Roychowdhury said if this trend continued and worsened, Graded Response Action Plan (GRAP) would also have to initiate action to address the precursor gases forming ozone — NOx, hydrocarbons etc — and crack down on vehicles and industries.
Ozone is a highly reactive gas that merits a short-duration standard of only one-toeight hours’ average, as opposed to a 24-hour average for other pollutants.
Odd-Even scheme
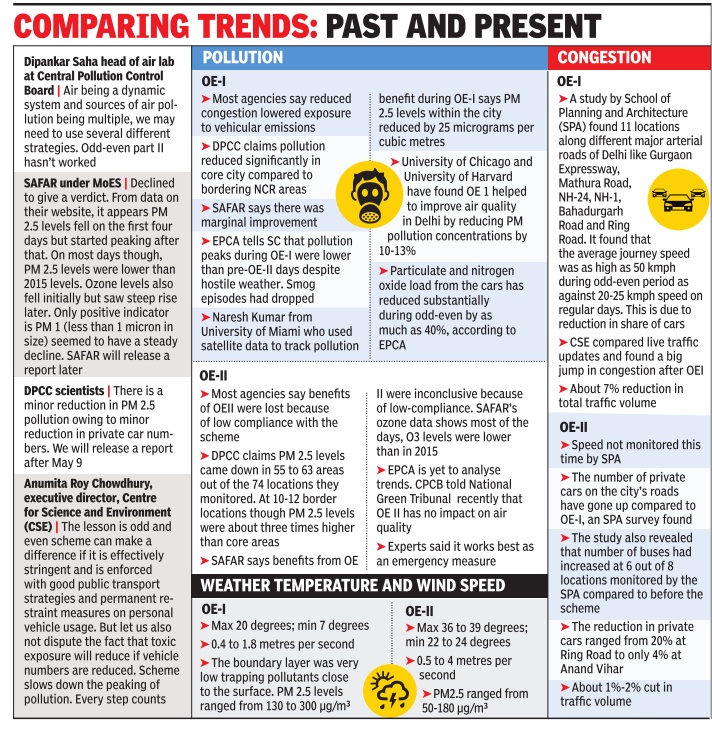
Phase I: 2016
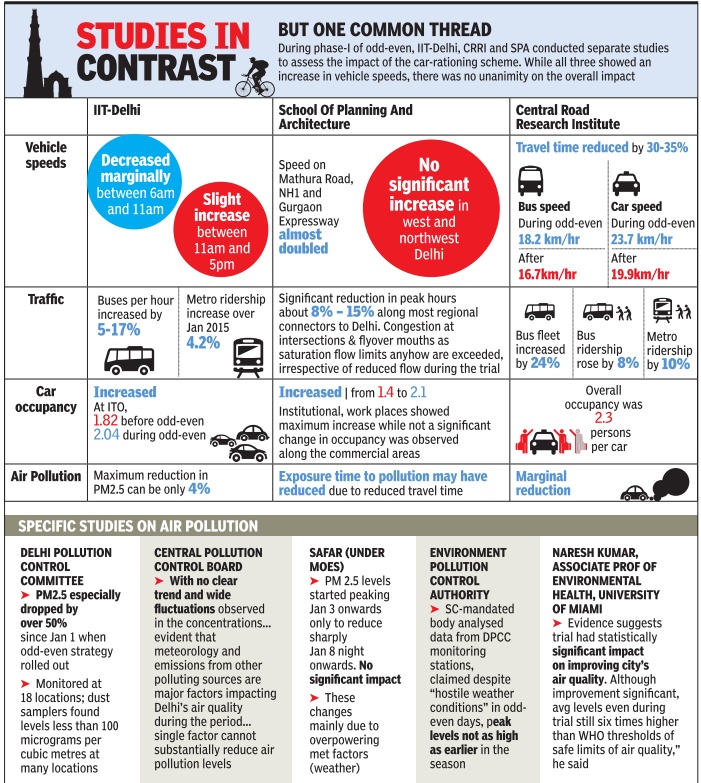
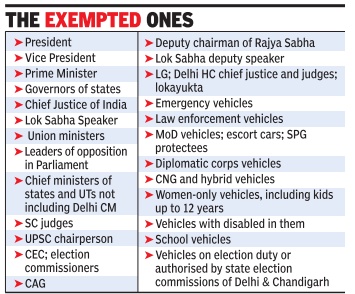
Impact on traffic
The Times of India, April 7, 2016
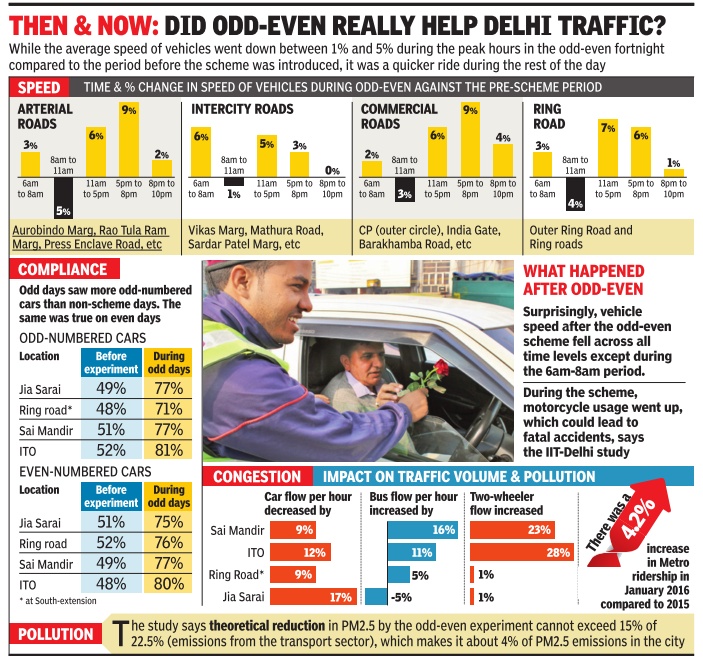
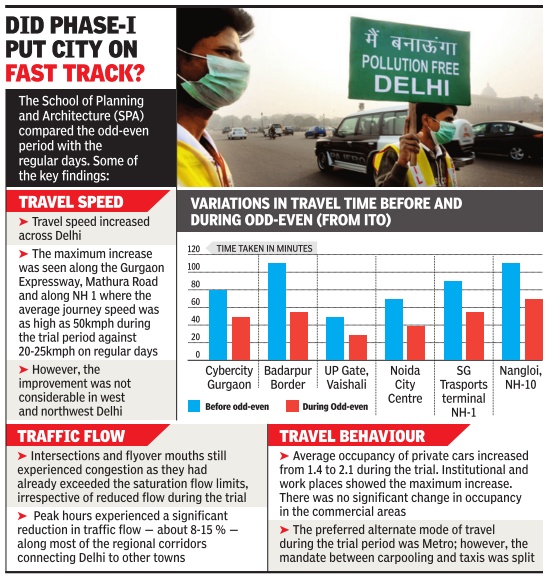
Odd-even was of little use, says IIT study
A study by IIT Delhi reveals that vehicle speeds had increased 11am onwards during the first phase of the odd-even scheme. The maximum increase recorded was 9%. However, the average speed of vehicles reduced marginally between 6am and 11am at some locations when the road-rationing exercise was undertaken from January 1and 15. The study , “Evaluation of the effects of the 15-day oddeven scheme in Delhi: A preliminary report“, by researchers at Transportation Research and Injury Prevention Programme (TRIPP), IIT-D, also found a high compliance with the odd-even rule at four locations that were observed.
This apart, car-flow rates per hour on different roads decreased by 7-9%. There was almost a similar increase in the number of buses and autorickshaws and a significant rise in the number of two-wheelers during the fortnight, the study says. The air pollution benefits were not apparent because of meteorological factors and the authors of the study felt that data from six stations under the Delhi Pollution Control Committee (DPCC) was not enough to analyse the benefits of the intervention.
According to the study , car occupancy increased at all locations except one. The speed data was extracted by the team using google maps distance matrix API. It provides real-time travel distance and time between a pair of locations.
Despite an overall increase in the speed of vehicles during the period, Dinesh Mohan, a former IIT professor and the lead author of the study, suggested there were no reasons why the scheme should be continued. “Since there is no improvement in air pollution and the impact on congestion is so little and in fact, it al so increased at times, there is no reason to continue it other than gaining international publicity ,“ he said.
He added that motorcycle use had gone up during the odd-even period, which could lead to fatal accidents. On why the vehicle speeds had reduced in the morning hours, Mohan said people might have started early to avoid the rule that came into force from 8am onwards. The lower speeds co uld also be linked to higher number of buses, autos and two-wheelers, Mohan said.
A recent study by School of Planning and Architecture (SPA) found that the vehicle speeds at most locations had increased from 15 to 26kmph.It further said that the improvement in speed was higher during the non-peak hours and that morning peak traffic volume reduced by 8-16%. It had indicated that people's ex posure to air pollution had reduced during the period.
But the IIT study said that “it is possible that the decrease in emissions from cars may be offset by an increase in flow of other vehicles,“ adding that combined PM 2.5 emissions from buses, autos and two-wheelers was estimated to be 20% of the entire the transport sector compared to cars that alone contribute 16% of emissions. While studies by SPA and Central Road Research Institute (CRRI) as well as an evaluation by the SC-appointed Environment Pollution Control Authority (EPCA) have found reduced congestion and pollution exposure during the oddeven scheme, Mohan said such studies needed “technical, rigorous analysis“ and his team had “videographed everything“ because it's very easy to get cheated otherwise.
Phase II: 2016
Impact on traffic
The Times of India, May 13 2016
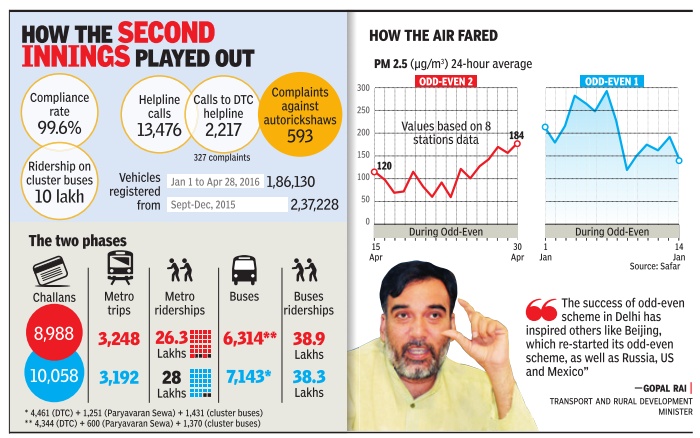
Rumu Banerjee
After the Delhi government's own report claimed that the second phase of the odd-even was successful, but marred due to schools being open, a report by the Central Road Research Institute (CRRI) suggests that even the impact on traffic was minuscle.
The report, which is based on a study carried out by the CRRI under Dr Staish Chandra, the director, during the odd-even fortnight, found a stark difference between the impact of the first odd-even fortnight and the second one, in April.
The study , which was conducted to measure the impact of the odd-even policy on traffic volume and speed characteristics on the road network, mapped two arterial roads of the city--Inner and Outer Ring Road--and compared the impact of the two phases.
Dr Kayitha Ravinder of CRRI said, “There is a significant difference in the impact on traffic volume and speed le vels of the two odd-even pha ses. While the scheme in Ja nuary had huge impact on the speed--it went up by 47% --the scheme in April saw the speed reduced to 23% on the Inner Ring Road and 14% on the Outer Ring Road.“ The le vels are measured against the traffic volume and speed cha racteristics of normal days.
It's not just speed levels which didn't show a signifi cant change. According to the study , which was carried out on April 28 and 29, the impact was felt on the traffic volume as well. “In phase II, the total traffic reduction was only around 10-12%. The reduction in car traffic was only 15%,“ said Dr Ravinder, who conducted the study . In contrast, the traffic volume reduced to 20% during the first phase, with the percentage of cars on road reduced to 30%. “This measure may give results in the short run but not in the long run,“ he added.
Impact on sale of petrol and diesel
The Times of India, Jun 03 2016
Ambika Pandit
The tall claims of the government on the success of the oddeven scheme notwithstanding, data from oil companies show that the second phase of the plan didn't lead to a considerable decline in the sale of petrol and diesel in the capital.
The sale of petrol, in fact, rose from 1,16,315 kilolitres in March to 1,19,593 kilolitres in April. The dip in the sale of diesel, on the other hand, wasn't much either. Data from oil companies -IOCL, BPCL and HPCL -show that the sale of diesel was almost static at 1,35,110 in April. The figure for March was 1,35,340 kilolitres.
It was the searing heat, coupled with lack of adequate public transport options, which probably led to a higher number of people using private vehicles during odd-even 2.
The AAP government had showcased data from the first phase of the oddeven scheme to highlight its success, as the sale of both petrol and diesel had shown a visible decline during that period.
In fact, value-added tax (VAT) collections from the sale of petrol and die sel were lower by Rs 40 crore in January than December 2015.
However, April had quite a different tale to tell. It's likely that compliance to the vehicular restrictions was better in January because of the cold weather. Schools being closed for vacations also played an important part in a lower number of vehicles being on the roads.
IOCL, BPCL and HPCL together sold 1,52,272 KL of diesel in December. The sales declined to 1,39,411 KL in January but again rose to 14,5374 KL in February . They sold 1,14,538 KL of petrol in December, 1,05,525 KL in January and 1,07,542 KL in February.
The Aam Aadmi Party government notified a hike on VAT on petrol and diesel on January 19, four days after the first phase of odd-even ended. The rate was hiked from 25% to 27% for petrol and from 16.6% to 18% for diesel.
The government said it had rationalised VAT on the two fuels on the basis of a decision taken at a meeting of finance ministers of northern states for bringing uniformity in tax rates.
Pitfalls: NCR can't handle odd- even
Odd-even may choke mobility in NCR, Jan 20, 2017: The Times of India
Gurgaon, Noida and Gha ziabad will all have to implement the odd-even formula for private vehicles whenever it's rolled out next after the Supreme Court-appointed Environment Pollution Control Authority (EPCA) notified a graded response action plan for a pan-NCR implementation.
Odd-even will kick in if PM2.5 level crosses the “severe“ mark of 300 micrograms per cubic metre (gm3) or PM10 level crosses 500gm3, and persists for 48 hours.
The two previous instances of such a scheme being implemented were both by the Delhi government in 2016, with mixed results.
Neither the Haryana State Pollution Control Board (HSPCB) nor residents feel implementing an odd-even scheme in the city is a good idea. HSPCB officials have expressed that other measures, such as phasing out of diesel autos, could be more significant. “Phasing out of diesel autos or their regular monitoring would be more beneficial, as these are the primary source of air pollution in the city,“ said a HSPCB official.
Residents too seemed unsu re about the scheme's implementation. “Odd-even in Delhi made many people switch to car-pools or other means of transport. But I don't think it's possible in Gurgaon as the city has no public transport,“ said Sector 55 resident Satyendra Bajaj, who travels from his office in Cyber City to Sector 55.
His fears are borne out by the numbers. There are over 7 lakhs cars that travel on Gurgaon's roads every day , though only around 3.2 lakh (including 32,772 CNG cars) are registered in the city . To implement odd-even, authorities will have to make extensive arrangements of manpower and enforcement, as well as public transport. If one is to take a half of the 3.2 lakh cars out of the equation, it saddles the public transport system with at least 1.6 lakh extra passengers, if one person per car is factored in. The real number could well be double or more.
Around 1.5 lakh people travel on DMRC's yellow line between Samaypur Badli (Delhi) and Huda City Centre (Gurgaon). This will multiply manifold when the scheme is implemented. And it will have a cascading effect elsewhere. With only 34,000 autos, 500 bike taxis, 400 e-rickshaws and 62 city buses to cater to people who will be without a car on the odd-even days, chaos will spill over from Metro stations to bus and auto stops.
Garima Bhateja, who lives on Sohna Road and drives to her MG Road office, says: “Rapid Metro doesn't even cover 4km. City buses are rarely seen on roads, leaving us with only autos and taxis as options, both of which are costly and prone to over-charging. Thus, oddeven is not possible here.“
IIT studied hourly PM data in 2016, 2015
Jayashree Nandi, Night traffic smoked out odd-even gains, Mar 28, 2017: The Times of India
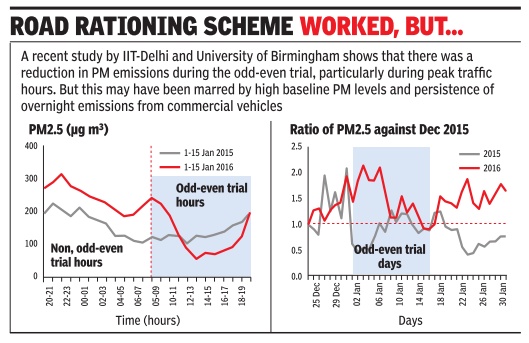
IIT Study Says Government Should Go For Staggered Timings If There's Another Round
A study on Delhi's odd-even trial has suggested that the road rationing scheme did improve air quality during the trial hours -especially during peak traffic hours -but those gains were lost due to heavy car and truck traffic during the nontrial hours between 8pm and 8am.
In addition to emissions from commercial vehicles, increased traffic at night after the odd-even hours may have led to the increase in the 24-hour average particulate matter (PM) values, reveals the study by IIT Delhi in collaboration with University of Surrey , University of Birmingham and others. It also found that the baseline concentrations --those excluding local emission sources such as vehicles estimated by IIT Delhi -at various locations were already high and masking the improvements from the odd-even trial.
The study used data from Delhi Pollution Control Committee (DPCC) to make their assessments for Anand Vihar, Mandir Marg, RK Puram and Punjabi Bagh. Except for RK Puram, all are near heavy traffic zones. It considered hourly averages for the oddeven days in January and April 2016 and the PM data for the same dates in 2015.
Researchers also found that meteorological factors like wind speed and direction played an important role. So while overall PM levels may have been higher during the odd-even phase in 2016 compared to same dates in 2015, it doesn't mean that the scheme failed to make a difference.“Observations clearly indicate that the comparison of the trial periods... will be affected by different background concentrations. Therefore as a necessary step, we estimated the baseline (local site background) concentrations at our selected sites.“
Baseline PM concentrations at all of these locations are taken and subtracted from the actual hourly concentrations to arrive at the net concentrations that can be attributed to vehicles. The team found there was a reduction in both net PM2.5 and PM10 concentrations during January and April trial hours but concentrations were much higher during the morning hours of odd-even and non-odd-even hours. “This seems likely to be related to the time taken for dispersion of the pollutants emitted overnight. The effect of the oddeven hours during winter ranged from a minimal re duction of -2% to a maximum reduction of -44% during peak traffic hours across the studied sites. This effect was relatively larger during summer with the corresponding reduction of -2% to -74% for PM2.5 compared to the 2015 levels.“
Professor Mukesh Khare of IIT Delhi, co-author of the study , said, “If the government is considering implementing the scheme again, they should consider staggered timings so that there is no sudden jump in emissions.“
“The real gains can only be achieved by restricting the entry of heavy goods vehicles during night hours,“ said the study , adding that commercial vehicles contribute to nearly half of the PM10 emissions from the exhaust of on-road vehicles in Delhi.
This is the first study to have singled out vehicular emissions to assess the impact of odd-even. Based on data assessment of previous years, scientists arrived at a baseline for each of these stations. The baseline PM2.5 was found to be the lowest and the highest at 12 and 113 micrograms per cubic metres at RK Puram and Anand Vihar, respectively .
Before another round, measures should be taken to “enable either full source apportionment of the particulate matter, or as a minimum, measurement of chemical tracers for road traffic emissions“, the study concluded.
Results of the ‘odd-even’ experiments of Jan 2016, April 2016
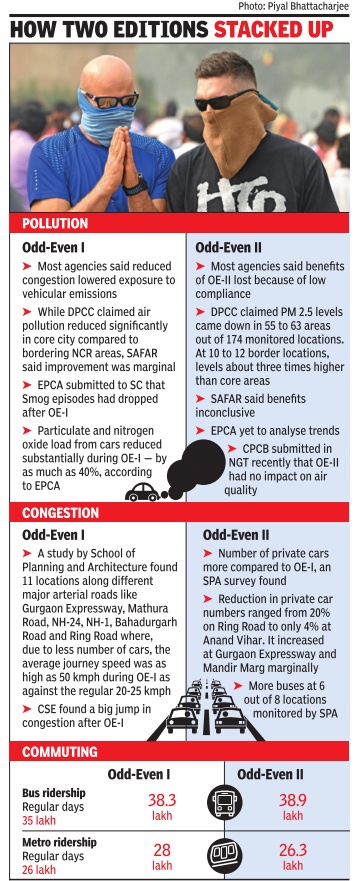
From Nov 10 2017: The Times of India
See graphic, The results of the ‘odd-even’ experiments on level of pollution, congestion and commuting, January 1-15, 2016 and April 15-20, 2016
Court orders
SC, 2019: ‘Odd-even’ not effective, explore other steps
AmitAnand Choudhary, Nov 16, 2019: The Times of India
The Supreme Court said the oddeven scheme has not been very effective in dealing with pollution, and asked the Delhi government to explore other ways to tackle the crisis.
Though the city government claimed pollution was down by up to 15%, the Central Pollution Control Board, quoting from its findings during the last edition of the scheme two years ago, informed the bench that odd-even could at best reduce pollution by 3%.
The government said the impact of the scheme could not be ascertained on the basis of data from this year and the previous year as pollutants entered Delhi due to stubble burning and remained here, increasing pollution.
There will be problem even after farm fires stop: SC
The bench pulled up the city government and said: “Stubble burning is only for a few days. There will be a problem even after it has stopped. The situation will further deteriorate when there will be fog. Sixty per cent of the problem is because of your inaction. Something more than ‘odd-even’ is to be done. It appears that pollution has increased during the oddeven scheme,” the bench said.
Terming the current scheme a halfway measure, the Supreme Court bench said it could not be effective till two- and three-wheelers are also rationed. The Delhi government said bringing all vehicles under the scheme would create chaos.
“Odd-even is not substantially reducing pollution as it targets only cars… If you are serious then bring all vehicles within it. If you give no exemption then it may work. This scheme can be effective only if there is a good public transport system. In other countries, public transport is made free while enforcing odd-even,” the bench said.
Rainfall and air pollution
July 2017- Jun 2018
June 30, 2018: The Times of India
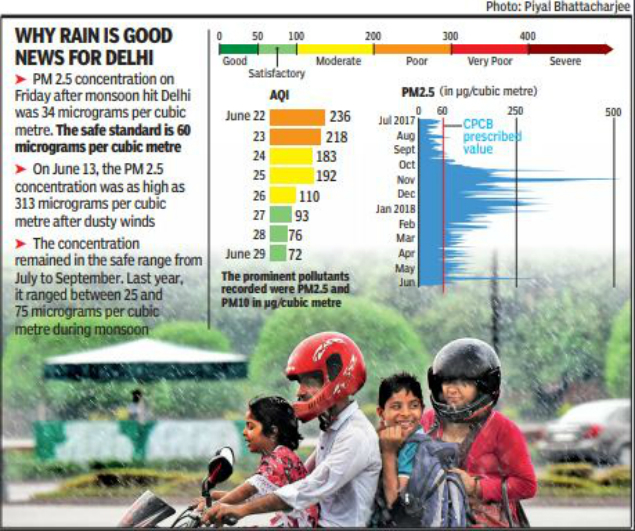
From: June 30, 2018: The Times of India
Bad-air woes washed away, for now
Clean air, a cool breeze accompanied by an afternoon drizzle brought respite to residents as monsoon hits Delhi a day ahead from its normal schedule.
Pre-monsoon and monsoon showers washed away dust and pollutants, bringing down the air quality index (AQI) from ‘moderate’ on June 25 to three consecutive ‘satisfactory’ days. The Regional Meteorological Centre, Delhi, said there may be light showers daily for the next three to four days.
There may be marginally higher rainfall on July 1 and July 2, RMC meteorologists added. Monsoon has covered nearly entire northwest of the country a fortnight ahead of its schedule. “It usually reaches Delhi on June 29. This time it arrived on June 28. There will be light drizzle and cloudy skies for the next few days followed by a period of slightly higher temperature. Monsoon usually covers all of Rajasthan by July 15, but this time it has already covered Rajasthan, Haryana, Punjab and adjoining areas about 15 days ahead of schedule,” said Kuldeep Shrivastava, scientist at regional meteorological centre.
While it may not rain everyday through July to September, Shrivastava said one can expect high humidity between 75% and 80% on most days. Delhi receives about 90cm of rainfall between the two months.
IMD stated that rainfall has been observed in most places over Jammu & Kashmir, Himachal Pradesh, Uttarakhand, Punjab, Haryana, Delhi, east and west Rajasthan and over east and west Uttar Pradesh. This year monsoon touched Kerala on May 29 — three days ahead of schedule.
The PM 2.5 concentrations in the city also fell from about 79 micrograms per cubic metres on June 25 to 34 micrograms per cubic metres on June 29.
Rainfall recorded at Safdarjung observatory till 6.30pm on Friday was about 8.4mm, at Lodhi Road it was 4.7mm and at 10.4mm at Ayanagar.
The maximum temperature was 35.6 degrees Celsius — 1 degree below normal, while the minimum was 27.9 degrees Celsius.
Sept 2011-Sept 2019
Jasjeev Gandhiok , Oct 2, 2019: The Times of India
If you found something very unusual about the clear blue skies and fresh air in the capital this September, you were right. This was the cleanest September the city has seen in the last nine years for which Delhi Pollution Control Committee (DPCC) data is available.
TOI analysed DPCC data from 2011 to 2019 and found that both the average PM2.5 and PM10 levels were within safe standards for the first time during September in all these years. While the average PM10 level was 99 microgram per cubic metre (as against a safe standard of 100), average PM2.5 level was recorded at just 40 microgram per cubic metre, well below the safe limit of 60.
This was a slight improvement from last September, when the average PM10 concentration was 121 microgram per cubic metre and PM2.5 was 44 microgram.
“Meteorological conditions have certainly played a part this September but if you look at trends from 2015 onwards, there has been a gradual decline each year,” said Mohan George, head of DPCC’s air division.
“Pollution was at its peak in 2015. Since then, not only has coordination on the ground improved but there is better preparedness from us and other agencies. Violators are being fined on the spot and there is greater deterrence,” George added.
In September 2015, the average PM10 concentration was 239 microgram per cubic metre, while the average PM2.5 level was 72 microgram. Compared to then, PM10 concentrations have declined by 58% and PM2.5 has come down by 44%.
No poor-air day in Sept this year, GRAP can help control Oct peaks
The change in pollution levels has also been significant in terms of the Air Quality Index, which was started by Central Pollution Control Board in 2015. The average AQI for September has also been coming down gradually since 2015, with the lowest of 98 recorded this year — the first time since data collection when average air quality was “satisfactory”.
The average AQI was 194 in September 2015, 162 in 2016, 139 in 2017 and 112 in 2018. While an AQI reading of 50 or below is classified as “good”, readings between 51 and 100 fall in the “satisfactory” category and those between 101 and 200 are classified as “moderate”. “Poor” air ranges from 201 to 300, “very poor” from 301 to 400 and “severe” from 401 to 500.
Delhi recorded also recorded no “poor” days in September this year with the highest AQI recorded on September 4. In fact, 19 days in the month were classified as “satisfactory” – meaning the AQI was below 100. The remaining 11 days were in the “moderate” range.
Anumita Roy Chowdhury, executive director, research and advocacy at the Centre for Science and Environment (CSE) said while the longterm data analysis shows a downward trend, the monthly averages are influenced both by proactive action and meteorological conditions.
“The annual averages are coming down if you look at the long term data and the number of severe days has also reduced. In September, both meteorological conditions and kick starting action early has helped. This makes a strong case for ensuring that October is also better than the last few years. With the Graded Response Action Plan (GRAP) kicking in soon, we can certain control the peaks,” said Chowdhury.
Dipankar Saha, former head of CPCB’s air lab said rains, not so much in the capital but in the surrounding areas, played a part in controlling dust pollution. “An extended monsoon has meant dust has been kept under control. However, ground level action has improved over the last few years and both these factors are going hand-in-hand to help Delhi,” Saha added.
Remedial measures taken
Cleaner automobile fuel: 2001-20
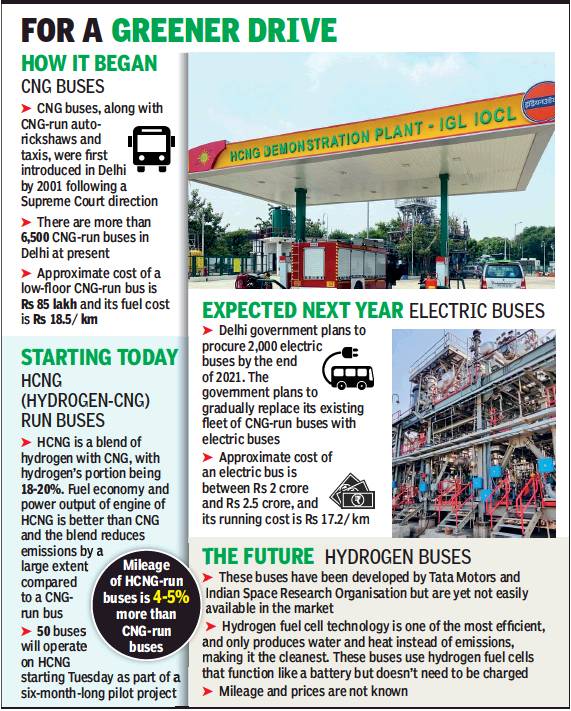
From: Sidhartha Roy, October 20, 2020: The Times of India
See graphic:
Cleaner automobile fuel in Delhi: 2001-20
Tree plantation
Species that help: a 2018-20 study
Mohammad Ibrar, July 5, 2021: The Times of India
Not all trees planted in Delhi are effective to counter pollution and a tree needs to be picked after considering multiple factors, Delhi University’s environmental studies department has found during a two-year study.
The department has found that areas with high pollution content due to high traffic or industries require trees such as neem and peepal as they have high air pollution tolerance index (APTI).
The study was conducted under professor Chirashree Ghosh of the department in collaboration with Babli Moitra Saraf, principal of Indraprastha College for Women, on the college premises. It was an extension of the tree census of the campus, which listed 803 trees across 91 species.
“Delhi government has announced a target of planting 3.3 million saplings in the coming monsoon months and draft Master Plan Delhi 2041 targets to create green belts,” Ghosh said. “Vanmahotsav is organised with a lot of publicity every year. While such policy initiatives are welcome moves, we need to be careful about the rationale behind the choice of the species that are planted,” she added.
She explained that plantation without a proper basis behind the selection of species might result in suboptimal and unwanted outcomes. “It is important to follow scientific methods of evaluating different species of trees for selection before starting plantation drives.”
The purpose of planting trees, Ghosh explained, is to “use their biological qualities to our advantage”. In addition to cooling, providing shade and improving the ambiance, trees prevent soil erosion, retain rainwater and, most importantly, sequester atmospheric carbon dioxide and other gases. Dust consisting of particles of different types and sizes settle on leaves, purifying the air.
“We need to introduce the concept of green infrastructure, which is like a green web that encompasses a wide variety of interactions between biological species and multiple human functions,” she said. “The purpose of urban greening is to conserve the biological ecosystem and utilise its benefits, such as reduction of air pollution, improvement of air quality, control of ambient temperature, and attenuation of noise pollution.” Trees can lower the pollution levels in areas in the vicinity of heavy vehicular traffic, congested bus terminals, petrol pumps, etc, she added.
The study at IP College was essential as it “is located at a disadvantageous location in north Delhi, near Ring Road and Interstate Bus Terminus at Kashmere Gate and high pollution-emitting commercial sites”, said Ghosh. The team monitored the responses of all trees within the campus to the concentration of particulate pollution and calculation of vegetation diversity Index, APTI and anticipated performance index.
“We recommend trees with high APTI values for mega plantation, such as semi-evergreen peepal or deciduous neem along with few moderately tolerant species like deciduous shahtoot and chamrod and evergreen ashok that act as fantastic dust filters,” Ghosh said.
Barren patches, she added, should be replaced with ground vegetation of native shrubs like arni, chhoti-ari and hedge caper, while vilayati kikar, being an invasive exotic, is strictly not recommended for plantation despite being a highly tolerant variety.
According to Anindita Roy Saha of Centre for Earth Studies and teacher coordinator at IP College, the study can help in improving the life on the campus and “can be used in developing models for efficacious designing and development of urban forests, community parks and green belts in highly polluted sites in a city like Delhi”.
Water sprinkling (wet scavenging of pollutants)
2017
Ritam Halder, October 25, 2018: The Times of India
Delhi government is yet again looking at water sprinkling to bring down pollution levels in the capital post-Diwali. Environment minister Imran Hussain, who on Tuesday asked all city agencies to be on warmode to combat air pollution, has stressed on sprinkling of water from high-rises as one of the measures.
“The minister held a meeting with the chief secretary, commissioners of north, south and east corporations, New Delhi Municipal Council chairman, environment, transport and power secretary, special secretary (industries), chief engineer (PWD), and other senior officials of different government agencies. He directed PWD and Delhi Fire Services to undertake water sprinkling, especially after Diwali, for settling the suspended dust particles,” a senior government official said.
However, this exercise had proven futile last year, revealed before and after pollution data of the area where it was conducted.
On November 15, 2017, nearly 75,000 litres of water was sprinkled from Vikas Minar, the tallest building in ITO, a congested and polluted office hub in the heart of the city. However, readings from Central Pollution Control Board’s air quality monitoring station at ITO showed that the measure had little effect on pollution levels. The level of PM2.5 — ultrafine particles that can penetrate deep inside our lungs — continued to rise even after the hour-long exercise.
From 106 micrograms per cubic metre (satisfactory category) at around 4pm, the level of PM2.5 in the region shot up to 129 micrograms per cubic metre (very poor category) by 5pm. By 11pm, it had shot up to around 227 micrograms per cubic metre.
Experts say wet scavenging of pollutants, as the method is popularly known, is effective only when the source of pollution is confined to a limited area and the pollution is short lived.
“The aerial sprinkling last year had very little effect. It is just a temporary measure to control pollution levels when it reaches alarming levels,” former air laboratory chief at the CPCB, Dipankar Saha, said.
SN Tripathi, coordinator of Centre for Environmental Science and Engineering at IIT Kanpur, said aerial sprinkling can help in a small area, but not a polluted city like Delhi, which has multiple emission sources. “There are other effective, long-term measures. If the government is doing it, there is need for some transparent results on how effective the exercise was and a mechanism to assess it,” he said.
Delhi government had in December last year also deployed an anti-smog gun, a device which sprays atomised water (tiny droplets of water) up to a height of 50 metres, creating an artificial mist, which is in turn expected to stick to air-borne pollutants and bring them down to the ground. However, when the device was tested at Anand Vihar, near a pollution monitoring station, it had little impact on air quality readings.
Last year, the government had also installed an “anti-pollution tower” under the Indraprastha Marg flyover, near ITO. This tower is fitted with exhaust fans to suck in polluted air. A machine inside the tower then removes nearly 90% of the particulate matter and spews fresh air out. Such purifiers are known to work indoors but in a city like Delhi, where there are multiple sources of pollution, they rarely help, experts said.
Successes in lowering pollution
Nov. 2017 better than 2016
Jasjeev Gandhiok, ‘Graded plan reason why air better in 2017, December 3, 2017: The Times of India
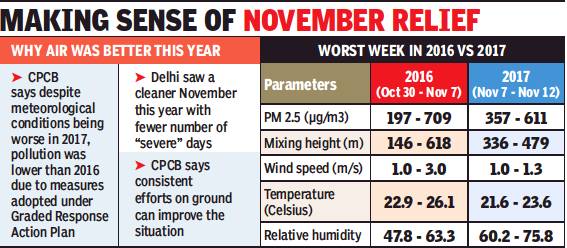
From Jasjeev Gandhiok, ‘Graded plan reason why air better in 2017, December 3, 2017: The Times of India
See graphic:
Measurement of parameters- PM 2.5, mixing height, wind speed, temperature, relative humidity, November 2016 and November 2017
Conditions Were Worse Than 2016: CPCB
The meteorological conditions have been much worse in 2017as compared to the ‘peak’ period in 2016, said Central Pollution Control Board (CPCB), with measures like Graded Response Action Plan (GRAP) and other efforts on the ground helping control the pollution.
CPCB officials said Delhi actually witnessed a better November with lesser pollution this year despite both temperatures and mixing height — the height at which particulate matter disperses — being much worse as compared to the peak period last year.
CPCB data shows that in the peak period this year between November 7 and November 12, Delhi’s average temperature varied between 21.6 to 23.6 degrees Celsius as compared to 2016 when it was between 22.9 to 26.1 degrees Celsius. This in turn also affected the mixing height which was much lower this year as compared to last year — therefore trapping particulate matter closer to the ground and reducing wind speed. The mixing height was between 336 to 479 metres this year as compared last year when it ranged between 146 to 618 metres.
Dipankar Saha, head of CPCB’s air laboratory, said that this in turn also affected the wind speed which varied between 1 to 1.3 m/s this year. Last year, during the peak period between October 30 to November 7 when Delhi witnessed ‘severe’ pollution levels, wind speed was between 1 to 3 m/s.
“The mixing height was much lower this year and the wind speed was very calm. This makes it difficult for particulate matter to disperse easily and it stays close to the ground. Pollution levels, however, have been controlled this year much better than last year, largely owing to preventive measures like GRAP and all agencies being more aware and active on the ground,” Saha told TOI.
CPCB data during the same period also showed higher relative humidity this year which reached as high as 75% as compared to last year when it ranged between 47.8% and 63.3%.
Impact of RFID on toll booths: 2015-20
Jasjeev Gandhiok, RFID tab: ‘Commercial PM count down by 95%’, March 16, 2020: The Times of India
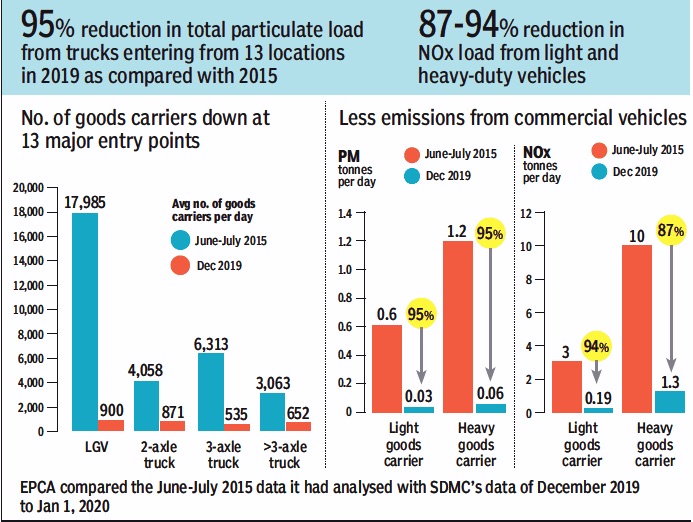
From: March 16, 2020: The Times of India
Use of radio frequency identification (RFID) system at toll booths seems to be paying dividends as far as checking pollution level in the capital is concerned.
According to a report submitted by Environment Pollution (Prevention and Control) Authority (EPCA) to the Supreme Court, total particulate matter (PM) emissions from the commercial vehicles entering Delhi through the 13 main border points where RFID system is installed have fallen by 95% in the past five years. The total NOx emissions due to light and heavy good carriers have fallen by 87-94% since 2015.
EPCA says there has been a considerable drop in the total number of commercial vehicles entering Delhi through these 13 border points. Construction of eastern and western peripheral expressways and collection of Environment Compensation Charge have helped the city, it adds.
The SC-appointed body said it compared data provided in 2015 and in 2019-2020 to determine the average number of light good carriers and heavy good carriers entering the national capital through the border points.
“The results from the 13 points in the city are substantial and suggest that the efforts to mitigate pollution have been rewarded. Compared with 2015, there is a 95 percent reduction in the total particulate load from the trucks,” said the report. While the PM emissions from light good carriers and heavy good carriers in 2015 were 0.6 and 1.2 tonnes per day, respectively, this has now come down to just 0.03 and 0.06 tonnes per day – a reduction of 95 percent in both.
The study revealed that NOx emissions from the light good carriers were down by 94 percent – from 3 tonnes per day to just 0.19 tonnes per day. For heavy good carriers, it went down by 87 percent – from 10 tonnes per day to 1.30 tonnes per day. Data from SDMC, SAFAR and a CPCB report were used to study the impact of RFID toll booths on the pollution in the national capital.
The EPCA report stated the total average number of light good carriers was down from 12,985 vehicles per day in 2015 to 900 vehicles per day in December 2019. Similarly, the number of two-axle trucks came down from 4,058 vehicles per day in 2015 to 871 vehicles per day in December 2019.
The Supreme Court-appointed EPCA in its report also urges the apex court to issue further directions to cover 10 more border points in Delhi through similar RFID toll booths. These include Noida Major, Loni Main, Dhansa border, Kundli-II, New Seelampur 1st, Bajghera, New Kondli, Chander Nagar, Jharoda and Pul Prahladpur. Another 101 points identified can be covered through hand-held RFID readers, it suggested.
Variations according to season, time
'Air quality: worst at night and early morning
Delhiites may be exposed to the worst air pollution at night and early morning, indicates a study by the Centre for Science and Environment (CSE). CSE chose eight people and monitored their exposure to pollution for 24 hours using a portable device. It also found that situation in the Lutyens' zone, where the rich and the powerful reside, is no better despite the greenery and sparse traffic. The study found PM 2.5 (fine, respirable particulate) levels to be the highest at night and during hours when these people go for morning walk. In some cases, even indoor air quality was extremely poor.
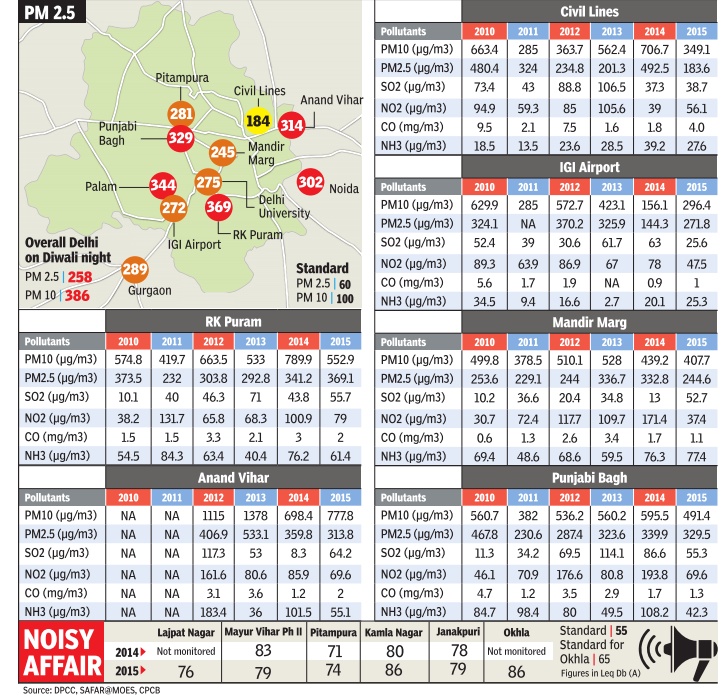
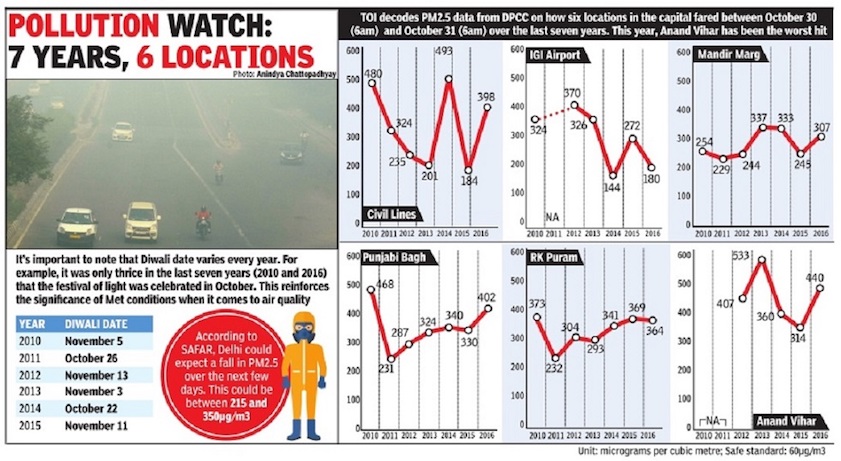
The Times of India

The Times of India
The study involved monitoring the personal exposure of Bhure Lal, chairperson, Environment Pollution (Prevention and Control) Authority (EPCA), a resident of Lodhi Estate, Harish Salve, senior Supreme Court advocate who lives in Vasant Vihar, Ashok B Lall, architect and resident of Civil Lines, Randeep Guleria, head of pulmonary medicine department at AIIMS, William Bissel, head of Fabindia and resident of Hauz Khas enclave.The group also had people who suffer from asthma--Bharati Chaturvedi who lives in Ravindra Nagar in central Delhi, head of Chintan, Kaushik Das Gupta, a journalist and Avikal Somvanshi, a research professional and cyclist.
The 24-hour average exposure of each individual was compared with the readings of the nearest monitoring station of the Delhi Pollution Control Committee (DPCC) which revealed that the real exposure levels were much higher than the official figures. Lal who lives in Lodhi Estate was monitored on November 12 to 13.
Asthmatics are already facing a tough winter. “I was having breathing problems.Doctors recently told me I am borderline asthmatic and may get better if I am in a city with lower pollution levels,“ he said. Sunita Narain, director general of CSE, said she had stopped going for morning walks.
“Our data shows that for a couple of years after introducing CNG the pollution levels had stabilized, but they started to rise steeply with the increase in the number of vehicles. Our soft options are over, we need tough measures now,” Narain said.
Delhi: December: Air Pollution
Respiratory Problems
December 20, 2014 Jayashree Nandi
Air quality in the city deteriorated to “hazardous” levels with the US embassy’s pollution monitoring station advising people to “avoid all physical activity outdoors”. Even the Delhi Pollution Control Committee (DPCC)’s real-time air quality monitoring system showed the 24-hour average count to be over 315 micrograms per cubic metre on Mandir Marg alone, which is about five times the national safe standard. Besides, a layer of smog shrouded the city.
What is worse, there are more such bleak days ahead.
According to System of Air Quality Weather Forecasting and Research (SAFAR) under the ministry of earth sciences, pollution will increase at an alarming level in the next few days with a daily average of over 200 micrograms per cubic metre. The low temperature and calm air are causing “inversion“ that can lead to pollution such as smog being trapped close to the ground. Such poor air quality may trigger respiratory problems among people with low immunity, the elderly and the very young. Doctors fear poor air quality may be doing more damage than just triggering a few wheezing episodes. Constant exposure to bad air is making Delhiites vulnerable to arrhythmias and ischaemic heart disease. Arrhythmia is a disorder characterized by irregular heart beat or abnor mal heart rhythm while ischaemic heart disease is associated with reduced blood supply to the heart.
Dr S K Chhabra, head of cardiorespiratory physiology department of VB Patel Chest Institute, says continuous exposure to high air pollution levels is like being exposed to second-hand smoke. Recently, he made a detailed presentation on this before pollution control agency officials from Saarc countries. Chhabra quoted an AIIMS study which found higher number of complaints and instances of hospitalization due to chronic obstructive pulmonary disorder (COPD) and coronary issues apart from asthma and other respiratory conditions during high pollution days. He also said exposure to diesel emissions causes allergic responses.
“Fine particulate matter and gaseous pollutants are significant risk factors for acute stroke death. Women and the elderly are most susceptible,” his presentation said.
Dr Ashwani Mehta, senior consultant cardiologist at Sir Ganga Ram Hospital also be lieves the rise in incidence of strokes and arrhythmias are linked to high air pollution levels. “The respiratory problems from bad air can affect the heart. Besides, air pollution can cause myocardial infarction or heart attacks. Unfortunately we don’t have much data in India that can directly relate air pollution with the incidence of heart attacks. But increasingly we are seeing young people having heart attacks. Women who you don’t expect to usually suffer heart attacks are increasingly reporting heart attacks. It’s a combination of issues but I think particulate matter is also to blame.” Oncologists are seeing a 1% to 2% rise in lung cancer incidence each year but again there is no documentation of how much of lung cancer incidence is linked to air pollution.
Dr Vinod Raina, director and HOD, oncology and haematology at Fortis Hospital, said there was a “slight increase in incidence of cancer among non-smokers. Otherwise, we need documentation to understand how much air pollution contributes to lung cancer.”
2015-18: Air quality during monsoons
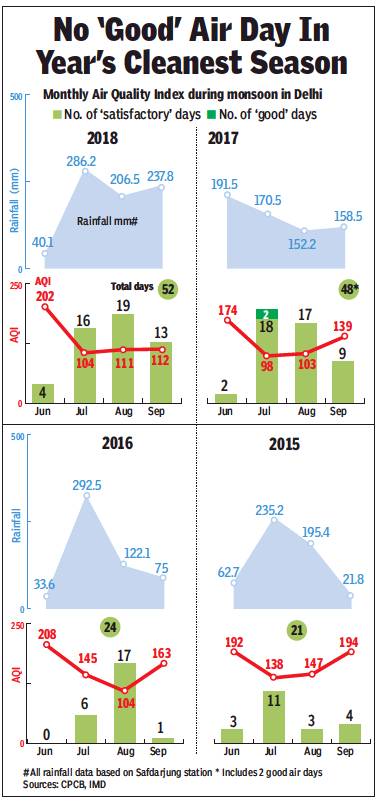
From: Amit Bhattacharya, Not a single ‘satisfactory’ air month this monsoon, October 8, 2018: The Times of India
Barring Sept, Other Months Worse Than Last Year
Despite good rains, the capital’s air during this monsoon season wasn’t as clean as the same period last year. The city did not have a single “good” air day during the season (June-September) that is generally the cleanest period of the year, while the monthly air quality index (AQI) failed to reach the ‘satisfactory’ category in any of the four months.
Barring September, which recorded the best AQI for the month in at least four years, air quality in the other three months of the season wasn’t as good as the same months in 2017, the Central Pollution Control Board’s data reveals. The average AQI in August was higher than in the past two years.
Last year, the monsoon season had seen two “good” air days — when the CPCB’s sixgrade AQI records readings were in the range of one to 50. It became a much talked about event and was seen, at least in part, as an outcome of the anti-pollution measures being taken in Delhi and NCR.
The two “good” air days were recorded in July last year. The average AQI recorded that month was 98 — the only instance in four years (2015 to 1018) when the average air quality had improved to the “satisfactory” category (AQI range of 51 to 100).
The hope that air quality during this year’s monsoon would match this figure — with more anti-pollution measures taken since then, particularly the environment cess on trucks entering the city — has not been realised.
There were a higher number of “satisfactory” air days this season at 52, as compared to 48 last year and 24 in 2016. However, CPCB’s data shows that the average air quality this monsoon remained in the “moderate” zone during three months while it was “poor” in June. The poor air in June can partly be explained by the dust incursion from the Gulf that led to “severe” air quality in the capital for three straight days, a rare occurrence for that month.
“One has to realise that the local environment both within the city and outside, as well as meteorological factors, which include wind speeds and direction, will continue to play a major role in determining Delhi’s air quality,” said Dipankar Saha, former head of CPCB’s air quality monitoring.
While rainfall plays a big part in clearing air pollutants during the monsoon season, the data reveals that higher amount of rain doesn’t always bring cleaner air. For instance, rainfall in July 2017 (170.5mm at Safdarjung) was much lower than what was recorded during the same month this year and in 2016, but the air quality in 2017 was significantly better.
Oct, Nov in 2016, 17, 19 but not 18
Ritam Halder, Nov 17, 2019: The Times of India
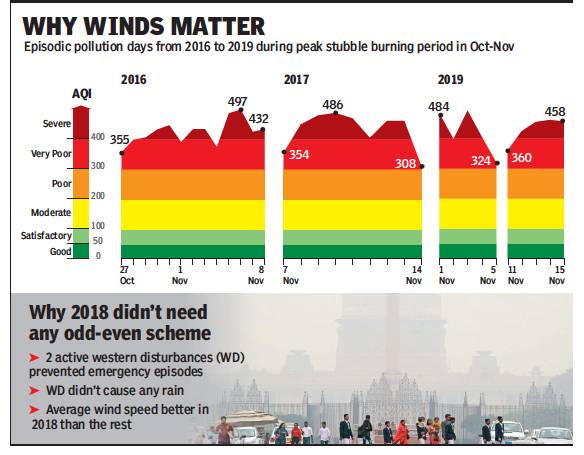
From: Ritam Halder, Nov 17, 2019: The Times of India
Two high-pollution events, with smoggy weather and “emergency” level air quality readings, were recorded in November 1-5 and 11-15. The causes of these episodes, according to experts, were largely meteorological factors. Understanding weather behaviour is key to planning antipollution measures, they said.
“The major reason for the build-up of pollutants was the absence of wind,” said an official of the Indian Meteorological Department. “Unlike in 2018, there were no active western disturbances this year to clear the region of pollution.”
Two earlier years had seen smog episodes during October 28-November 6 in 2016 and November 7-14 in 2017. However, last year, active western disturbances on November 2-4 and 14-16 helped the city avoid the haze.
The IMD official said, the western disturbances this year didn’t result in much rain over Delhi-NCR. “The pollutants remained undispersed, in fact got aggravated due to moisture and low temperature,” he said. “Though low wind is predicted for next week, there are fewer crop fires now, so the air quality might not reach such toxic levels again.”
Just after Diwali, the November 1-5 period saw pollution created by burning of paddy harvest residue in neighbouring states and blown to Delhi accounting for 44% of the capital’s PM2.5 pollutants. A slight drizzle on November 2 worsened the situation, making November 3 the foulest day in Delhi this season.
“Rain washes away pollutants, but light drizzles and calm wind conditions adversely affect air quality,” the expert said. “Secondary particles, such as sulphates, nitrates, ozone and organic aerosols, are products of complicated atmospheric reactions between primary particles, such as particulate matter, sulphur dioxide and nitrogen dioxide directly emitted by stubble burning and vehicles in the presence of factors like sunlight and moisture.”
In the second episode from November 11-15, cloud cover and a slow wind speed due to a western disturbance did not allow dispersion of the accumulated pollutants.
Dipankar Saha, former head of Central Pollution Control Board’s air laboratory, noted that the intrusion of trans-boundary dust was also on the rise. “We getting less rainfall in June and July and more in September and October,” he said. “This is causing late harvesting and so forcing farmers to resort to harvest residue burning. We need to have a clear-cut understanding of meteorological behaviour and plan accordingly.”
Saha said that the analyses of these high-pollution episodes showed that their frequencies were increasing over the years. “Concentrations of the fine PM2.5 pollutants are also rising,” he added. “The root cause is lack of land-use planning and locally originated emissions.”
According to Anumita Roychowdhury, executive director, research and advocacy, Centre for Science and Environment, sustained anti-pollution action is the need of the hour for cleaner air in the region. “Winter is vulnerable to high smog episodes. Adverse weather conditions, high local pollution and transport of pollutants are big factors,” she said. “But we should leverage this crisis for a sustained action to eliminate dirty industrial fuels, upscale public transport and push for zero-waste solutions across Delhi-NCR to bring a reduction in round-the-year pollution.”
2017, 2018: Sept 23-29
Jasjeev Gandhiok, Dip in air quality triggers action meet, September 30, 2018: The Times of India
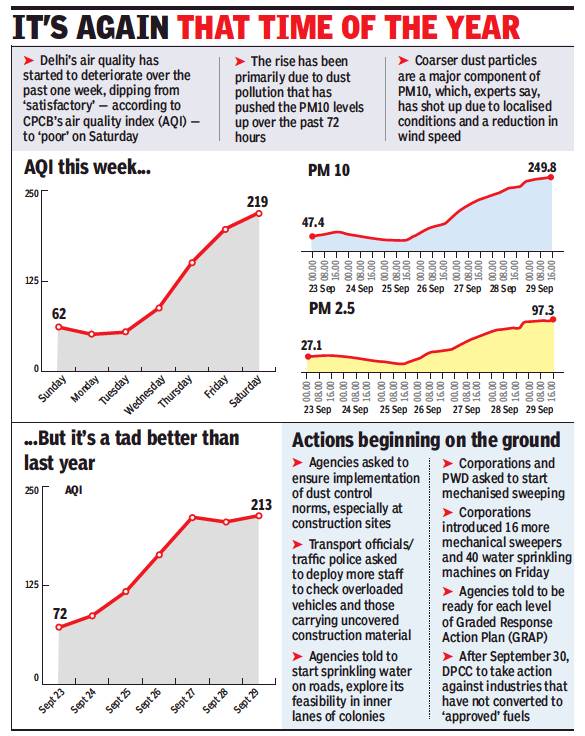
From: Jasjeev Gandhiok, Dip in air quality triggers action meet, September 30, 2018: The Times of India
That all familiar ‘winter’ feeling may soon be returning to the capital with Delhi’s air quality deteriorating to ‘poor’ on the Central Pollution Control Board’s air quality index on Saturday, with a reading of 219 – just days after it was recorded as ‘satisfactory’ and even touched ‘good’ briefly, falling below an AQI reading of 50.
The sudden deterioration in air quality over the last few days has primarily been due to local conditions according to experts, with Delhi witnessing a ‘transition’ phase where the monsoon retreats and the wind speeds drop – resulting in PM 10 levels shooting up to almost 2.5 times on Saturday.
D Saha, former head of CPCB’s air laboratory said the change is a common occurrence around this time of the year, however things will start improving once wind speeds increase. According to CPCB’s central control room data, the average PM 10 levels at 6pm on Saturday to be 254 micrograms per cubic metre – almost 2.5 times the safe standard of 100 micrograms per cubic metre.
Meanwhile, with the pollution levels spiking over the last 48 hours, the Supreme Court-mandated Environment Pollution (Prevention and Control) Authority (EPCA) is all set to meet on Friday to work on implementing the Graded Response Action Plan (GRAP) which will kick start on October 15.
EPCA officials said the meeting will look at localised sources of pollution, with hotspots in Delhi like Anand Vihar and Mundka currently being analysed due to their ‘high’ readings.
“There is no evidence to suggest at the moment that crop burning is the reason for this problem. Wind speeds in Delhi and NCR have fallen to almost zero and locations on the outskirts of NCR like Gurgaon or Rewari are all in the ‘very poor’ range almost. In Delhi, locations like Mundka and Anand Vihar are also in the orange category, which is mainly due to localised pollution and we want to identify that and start action on it,” said Sunita Narain, member of EPCA and director general at Centre for Science and Environment.
Meanwhile action on polluting industries in Delhi is likely to start soon with the Delhi Pollution Control Committee’s deadline for industries to shift to ‘approved’ fuels to end on September 30. DPCC, in its notification on June 29, had issued a list of fuels that could be used in Delhi, which included LPG, CNG, PNG, Diesel, Petrol and aviation turbine fuel among others.
2017/18: not much seasonal variation, summers marginally better
Jayashree Nandi, Why pollution may not have a season anymore, June 15, 2018: The Times of India
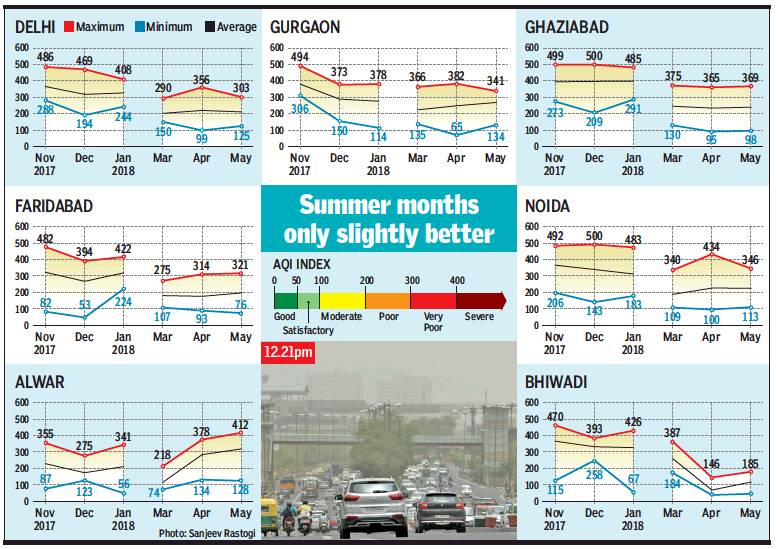
From: Jayashree Nandi, Why pollution may not have a season anymore, June 15, 2018: The Times of India
Air In NCR From March To May As Bad As In Winter Months
Winter pollution in the national capital region may be deadly, but summer doesn’t give much respite either.
While dust storms from Rajasthan may have led to a sudden severe spike in particulate matter pollution in the capital on Wednesday, the Central Pollution Control Board recently released air-quality data for NCR cities, which showed only a marginal improvement over winter in the air quality index in summer months as they continued to record “very poor” and “poor” air quality even in March, April and May.
Gurgaon, Ghaziabad and Bhiwadi, besides Delhi, are suffering extremely high air pollution levels. None of the NCR cities, except Alwar, recorded a single “satisfactory” air day in March; Delhi saw one satisfactory day, Gurgaon two, Ghaziabad one and Faridabad recorded three satisfactory air days in April.
In comparison, Gurgaon recorded as many as nine and Bhiwadi had 10 “very poor” days. Even in May, Bhiwadi had 11 “very poor” and one “severe” air day, and Gurgaon recorded 10 “very poor” days.
Delhi, Gurgaon, Noida and Bhiwadi had no satisfactory days in May. Experts believe NCR needs a consistent summer plan. Summer pollution may exacerbate in the coming years depending on meteorological trends. For example, this year was particularly dry with few western disturbances raising dust and loose soil. “In 2014, there were several dust storms and this year, too, we saw 7-8 episodes. It’s difficult to say if it’s a trend. But this year dust was definitely high and conditions extremely dry,” Kuldeep Shrivastava, scientist at regional meteorological centre of IMD, said.
The IIT-Kanpur’s Comprehensive Study on Air Pollution and Greenhouse Gases in Delhi carried out between 2013 and 2014 did highlight that summer pollution in the capital is mainly a result of dust and fly ash. The average concentration of PM2.5 in summer season was around 300 micrograms per cubic metres against the acceptable level of 60 micrograms per cubic metres. The crustal component accounted for about 20% of total PM2.5. “This suggests soil and road dust and airborne fly ash are a significant source of PM2.5 pollution in summer.”
But there are no such source apportionment studies for other NCR cities where thermal plants, industries and massive construction activity before monsoon may be adding to the trouble.
Sachchida Nand Tripathi, head department of civil engineering, IIT-Kanpur, said: “Prima facie, this summer it appears like dust is playing a major role in increasing air pollution levels. But we have to analyse PM10 levels in relation to PM2.5 levels and wind direction data to understand how much are anthropogenic sources like road dust contributing to the summer problem. It needs to be studied.”
Anumita Roy Chowdhury, executive director, Centre for Science and Environment, said: “Windblown dust increases significantly in summer. IITKanpur also flagged solid waste burning and emissions from fly ash dumps. The problem is similar in other NCR cities.”
Jan air in 2017, 18, 19
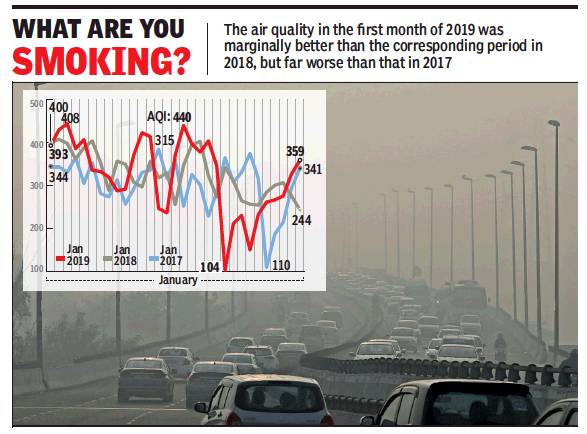
From: Ritam Halder & Jasjeev Gandhiok, Blame it on weather: Air much fouler this January than in 2017, February 9, 2019: The Times of India
In Contrast, City Had Seen Its Cleanest December Of Three Years In 2018
Delhi’s air quality in January was as foul as in the same month in 2018, and much dirtier than 2017. According to the data released by the Central Pollution Control Board, the average AQI for January 2019 was 325. It was 327 last year and 304 in 2017. The city recorded a much cleaner October-December compared with the same periods in the past two years.
This year, there were seven “severe” days in January compared with four in 2018 and none in 2017. But this year, there were also two relatively clean “moderate” days against none last year and one the year earlier. 2019 also recorded the best and worst days, with January 3 logging the worst AQI of 444 and 22, the cleanest of 104.
Dipankar Saha, former head of CPCB's Air Quality Lab, explained the AQI variation was due to the emission load and dispersion mechanism. “In unfavourable meteorological conditions, the pollutants accumulate and their concentration increases, raising the AQI,” he said.
The capital had witnessed its cleanest December last year in terms of air quality in the past three years. The average AQI for the month in 2018 was 360 compared with 369.5 in 2017 and 364 in 2016.
The October data showed an improvement in 2018 with an average AQI of 268.6 against 284.9 in 2017 and 270.9 in 2016. The average AQI for November too showed a dip in 2018. It was 334.9, a big improvement from 360.9 in 2017. The average AQI in 2016 was even higher and Delhi had then experienced 10 “severe” days and an average monthly AQI reading of 374.1.
According to Anumita Roy Chowdhury, head of air pollution and clean transportation programme at Centre for Science and Environment, said the comparatively high January average despite October, November and December showing relative dips in AQI indicated that the city was responsible for its own foul air. “Till November, we know stubble burning in the neighbouring states contributes to the toxic air we breathe. In January, this factor is missing and we breathe in what we emit,” she said. “We need more year-round, long-term actions to be put in place and properly implemented.”
Gufran Beig, director, SAFAR, said the overall air quality this winter has been much better with January also not faring too poorly, despite the low temperatures. “Air quality may have been impacted in January by the fall in temperature,” Beig pointed out. “Compared with the last couple of years, the conditions were more hostile for air quality, with a big dip in temperature. This can lead to a spike in pollution levels.”
2017-19: Good air days
August 19, 2019: The Times of India
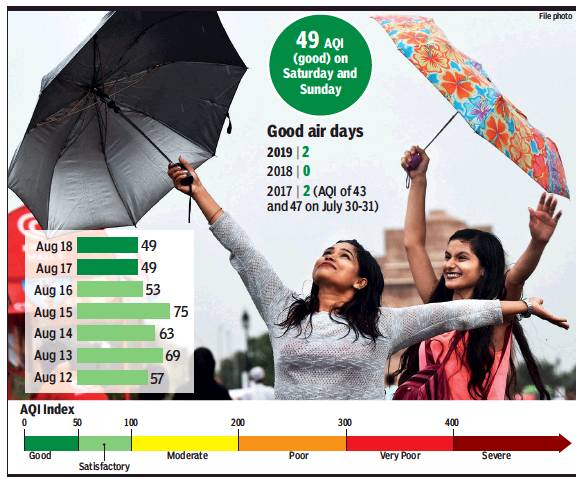
From: August 19, 2019: The Times of India
After more than 2 years, city has two consecutive ‘good air’ days
New Delhi:
Incessant rain over the past 48 hours has brought “good” news to Delhi. The capital’s air quality index (AQI) was recorded at 49 on two consecutive days of the weekend, the first time in over two years that the city’s air was classified as “good”.
An AQI between zero and 50 is termed “good”, which is so rare in the capital that such a day was last recorded in 2017. Then, too, Delhi had two straight good air days, on July 30 and 31. Not a single day in 2018 could make the cut.
Delhi may, in fact, have a longer run of good air days this time around as the AQI is forecast to stay around the same level over the next three days.
Why rain isn’t the only factor behind good-air week in city There Were No ‘Good’ Days In 2018
Central Pollution Control Board officials said continued improvement in air quality is not only because of meteorological conditions, but also due to work being undertaken to curb pollution.
Delhi had largely been recording “satisfactory” air quality this week with AQI hovering between 51 and 100. However, it fell to 49 on Saturday after a reading of 53 on Friday.
“No good air days were recorded in 2018 despite rain. The improvement in AQI is a good sign for the region. While meteorological factors are largely playing a part, the sustained efforts on the ground have contributed to the change,” said a senior CPCB official.
Dipankar Saha, former head of CPCB’s air laboratory, said Delhi has barely been breaching the “good” barrier and more efforts are required to make the AQI fall lower. “The number of good days could increase, which is a good sign. However, we now need to push the AQI barrier even lower and aim for it to fall below 40. Continuous rain will help, but this is only temporary and more efforts are required for clean air through the year,” he added. Safdarjung, the city’s base weather station, received 45.7mm of rainfall in a 24-hour duration till 8.30am on Sunday, with good showers occurring overnight. The Ridge station received the highest rainfall, recording 65.8mm. A rainfall over 64.5mm is classified as “heavy”. This monsoon, only Aya Nagar had recorded heavy rainfall of 106mm in a single day.
An official from the regional meteorological department said the wet spell was being caused by continuous moisture incursion from Arabian Sea and a low pressure area over Haryana. “The intensity will lower from Monday onwards, but light showers are still expected to continue. We have seen moderate to heavy rainfall in Haryana, Chandigarh, Delhi, Punjab and north Rajasthan in the last 24 hours,” the official added.
SAFAR, a forecasting body under Union ministry of earth sciences, classified AQI as “good” on its index as well, saying it could remain in this range for the next three days due to favourable conditions.
“Widespread rainfall in and around the NCR continues to positively influence air quality through wet scavenging of suspended aerosol. Fairly widespread to widespread rainfall and isolated heavy rainfall are also expected in Delhi. Air quality is predicted to be in the good category for the next three days,” said SAFAR.
The fortnight Oct 25- Nov 5 is generally bad
Jasjeev Gandhiok, Oct 31, 2019: The Times of India
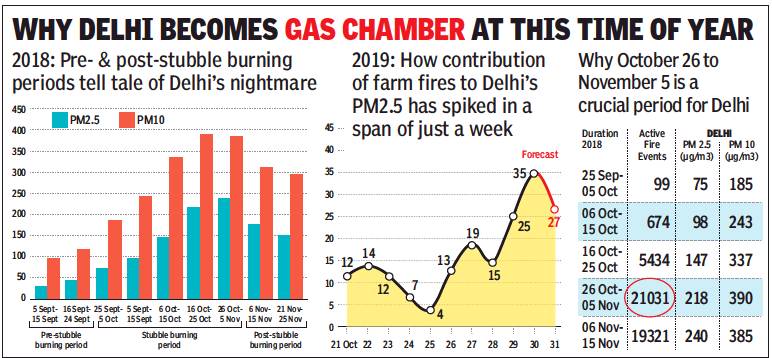
From: Jasjeev Gandhiok, Oct 31, 2019: The Times of India
Crop stubble burning in Punjab and Haryana had a lot to do with the grey, suffocating day that Delhi suffered. The particles released by the field fires constituted 35% of the PM2.5 pollutants that enveloped the city, the highest so far this season. Last year too, most farm fires were reported in the period between October 26 and November 5, according to data submitted by the state pollution boards to the Prime Minister’s Office.
System of Air Quality and Weather Forecasting And Research (SAFAR), an agency under the Union ministry of earth sciences, said on Wednesday that the contribution of stubble burning to Delhi’s pollution would likely dip on Thursday. It, however, added, “The biomass share is still predicted to be 27% and hence AQI is forecast to be in the severe category on Thursday.”
The forecasting agency said, “The overall air quality of Delhi, after recovering from the firecracker pollution, has again plunged to the ‘severe’ category, purely attributed to stubble fires. This touched the season's high of 35% on Wednesday.” It added that Tuesday night’s extremely calm surface wind, as expected, only aggravated the situation by allowing accumulation of pollutants.
SAFAR predicted a slight improvement in air quality, relying on increased surface wind speed to help disperse pollutants. It said that for two days starting Thursday, the wind direction was likely to be northwesterly and so poised to carry pollutants to Delhi. But, it added, a slight increase in surface wind speed is expected by Thursday mid-noon which could lead to faster dissipation of particles and cause air quality to improve a bit.
SAFAR also said that, as evident from its multi-satellite fire product, the effective stubble fire count in Haryana and Punjab had significantly declined to 1,057 in the past 24 hours against the 2,577 on Tuesday. However, NASA scientist Hiren Jethva was emphatic that the air quality was worsening after Diwali due to farm fires. “Stubble burning is on the rise and has already crossed the 2015 and 2018 levels. It is expected to only climb further,” Jethva said.
The CPCB-led task force on pollution held an emergency meeting on Wednesday, and asked Punjab and Haryana to crack down on farmers clearing their field of the rice harvest remnants by burning them. “The two states must take immediate stringent actions to curb stubble burning and biomass burning in Delhi and NCR towns must also be strictly checked,” CPCB said.
Last year, between October 26 and November 5, there were 21,031instances of stubble burning in Punjab and 2,454 in Haryana. Data submitted to the PMO showed Sangrur, Firozpur, Muktsar, Bathinda and Patiala in Punjab had the highest active fire counts in Punjab, while the problem areas in Haryana were Kaithal, Fatehabad, Sirsa and Jind. Last week, the PMO directed the two states to. It had also identified 13 hotspots along the border of Punjab and Haryana.
Till October 14, Punjab and Haryana were both well behind the target of distributing tilling machines that allowed farmers to avoid stubble burning. While Punjab met 34.6% of its target, Haryana had achieved 66.6%, largely by making such machines available via custom hiring centres.
August
2015- 20
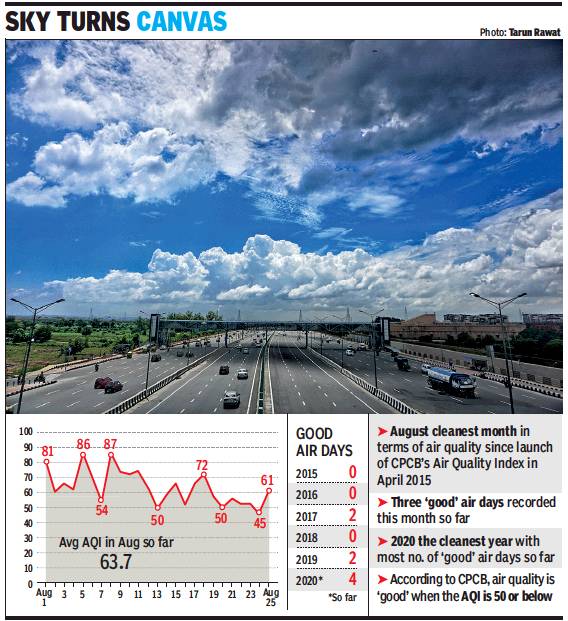
From: Jasjeev Gandhiok, August 26, 2020: The Times of India
See graphic:
Good air days in Delhi in August, 2015- 20.
November
2017-19
Jasjeev Gandhiok, Dec 3, 2019 Times of India
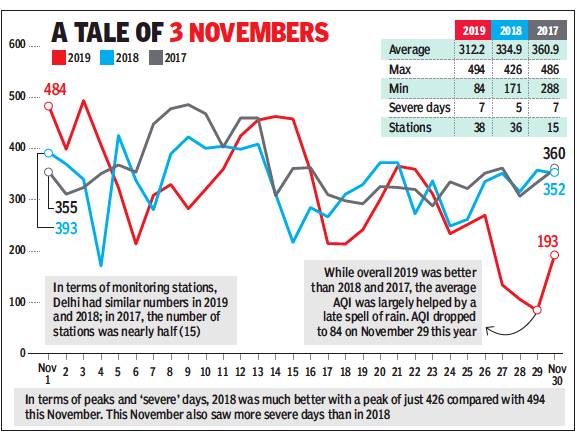
From: Jasjeev Gandhiok, Dec 3, 2019 Times of India
While the overall average air quality index (AQI) for November this year has been better compared with that of 2018, the penultimate month recorded more “severe” days and a higher peak in pollution levels.
In 2019, Delhi recorded seven “severe” days as against five last year in November. As far as the pollution peaks are concerned, AQI last year was limited to highs of 423 and 426. In comparison, this year’s November saw a peak of 494 as well as a reading of 484.
The average AQI for November this year was recorded at 312 – an improvement from the last year’s average of 334, according to Central Pollution Control Board (CPCB)’s daily index. In 2017, it was even higher with a monthly average of 360.
The data, however, has largely been helped by a clean spell at the end of the month this year with rain bringing down the AQI to first the moderate range and then to the satisfactory range. November 29 recorded the lowest AQI (84) in November in the last three years.
Anumita Roy Chowdhury, executive director, research and policy at the Centre for Science and Environment (CSE) says that meteorological conditions play an important part in curbing pollution.
“We have seen the impact rains have had at the end of the month as well as the effect meteorology can have at the start of the month when it touched 494. This year’s data shows that even with concerted efforts we are seeing such smog episodes. We need to work harder to control the peaks,” adds Chowdhury.
She opines that action should not be limited to just Delhi, and a larger air-shed needs to be targeted with action being undertaken across different cities and states.
“Long-term data shows pollution has been stabilised over the last few years. However, we are still seeing these peaks and erratic meteorological conditions. We will have to put in extra efforts to ensure we can be prepared for such pollution peaks,” said Chowdhury.
Dipankar Saha, former head of CPCB’s air laboratory, said that meteorological conditions across the entire Indo-Gangetic plains are a problem, making it even more important to control local emissions. “Due to meteorology and low wind speed or increased moisture, local pollutants get trapped and this may occur for days. This is why the region is so important for tackling pollution,” said Saha.
The peak seasons
Seasons having high air pollution
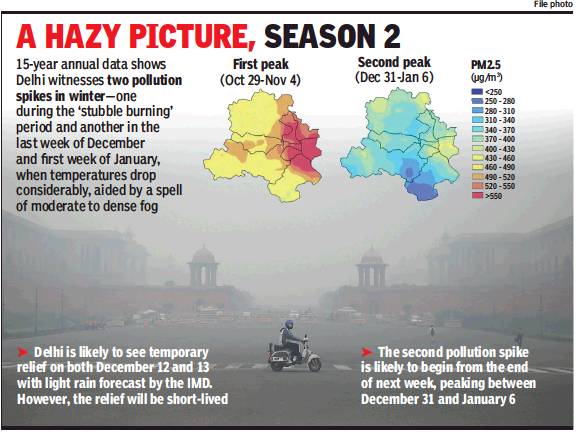
From: Jasjeev Gandhiok, August 10, 2021: The Times of India
See graphic:
The two seasons when air pollution peaks in Delhi
Diwali, 2015-20
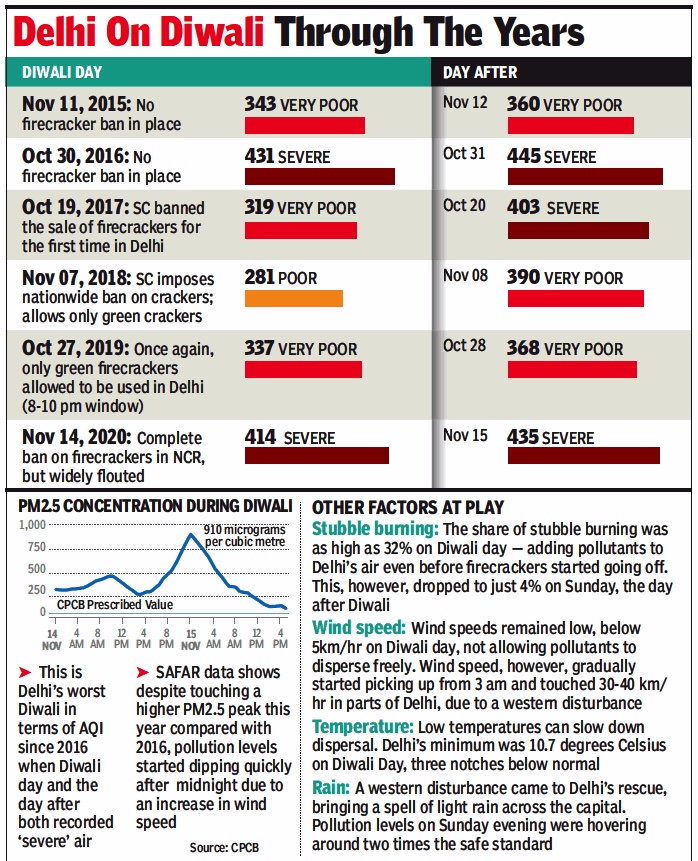
From: November 16, 2020: The Times of India
See graphic:
Air pollution in Delhi on Diwali, 2015-20
Diwali, New Year
Mohammad Ibrar, Nov 13, 2019: The Times of India
If pollution level after Diwali concerns you sorely, brace yourself for another peak pollution season. A study conducted by IIT-Delhi’s Centre for Excellence for Research on Clean Air (CERCA) has revealed that there are two peak pollution seasons in Delhi—one after Diwali and another between December 30 and January 5. The report suggests implementation of the odd-even drive twice a season among several other measures to curb air pollution.
In the study conducted for the Delhi-National Capital Region (NCR), the researchers at IIT tracked ambient PM 2.5 build-up during the dry season (October–June) by analysing 15 years (2001-02 to 2015-16) of high-resolution (1 km) satellite data. “Mean ambient PM2.5 concentrations remain more than 300ug/m3, which is five times the Indian 24-hour national standard, for several weeks around these two peak pollution episodes,” said IIT-Delhi associate professor Sagnik Dey.
He explained that the first peak is attributed to pollution transport from upwind areas affected by open biomass burning, coupled with stable atmospheric conditions, while the second is attributed to enhanced local emissions and perhaps secondary aerosol formation under favourable meteorological conditions.
“Our study indicates two peak pollution episodes in Delhi-NCR. Climatologically, the first peak occurs in the week of October 29-November 4. We attribute this peak to transport of PM2.5 from upwind crop residue burning sites under stable atmospheric condition. The second peak is slightly lower than the first peak and occurs from December 30-January 5. We associate this peak with a combination of enhancement in local emission, stable meteorological conditions, and trans-state pollution transport,” the report stated.
Dey said that because of this second pollution phase, “it is necessary that government implements certain anti-pollution measures like odd-even during December 30 and January 5 as well.”
IIT-Delhi report has called for significant efforts to design and implement policies within the entire NCR (including both urban and rural areas) to curb emissions to reduce PM2.5 exposure. “The first episode may be mitigated largely by controlling open biomass burning in the upwind states. The Government of India has recently laid out a multi-pronged strategy to address this issue, which includes incentives for in situ and on-field straw management techniques. The second episode can be curbed by reducing local emissions, either through odd-even or by introducing viable cleaner alternatives for industry and power sectors and providing clean energy for household uses, including heating and lighting,” the report said.
Nomesh Bolia, professor at IIT-Delhi and co-coordinator of CERCA, further added that while government should take measures during the second episode, “they can intensify the assessment of waste burning in Delhi-NCR during this time period to curb pollution.”
The worst (and best) areas
2020
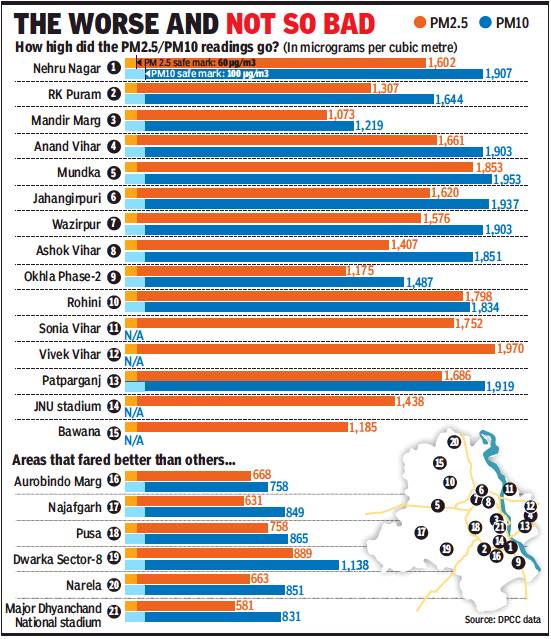
From: Jasjeev Gandhiok, November 16, 2020: The Times of India
See graphic:
Diwali 2020: the worst (and best) areas in Delhi
See also
Air pollution: Delhi
Diwali pollution
