Real estate: India
This is a collection of articles archived for the excellence of their content. Readers will be able to edit existing articles and post new articles directly |
Affordable housing
2017: 27% increase in new launches
Rakesh Malik, Affordable touches a new high, December 7, 2017: The Times of India
Incentives announced by the central government for the affordable segment have given a major boost to the realty sector
In the research report by a leading real estate research firm covering the top 8 cities of India, affordable housing sector has recorded a surge of 27 per cent in new units launched (y-oy). Post announcements by the government to incentivise affordable housing through industry status, many developers have shown interest in developing such projects. However, overall residential unit launches recorded a decline of 33 per cent, and were at approximately 60,000 units in the first three quarters of 2017 (January-September). Further, the first quarter of the year had the rollover challenges of demonetisation (November 2016) to grapple with, leaving many developers no choice but to defer their launch plans.
Affordable housing segment demonstrated strongest trends to record a 27 per cent increase in the new units launched in these cities. More than 26,000 new units have been launched in 2017 so far. Of the total new launches in affordable units, 40 per cent were in Mumbai (10,500 units), followed by Kolkata and Pune. All other categories have seen a decline with highend (-66 per cent) and luxury (-84 per cent) segments witnessing a significant drop in new launches.
With government of India’s focus on ‘Housing for All’, affordable housing segment is expected to continue its momentum. To ensure that the momentum continues, government could also explore adding a few incentives on land acquisition costs as land cost is the largest component of project costs.
FAST FACTS
>> Affordable housing refers to units measuring up to 30 square metres (in carpet area) within municipal limits of 4 metro cities such as Delhi, Chennai, Kolkata and Mumbai and 60 square metres (in carpet area) for all other locations
>> Values for mid-segment are for units in the range of ₹5-10 million, except Delhi -NCR and Mumbai where the range in mid segment housing is typically between ₹5-17 million (20 million for Mumbai).
>> High-end segment values are for units typically priced above ₹10 million, except for Delhi and Mumbai (where it is more than 17 million in Delhi and 20 million for Mumbai).
>> Top 8 cities include Ahmedabad, Bengaluru, Chennai, Delhi NCR, Hyderabad, Kolkata, Mumbai, Pune
Apartment size
2015-20

From: January 23, 2021: The Times of India
See graphic:
The average Apartment size in India’s top 7 cities, 2015-20
Builders
2012-19: consolidation

From: September 19, 2020: The Times of India
See graphic:
2012-19: consolidation of Builders, partly because of reforms.
Buying and selling
Economics of buying vs. renting, 2017
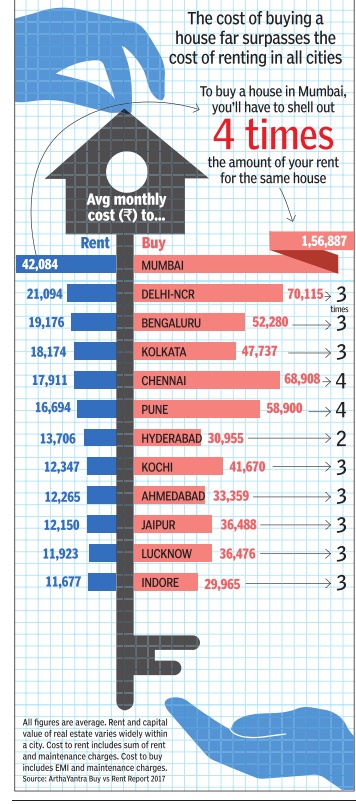
See graphic:
Economics of buying and selling, city-wise, 2017
Co-working, co-living spaces
See also Co-working spaces: India
As in 2018
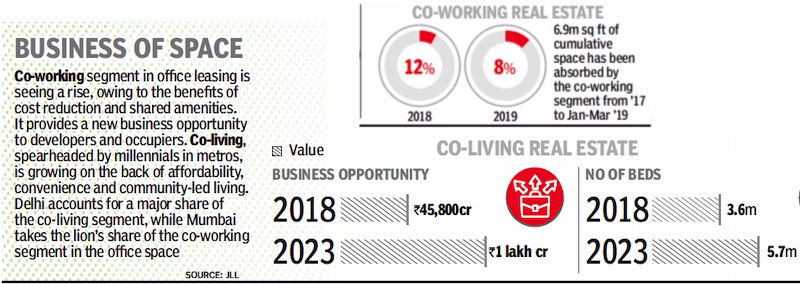
From: July 1, 2019: The Times of India
See graphic, ' Co-working, co-living spaces in India, As in 2018 '
Delays by builders
Builders can’t make approvals an excuse: NCDRC, 2018
DLF Asked To Pay ₹1Lakh/Annum For Not Meeting Deadline
A builder can’t hide behind the excuses of not getting approvals from authorities, hurdles in land acquisition or any other difficulty, for delay in delivery of flats to homebuyers, the apex consumer commission has ordered.
While directing a subsidiary of real estate major DLF to hand over houses to 16 flat buyers in one of its projects in Panchkula, Haryana, a twomember bench of National Consumer Disputes Redressal Commission (NCDRC) comprising Dinesh Singh and Dr S M Kantikar has directed the company to pay compensation of Rs 1 lakh per annum for delay and interest (home loan interest rate by banks) on the payment the buyers have already made to the builder, which will be applicable from February 2014. The builder had assured to hand over the flats by the “promised date”.
It has also directed the builder to complete the registration of sale-deeds and asked homebuyers to pay for expenses of the registration.
According to the order, which will have larger implications across the country, DLF Homes Punchkula Pvt Ltd has been directed to give the details of structural drawings and plans relating to construction, electrical, plumbing and sanitation works to the flat buyer so that he/she does not have to depend on the builder in case of any need for maintenance or repair.
The builder has been asked to pay Rs 1 lakh each to the buyers for cost of litigation. The bench observed that the builder was responsible for deficiency in service and for unfair trade practice. The NCDRC has directed DLF to deposit Rs 25,000 in each case in the Consumer Legal Aid Account of the state commission for its unfair trade practice.
“The issue involved is subjudice and we are taking legal opinion for further recourse,” a DLF spokesperson said.
The bench set four weeks for compliance. The NCDRC order came while hearing an appeal by DLF challenging the decision of Haryana state consumer commission. One D S Dhanda had booked a flat in March 2010 and the builder had signed an agreement with Dhanda in February 2011 to deliver the flat in 2013. But the deadline was extended to February 2014 due to a Supreme Court order. The bench also said cost and time overruns are builder’s responsibility and not of the consumer.
Financial crisis
2019: low profits, liquidity squeeze
Builders in top 8 cities owe lenders ₹4 lakh crore: Report, February 7, 2019: The Times of India
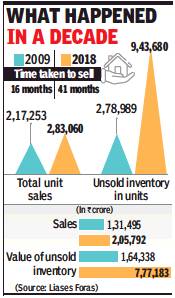
From: Builders in top 8 cities owe lenders ₹4 lakh crore: Report, February 7, 2019: The Times of India
‘Pre-Tax Earnings Of These Developers Barely ₹57,000 Cr/Yr’
Builders in top eight Indian cities owe banks and NBFCs Rs 4 lakh crore even as their total sales each year are worth just Rs 2.47 lakh crore. Real estate research institute Liases Foras, which based its report on a database of 11,000 developers, said it will take seven years to clear the outstanding amount based on current rate of earnings per year.
The annual EMI on this total loan is itself Rs 1.28 lakh crore. Moreover, the actual earnings of these developers (before interest and tax) are barely Rs 57,000 crore a year.
“IL&FS default and the ongoing speculation about DHFL have made industry stakeholders anxious yet again. Moved by the upheaval we have tried to gauge impact of the liquidity squeeze on the sector and developers,’’ said the report.
“The situation of developers is akin to an elephant in a well which is unable to come out on its own. Somebody needs to replenish the well. But can we find cheap capital to refill the well?” said Pankaj Kapoor, founder and MD of Liases Foras.
“The existing scenario signifies the industry is at an inflection point and is staring at long-due price correction in order to improve sales. But is there a scope to bring down prices?” he added.
The report said that if builders have to make a 15% profit, they have to increase their sales by 2.6 times the current levels to stay afloat.
The eight cities include Mumbai Metropolitan Region, National Capital Region, Pune, Hyderabad, Chennai, Banglaruru, Ahmedabad and Kolkata.
In the past decade, while value of sold stock increased 1.56 times, the value of unsold stock increased 4.72 times. In terms of units, volume of sales has gone up by 1.28 times, while inventory increased to 3.33 times between 2009 and 2018. In the same period, lending to the real estate sector has gone up from Rs 1.2 lakh crore to Rs 4 lakh crore.
“While debt has grown in a monumental manner and so has inventory, sales did not go up in the same proportion. Having borrowed money from different sources, new players kept coming in the market and kept adding housing stock into the market without any productivity. Since sales remained abysmal all this while, developers are finding it difficult to meet their debt obligations at this point,’’ said the report, released early this week.
The residential market generated Rs 2.40 lakh crore as yearly revenue in 2018. Of this, more than 80% of the entire business was cornered by the top eight cities (Rs 2.06 lakh crore as revenue).
“The total disposable inco-me of top 90 developers (including rental income from different properties) is Rs 23,564 crore, but the repaym-ent required is Rs 45,128 crore. Due to the gross mismatch, it seems current debt levels are not serviceable,” said the report.
House rents
Change in rents, 2012-16
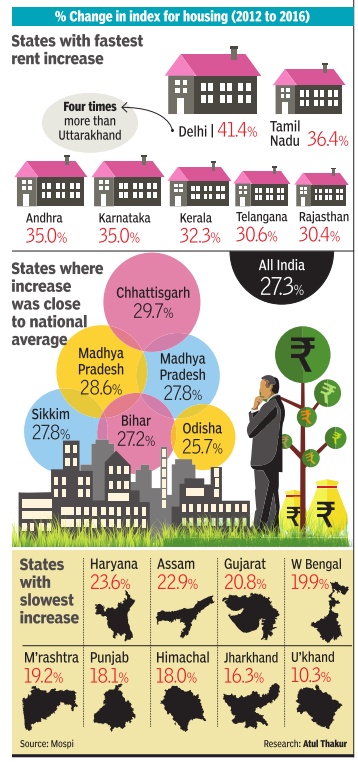
From: HOUSE RENTS HAVE RISEN THE MOST IN DELHI, LEAST IN UTTARAKHAND, Sep 17 2016 : The Times of India
HOUSE RENTS HAVE RISEN THE MOST IN DELHI, LEAST IN UTTARAKHAND, Sep 17 2016 : The Times of India
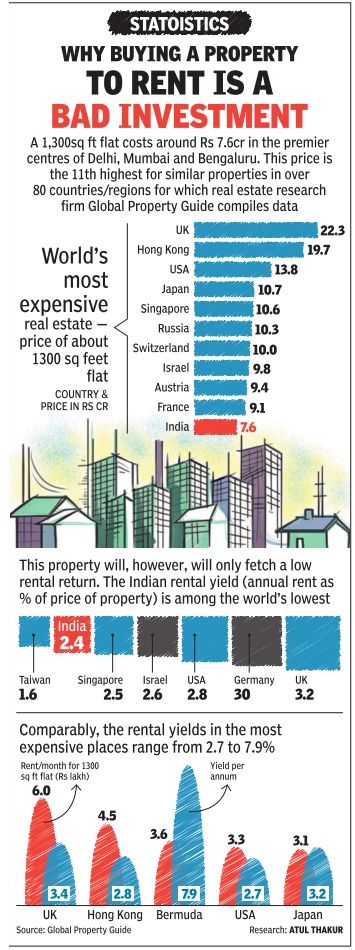
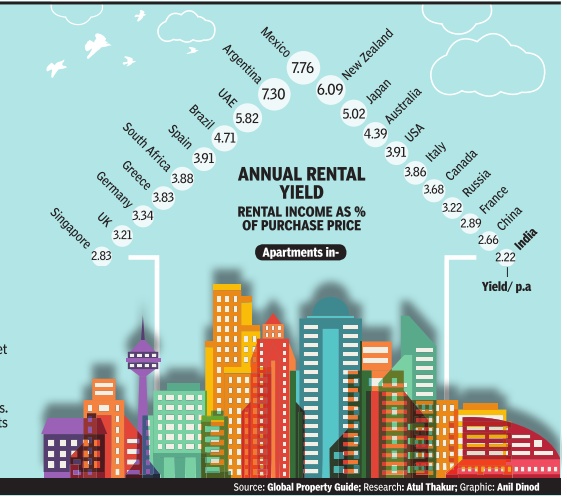
ii) The rental yield in India and other countries; The Times of India, June 13, 2017
See graphics:
Percentage change in index for housing rentals, 2012-16
The price of a 1300 sft flat in Indian metros and other countries and the rental yield in India and other countries
Recently released data on consumer prices indicates that housing cost (a proxy for rent in CPI) recorded the highest increase in Delhi, while Uttarakhand saw the minimum rise among major states. This data is for the period between 2012, the base year of the current index, and August 2016, the month for which the latest data is available
Old projects too under Rera: Gurgaon bench
The chairman of Haryana Rera’s Gurgaon bench has said the real estate law applies to all projects, irrespective of the date of completion. Which means, anyone with a grievance against a realtor can approach the Real Estate Regulatory Authority and the complaint will be taken up.
KK Khandelwal told TOI Rera can adjudicate in any dispute between a seller and a buyer in a real estate project, even if that project has received a completion certificate before the law came into effect on May 1, 2017.
Based on the central law, states have enacted and notified their own Rera rules. In Haryana — Gurgaon, in particular — buyers complained that developers were being let off the hook as the rules mentioned that those projects which had received completion certificates before May 1, 2017, would not come under the purview of Rera. The law also specifies the kind of projects that are covered — on a minimum plot size of 500 square meters and with more than eight units.
In this light, Khandelwal’s interpretation is significant, not only for homebuyers in Haryana but also other states who have had complaints about the scope of the real estate law. Haryana Rera’s other bench in Panchkula recently passed an order in favour of a buyer, Sanju Jain, who had filed a case against TDI Infrastructure for not fulfilling its sale agreement obligations. The developer had argued the project was completed before Rera came into effect and, therefore, did not come under its purview. But the Panchkula bench cited Section 11 of Rera to observe that a project’s promoter has to fulfill all sales agreement obligations, and nowhere is it mentioned in the Rera rules that only promoters of projects registered under Rera need to comply.
Investments
2009-2019

From: August 25, 2020: The Times of India
See graphic:
Institutional investments into Indian real estate (in $ bn), 2009-2019
Investment in 6 top cities doubles to $2.87 billion: 2017:
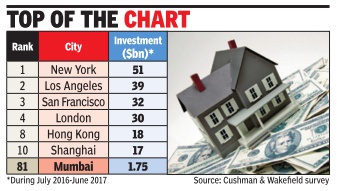
From: Prabhakar Sinha, Realty investments up 100% in top 6 cities, says survey, October 31, 2017: The Times of India
Globally, Mumbai Moves To 81st Slot From 149th 2016
With favourable changes in the legislative environment, India's six major cities -Mumbai, Bengaluru, Pune, New Delhi, Chennai and Hyderabad -have recorded 100% increase in investments in real estate sector at $2.87 billion during July 2016-June 2017, according to a survey by Cushman and Wakefield.
Mumbai, with an investment of $1.75 billion from foreign as well as domestic private equity investors, has moved up to 81st position in the global survey on rankings of cities for attracting capital from 149th slot in 2016.Also, the financial capital has witnessed highest growth among the gateway cities of the world with 194% increase in investment from $594 million in the same period last year.
New York, with $51billion investment, continues to rule the rankings of cities on the basis of investments in real estate sector followed by Los Angeles ($39.1 billion), San Francisco ($32 billion) and London ($30 billion).Shanghai, which attracted $17.6 billion investment, is placed at 10th position.
The global property mar ket witnessed 4% rise in volume to $1.5 trillion during July 2016-June 2017. Cross border real estate investments constitute 75% of total volumes.
Of the total real estate investment received by various cities in India, the largest share of over 55% came in from the North America, while domestic and regional sources saw a decline in share of capital invested in In dia, said the report. Funds from Europe, which were conspicuous by their absence during last year, were seen contributing approximately 14% of the total investment.
India's current economic position and stability in political scenario have been instrumental in creating an investment-friendly environment in the country , said the report.
Among Indian cities, after Mumbai, Bengaluru attracted $300 million, followed by Chennai ($276 million) and New Delhi ($125 million).
Anshul Jain, country head and MD of Cushman and Wakefield India, said that current economic drivers are biased towards developed markets but Indian cities are performing ahead of expectations and are offering medium to long term growth potential in real estate.
2013-18: PE flows into residential sector
Prabhakar Sinha, Residential sector sees highest PE flow in 10 qtrs, May 5, 2018: The Times of India
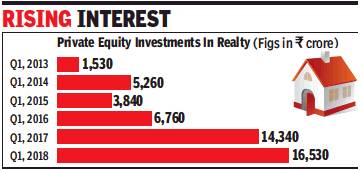
From: Prabhakar Sinha, Residential sector sees highest PE flow in 10 qtrs, May 5, 2018: The Times of India
Private equity investments in real estate sector surged 15% to Rs 16,530 crore ($2.6 billion) during the first quarter of 2018, eclipsing the inflows in the first quarters of last 11 years, according to a report by the global real estate consultancy Cushman & Wakefield. Only the December quarter of 2017 attracted higher PE investments at Rs 17,100 crore.
Private equity inflows into the residential sector more than doubled to Rs 8,518 crore in Q1, 2018, compared to same period last year, which is also the highest in last 10 quarters. The report attributed the surge in investor activity to government incentives in affordable housing. Mumbai accounted for approximately 19% of the total deals in the residential sector.
Anshul Jain, MD of Cushman and Wakefiled, said the strong inflows are a testimony to the attractiveness of the Indian real estate market for institutional investors. He said inflows into the realty sector may continue to rise over the next few years.
During Q1, 2018, office sector recorded PE inflows of Rs 6,100 crore ($940 million), a 40% decline from the corresponding quarter last year. The sharp fall in investments is due to the postponement of closure of certain notable transactions to forthcoming quarters, said the report.
Legal position and instruments
Real Estate Investment Trusts (REIT)
Blackstone likely to be India's first listed on REIT
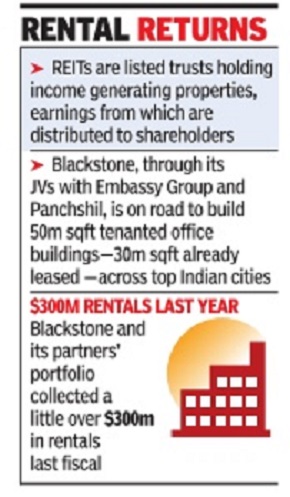
REITs are listed trusts holding income generating properties, earnings from which are distributed to shareholders. Market regulator Sebi came out with REIT guidelines [in 2014], helping real estate developers list their rent-yielding assets, and also providing large and small stock market investors with an inflation indexed product.
The world's largest private equity manager Blackstone Group, which is also the most prolific investor in Indian commercial properties, is finalizing plans to raise Rs 4,000 crore (about $600 million), through a listing of Real Estate Investment Trust (REIT) on the domestic stock exchanges, people directly familiar with the matter said. This will perhaps be India's first REIT listing and a test case for global investors who have poured big bucks into the country's rent-yielding commercial assets, especially tenanted office spaces.
Blackstone, through its joint ventures with Bangalore-based Embassy Group and Pune's Panchshil, is on the road to build 50 million sqft tenanted office buildings--of which 30 million are already leased--across top Indian cities. It could target a possible listing during the first quarter next calendar, though a decision on timing would be taken only after filing for permission with Sebi.
RERA at the Centre, and in Haryana and UP
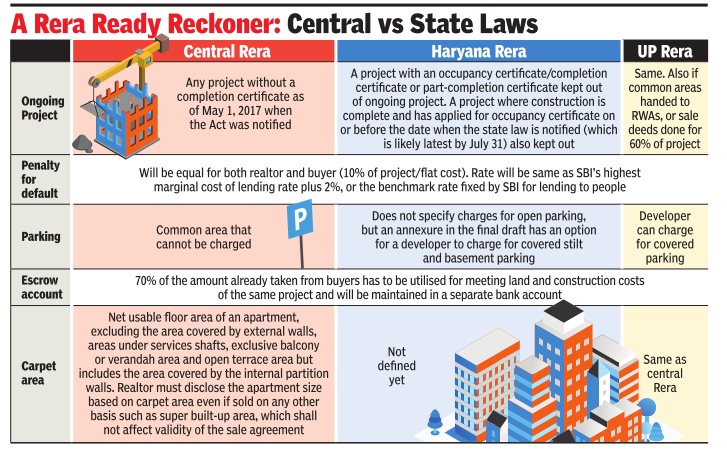
From The Times of India
Luxury homes
The main markets in 2014
Bangalore No. 1 market in India for luxury homes
While Bangalore reports sales of close to 100 luxury units — including villas — on a quarterly basis, Mumbai and NCR, in comparison, see only around a dozen such sales.
Anshul Dhamija, TNN | Apr 20, 2014 The Times of India
BANGALORE: When it comes to luxury homes — units priced above Rs 5 crore — Bangalore is setting benchmarks to emerge as the country's top luxury home market, says a report by JLL India, an international property consultancy firm.
Quality of construction, design, ventilation, floor-to- ceiling height, amenities, floor plans, building elevation and configuration aspects are among the factors fuelling Bangalore's rise to the top, the report says.
Most importantly, pricing of luxury residential properties in the country's IT capital is seen to be far more reasonable and realistic than Mumbai and NCR, says JLL's report, shared exclusively with TOI.
"Luxury properties in Bangalore are 20% to 30% cheaper. While luxury apartments that cost between Rs 6 crore and Rs 30 crore may seem exorbitant, they are in fact very reasonable when compared to the rates going in premium locations of established cities like Delhi and Mumbai," notes Om Ahuja, CEO-residential services, JLL India.
Citing research data, Ahuja adds: "A luxury apartment in Indiranagar or Koramangala is still an attainable reality with prices ranging from Rs 9,000 to Rs 12,000 per square foot. No other premium locations of other major Indian cities offer such prices in the luxury segment."
While Bangalore reports sales of close to 100 luxury units — including villas — on a quarterly basis, Mumbai and NCR, in comparison, see only around a dozen such sales.
Data shared by the consultancy firm LJ Hooker shows that Bangalore has around 5,400 luxury units under various stages of construction and planning.
After Mumbai and NCR, Bangalore is the third largest market for luxury property sales and product offerings. It is also the third largest real estate investment hub for high net-worth individuals (HNIs), but tops the list in terms of investments from NRIs looking at settling down in India.
While much of the city's luxury homes demand is fuelled by millionaires from the IT/ ITeS sectors, the demand is also being driven by Kolkata and Chennai-based HNIs. JLL estimates Bangalore to have over 10,000 dollar millionaires.
In terms of product, JLL reported that luxury residential offerings in Mumbai and NCR fall more or less in the vanilla category when compared to products in Bangalore. "In Mumbai and NCR, location aspects such as sea view or PIN code tend to define the flair and profile of a property far more than the positioning of the product in terms of luxury and design parameters," says Ahuja.
Demand across all metros for luxury residential products was subdued over three to four financial quarters, but has picked up in the past 60 days, say analysts tracking the real estate sector.
New Integrated Licencing Policy (NILP), 2015
The Times of India, Oct 24 2015
Manvir Saini
Haryana policy gives big housing a push
The Haryana government has reduced the minimum land requirement to build townships from 100 acres to 25 in its new integrated licencing policy (NILP), which it unveiled. The state expects the NILP to help energise the real estate market that has been going through a prolonged slump, particularly in NCR. The policy is applicable to high and hyper potential areas in NCR and the state capital region (SCR).
The lowering of the mi nimum land quantum for large housing projects to 25 acres also means acquisitions of this scale won't attract tough clauses of the Land Acquisition, Rehabilitation and Resettlement Act, which is applicable for acquisitions above 50 acres.
Only 12 housing project licences have been issued since the Manohar Lal Khattar-led BJP government took the reins of the Haryana government in October 2014.But the investment climate alone is not to be blamed for this. The state stopped issuing licences to builders in September 2014 when the model code of conduct for the assembly polls came into effect. The new government only resumed giving out housing licences in June.
The NILP will cover Gurgaon and Manesar, Faridabad, Ballabgarh, Sohna, So nipat, Kundli and Panchkula. The government expects it to generate a revenue of Rs 1.25 lakh crore. While unveiling the policy in Chandigarh, chief minister Khattar said he was hopeful that 2 lakh dwelling units under the affordable housing scheme would be built by 2020.
Besides bringing down the minimum area requirement for obtaining the licence, the NILP also plugs an illegal practice of developers signing memoranda of understanding (MoU) to fulfil the 100-acre cap. There had been instances in the past when builders have inked MoUs with landowners and apply for a licence.
Now builders, who want to use farmers' land for their projects, will have to sign a transferable development rights (TDR) agreement.“This will ensure that far mers or landowners will get the market price from the builder for their land. The government will be a facilitator as the custodian of farmers' interests. The TDR certificate will be valid for two years from the date of issuance,“ said Khattar.
Office space: occupancy costs (cost of purchasing/ hiring real estate)
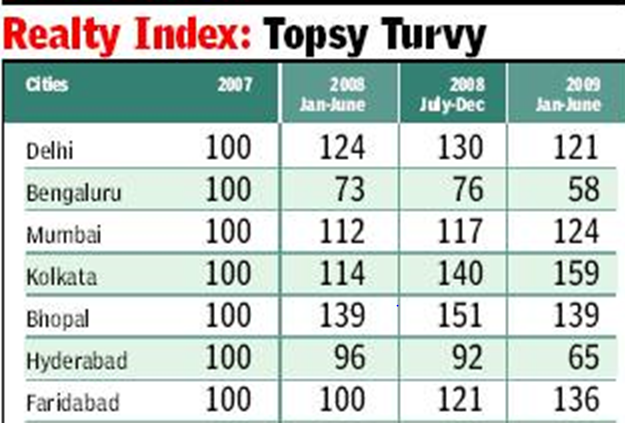
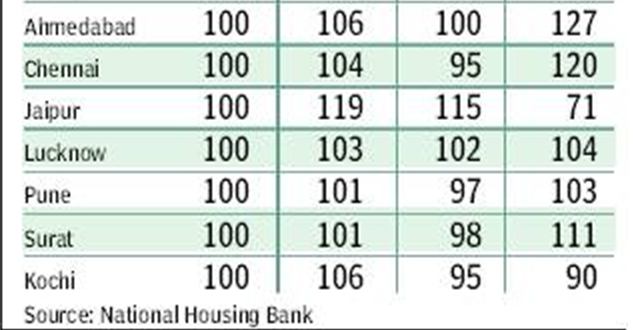
Realty index: 2007-2009
See the graphics
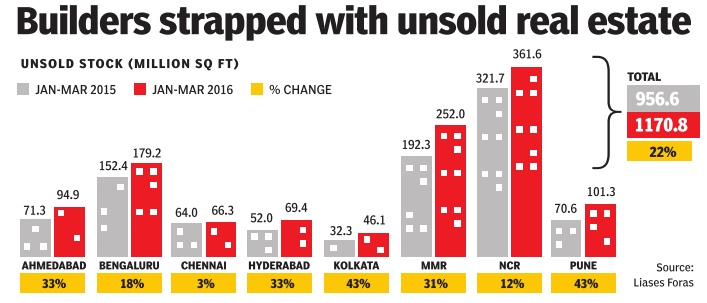
Unsold stock of real estate in India, 2015-Mar 2016
Realty index, 2007-09 A
Realty index, 2007-09 B
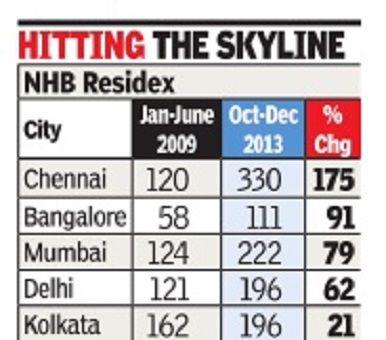
2013, NHB Residex
See the graphic, NHB Residex, 2009-13
Office space: rents and occupancy costs, March 2013
‘CP world’s fifth costliest office mkt’
TIMES NEWS NETWORK
Delhi
Despite weakening demand for office space Connaught Place remains the fifth most expensive office market in the world.
In property consultant CBRE’s semi-annual Prime Office Occupancy Costs survey, CP has retained its earlier ranking in the list of the world’s 50 most expensive office markets. The latest survey provides data on office rents and occupancy costs as of March 2013 across 133 countries.
“Though demand for office space has reduced, occupancy costs remain high, especially in Connaught Place, due to limited supply in the near future,” said Anshuman Magazine, chairman and managing director, CBRE.
Downturn, around 2014
2016: Circle rates lowered
The Times of India, June 3, 2016
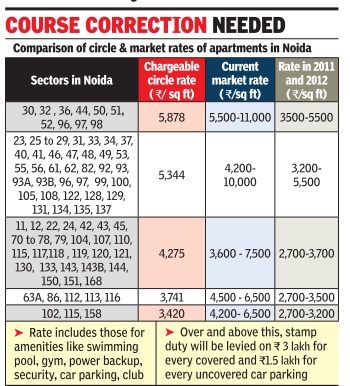
These are hard times for the real estate industry in NCR. One factor that has gnawed away at interest in buying or selling property is the unreasonable circle rates. While Gurgaon proposed a 15% cut [May 2016], circle rates there, and in most of Noida, are higher than the market rates, virtually slowing transactions to a trickle.
The property market in NCR is at its lowest ebb.Prices have either plateaued out or fallen over the past couple of years. Like any bear run, this ought to have got buyers looking for long-term returns interested. But that hasn't happened. As much as the trust-deficit has spooked in vestors, a devil hiding in the detail has further queered the sales pitch. It's called the circle rate.
By definition, circle rate is the minimum value at which a plot, house, apartment or commercial property can be sold.The rate is decided by a state's revenue department in consonance with market rates. But in hot property markets like Gurgaon and Noida, the circle rate has stopped keeping in touch with the market rate. So, while market rates depreciated due to bad buying sentiment, circle rates didn't.
What this created is an environment in which neither buyer nor seller is interested in making a transaction. Why?
Say an apartment's market price is Rs 1crore but its value, according to the circle rate, is Rs 1.5 crore. It means both the stamp duty the buyer has to pay to register the flat and the tax component of the seller will be calculated on Rs 1.5 crore, the circle rate. It's a transaction in which both parties lose.
Acknowledging this, the Gurgaon administration recently made the unprecedented proposal of cutting circle rates by a steep 15% for the 2016-17 fiscal year. The industry hopes the Delhi and UP governments will follow suit.Gurgaon divisional commissioner D Suresh said the proposal reflected the reality.
Unlike in Gurgaon, where circle rates were not revised for the last two years, Noida continued to raise them despite the gloom. Updesh Bharadwaj, a resident of Sector 72, owns a shop in a mall in Sector 18 that he wants to sell. “The market price of the shop is Rs 1.5 crore but it's Rs 2.5 crore as per the circle rate. I have been looking for a buyer for two years. But no one is interested because of the huge gap in rates,“ he said.
Gurgaon
And the gap in office realestate occupancy cost between central business districts (CBDs) such as Connaught Place and suburbs such as Gurgaon (ranked 72nd) stays wide.
Mumbai:
In Mumbai the occupancy costs in Nariman Point, the country’s first planned CBD, have reduced further. In the CBRE survey, Nariman Point dropped to 26th position at $90 per sq ft per annum. In December 2012, it had ranked 25th.
But the Bandra-Kurla Complex (BKC) retained its earlier ranking (11th) among expensive office markets, CBRE said.
CBRE analysts said the Mumbai CBD — including the micro markets of Nariman Point, Fort and Cuffe Parade — had seen office space absorption of only 8,000 to 10,000 sq ft during the quarter. Office rental values in these micro markets declined 3-4% sequentially in January-March, they said.
2014: NCR, Mumbai
Dec 31 2014
‘CP 6th costliest office location in world’
BKC and Nariman Point are among the top 50 costliest office spaces globally, according to CBRE’s survey released in December, 2014. BKC, which is the city’s alternative business district, retained its 16th rank, while Nariman Point is ranked 32nd on the top 50 list.
At nearly $160 per sq ft per annum, Delhi’s Central Business District (CBD) of Connaught Place bagged the sixth slot.
“London’s West End remained the world’s highestpriced office market, but Asia continued to dominate the world’s most expensive office locations, accounting for three of the top five markets,” said the CBRE report.
London West End’s overall prime occupancy costs of $274 per sq ft per year topped the “most expensive” list.
Hong Kong Central followed with total prime occupancy costs of $251 per sq ft, Beij ing’s Finance Street ($198 per sq ft), Beijing’s CBD ($189 per sq ft) and Moscow ($165 per sq ft) rounded out the top five.
“Although New Delhi’s Connaught Place moved up two places to the sixth spot on the global top 10 rankings over the first quarter of 2014, annual occupancy costs here remained stable because of rupee appreciation since the first quarter,“ said CBRE south Asia CMD Anshuman Magazine. Annual office occupancy costs in Gurgaon remained stable, while that of Nariman Point dropped by about 2% and BKC by about 6%. Bangalore’s CBD, which saw a nearly 9% drop, was among the top five global prime office markets to witness a decrease in yearly occupancy costs.
Global prime office occupancy costs rose 2.5% yearover-year, led by the Americas (up 4.1%) and Asia Pacific (up 2.8%).
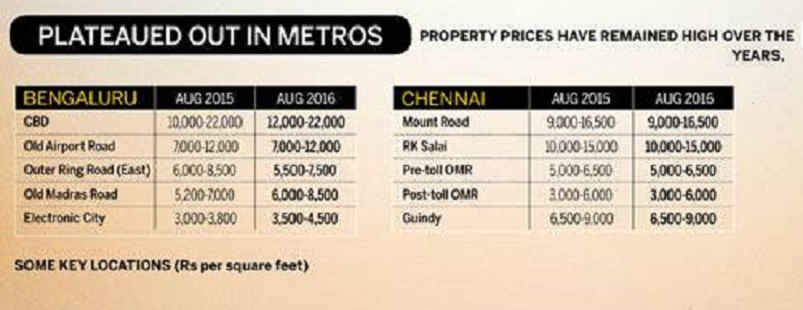
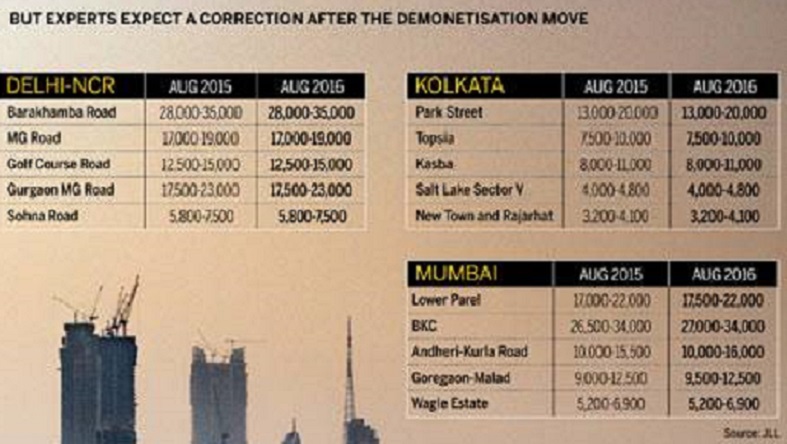
2015-16 : In the Metros
See graphics:
Property prices in Bengaluru, Chennai in 2015 and 2016
Property prices in Delhi/ NCR, Kolkata, Mumbai in 2015 and 2016
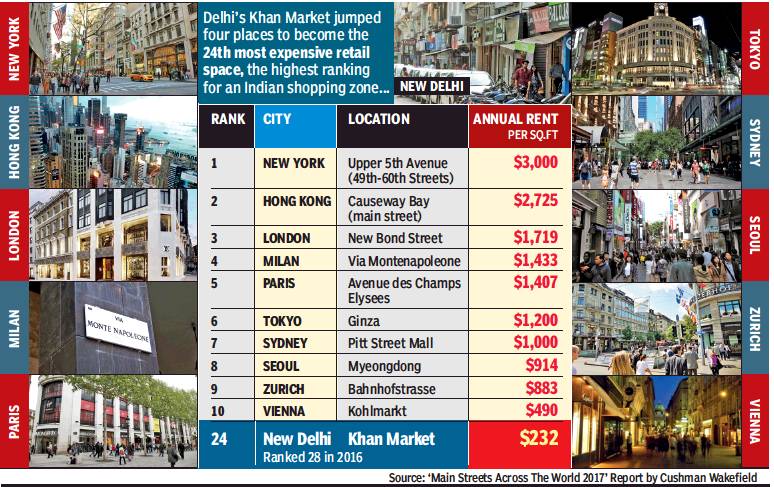
2016: Khan Market no. 1 in India, no.29 in world
From: November 24, 2017: The Times of India
See graphic:
Most expensive retail spaces, city-wise, 2017
2016: Connaught Place, BandraKurla, Nariman Point most expensive
The Times of India, Jun 16, 2016
CP world's 7th costliest office space
Connaught Place has slipped one notch to become the world's seventh most costliest office destination, according to property consultant CBRE. Mumbai's BandraKurla Complex (BKC) is at the 19th position and Nariman Point at 34th, according to CBRE Research's Global Prime Office Occupancy Costs bi-annual survey .
“With annual occupancy cost of USD 149.71 per sq ft, New Delhi's Central Business District (CBD) of Connaught Place ranks as the seventh most expensive prime office market in the world,“ CBRE said in a statement.
Hong Kong (Central) became the highest-priced office market with an overall prime occupancy costs of USD 290 per sq ft per annum, followed by LondonCentral (West End) with annual occupancy cost of USD 262.29.
2017/ Office rents, Indian cities
Knight Frank, 2017, Office rents: Mumbai, Delhi, Bengaluru among top 6
HIGHLIGHTS
Office rents in Mumbai, Delhi, Bengaluru among top 6 globally, according to a study
Global price index that compares rental values of prime office spaces across 20 international markets rose by 1.2 per cent in the quarter
Bengaluru's office rents grew by 4 per cent- highest among key CBDs in India
Healthy surge in rentals across key business districts reinstated the growing prominence of Indian metrosHealthy surge in rentals across key business districts reinstated the growing prominence of Indian metros
MUMBAI: Healthy surge in rentals across key business districts reinstated the growing prominence of Indian metros including Mumbai, Bengaluru and New Delhi on the global map of high-rent yielding commercial spaces during April-June 2017, says Knight Frank in a recent study.
According to the report, the global price index that compares rental values of prime office spaces across 20 international markets rose by 1.2 per cent in the quarter.
"Prime business districts in the three Indian metros have seen robust rental growth courtesy strong demand and limited vacancies. This scenario is expected to remain for a year owing to a supply crunch of new office space," Knight Frank India Chief Economist and National Director-Research Samantak Das said.
As per the report, sustained interest from the IT/ITes sector pushed rents in Bengaluru's business district by four per cent- the highest among other key CBDs in India.
Other established business districts such as the Connaught Place in Delhi also saw a 2.2 per cent climb in rentals, courtesy a lull in supply of new office spaces and dwindling vacancies, it said.
The Bandra Kurla Complex in Mumbai, recorded a quarter-on-quarter increase of 2 per cent in rents in April-June 2017. Vacancy levels here, however, got a boost with a fresh office supply of around 530,000 sqft in the last quarter.
"Despite the global pressures on the IT/ITes sector triggered by automation and limitation in demand for business the technology-driven Bengaluru market has performed well and it expected to do even better. But prime office assets in Mumbai and Delhi are likely to see a slower growth trajectory having already scaled high-rental values," he added.
According to it, Phnom Penh in Cambodia topped the chart this quarter with 4.2 per cent increase, Bangkok (Thailand) the erstwhile topper saw its first decline this quarter in close to three years.
JLL's report, 2017/ Delhi 7, Mumbai 16 on world’s costliest office list
Delhi 7th, Mum 16th on world’s costliest premium office list, December 25, 2017: The Times of India
From: Delhi 7th, Mum 16th on world’s costliest premium office list, December 25, 2017: The Times of India
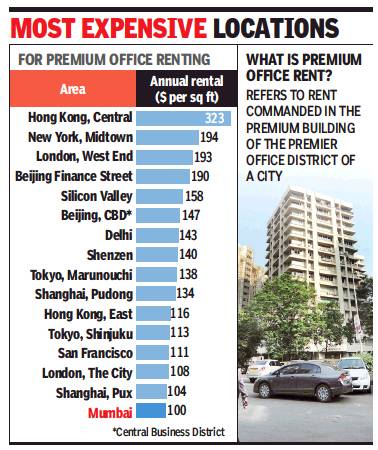
Delhi rentals are higher than cities like LosAngeles, Singapore, Paris, Seoul, Sydney, Frankfurt, Chicago and Toronto. However, Mumbai figures among the world’s most expensive locations for premium office rents, according to JLL’s latest report. While Delhi is ranked at number seven, Mumbai is ranked 16 on the list of the world’s most expensive locations for premium office rents.
The findings reveal that the mostexpensive premium office rent in the world is in Hong Kong, followed by New York, London, Beijing, Silicon Valley, Beijing again (another financial district), Delhi, Shenzen and Tokyo.
“Regionally, cities across Asia-Pacific are home to the world’s most expensive premium office spaces at an average of $111per square ft per year, which is higher than America’s ($85 psft per year) and EMEA (Europe, Middle East and Africa) at $78 psft per year,” said the report by JLL, a leading professional services firm that specializes in real estate and investment management.
Hong Kong’s Central continues to be the world’s most expensive office sub-market. “Most striking is the differential that has emerged between Hong Kong and the next most expensive cities, withcostsfor premium office space now in excess of 50% than either London or New York,” itsaid. “At$300 psft per year, total rents here set corporateoccupiers backby 70% more than for comparable buildings in New York’s Midtown or London’s West End. While six sub-markets from Asia figure in the top-10, economicdiversity also means it offers some of the world’s most competitively priced premium space, with Kuala Lumpur, Manila and Bangkok comprising the top three most affordable premium office locations.”
Premium office rent refers to the ‘top achievable’ in units with area of over 10,000 sq ft in the premium building of the premier office district of each city. The third edition of JLL’s Premium Office Rent Tracker (PORT) compares occupancy costs for premium office buildings across a broad range of major cities. PORT includes the key elements of occupancy costs—net effective rent, service charges and government tax on rent. Occupancy costs for premium buildings have continued to rise in major office markets over a year, despite many being in a latecycle phase. Costs grew by an average of 4% during 2017.
2017/ Rs 50 crore, biggest residential deal in Bengaluru
HIGHLIGHTS
Embassy Group has sold an apartment for Rs 50 crore to chairman and chief executive of engineering outsourcing company Quest Global.
Bollywood actress Deepika Padukone and some of the Infosys co-founders were among the first to invest in these branded residences.
The Embassy Group has sold an apartment for Rs 50 crore to Ajit Prabhu, chairman and chief executive of engineering outsourcing company Quest Global, making it the biggest residential deal in Bengaluru, according to people familiar with the matter.
Prabhu has bought the 16,000-sqft apartment in Embassy One, near Hebbal, which houses a 230-room Four Seasons luxury hotel, 110 Four Seasons-branded residences, 150,000 sqft of office space and 60,000 sqft of retail space. The per-sqft rate for the apartment works out to about Rs 31,000. Last year, Flipkart's Binny Bansal acquired a 10,000-sqft home in Koramangala III Block -a coveted neighborhood of self-made billionaires -for Rs 32 crore.
Prabhu, who grew up in Hubballi, divides his time between Singapore and India. He will own the yet-to-be customized apartment on the top of the South Tower, and it's the 30th floor. The first 21 floors will be dedicated to the Four Seasons hotel, and the rest will be serviced residences. Bollywood actress Deepika Padukone and some of the Infosys co-founders were among the first to invest in these branded residences. Embassy confirmed the deal, but declined to confirm the buyer. Prabhu could not be immediately reached for comment. "Sales like this bring a great sense of confidence in the market," Reeza Sebastian, head of Embassy residential marketing and sales, told.
The 1-million-sqft project, previously called City View, was originally owned by Goldman Sachs (73%) and Dayanand Pai's Century Real Estate Holdings (26%). The investment bank entered into a conditional agreement to sell it to RMZ a few years ago, but failed following opposition from its minority shareholder.
Embassy, led by its flamboyant billionaire promoter Jitu Virwani, stepped in and bought the entire project for Rs 605 crore. During this period of uncertainty, the project was hobbled by delays and ran the risk of being classified as a nonperforming asset by the State Bank of India (SBI).
Prabhu, who has made 75% of the payment, is expected to move in once the apartment is ready by the middle of 2018. Sebastian said the company has sold about 52% of the apartments. The residences will have concierge services, 24 hour valet parking, and residents will enjoy the hotel's paid services such as room service, limousines and apartment-cleaning.
2017, April-June: Housing prices increased in 36 out of 50 cities
Housing prices up in 36 of 50 cities, finds study, December 16, 2017: The Times of India
Housing prices increased in 36 cities during April-June 2017 out of 50 major citieswithVizag recording the maximum annual appreciation of nearly 16% while Delhi saw 8.1% rise, according to NHB.
The National Housing Bank (NHB) Housing Price Index (HPIs) tracks the movement in prices of residential properties on a quarterly basis, taking 2012-13 as the base year. “HPI recorded an overall increase in 36 cities, decrease in 13 cities and no change in 1 city on Y-o-Y basis,” NHB said in a statement.
All the eight Tier-1 cities witnessed a rise in indices on Y-o-Y basis with Delhi witnessing a 8.1% risefollowed by Chennai (7.4%) and Pune (6%). Of the 36 cities showing increasing trend, NHB said that the significant rise was witnessed in Vizag (15.7%), Kochi (12.8%), Faridabad
(11.7%), Surat (11.2%), Howrah
(10.2%), Raipur (9.6%) and Nagpur (9.4%).
Marginal rise in index was witnessed in Noida (0.9%), Ludhiana (1.4%) and Vasai-Virar (1.6%), while index remained stable in Greater Noida. Among the 13 cities witnessing a fall in index, Bhiwadi (-10.6%), Coimbatore (-6.6%), Chandigarh (-5.9%) and Ranchi (-5.9%) observed significant decline, the statement said.
Meanwhile, NHB’s Housing Price Index (HPI) at market prices for under-construction propertiesincreasedin 25 cities, decrease in 17 cities and no change in 5 cities on Y- O-Y basis, at the end of the quarter April-June, 2017.
Of the 25 cities showing increase in index, significant rise was witnessed in Lucknow (7.8%), Indore (7.5%), Bhubaneswar (7.5%), Guwahati (7.4%), Chandigarh
(6.6%), Raipur (6.6%) and Surat (5%).
Marginal increase in index was witnessed in 4 cities viz, Bhiwadi (0.9%), Howrah (0.8%), Navi Mumbai (0.8%) and Bidhan Nagar (0.7%). Index remained stable in 5 cities namely Ghaziabad, Kalyan Dombivali, Mira Bhayander, Pune and Vasai Virar.
2018: Mumbai
From: March 20, 2018: The Times of India
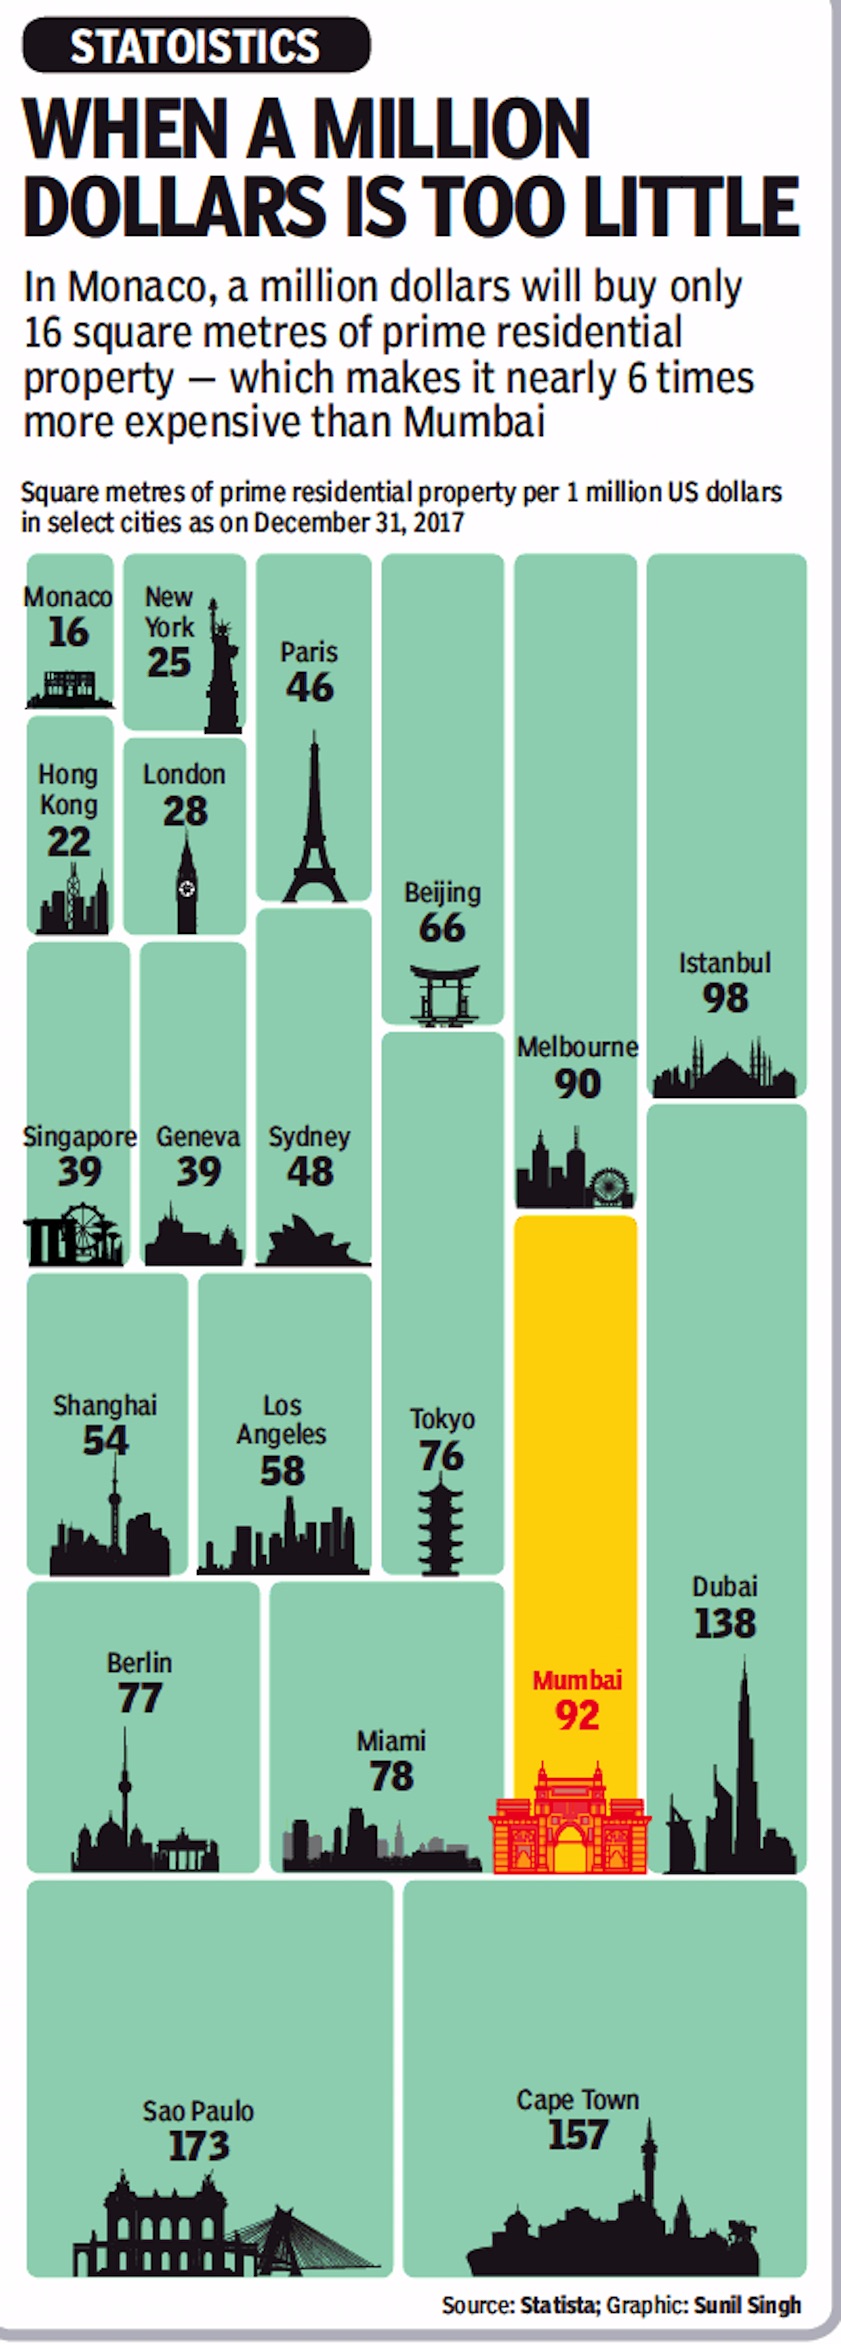
See graphic:
Mumbai and major capitals- square metres of prime residential property per 1 million US dollars in select cities as on December 31, 2017
2018: Oversupply chokes rental growth in Bengaluru
Avik Das, Oversupply chokes rental growth in Bengaluru, September 17, 2018: The Times of India
Residential rentals across the major IT hotspots of Bengaluru — Whitefield, Sarjapur Road, Electronic City and Bannerghatta Road — have remained stagnant and dipped in some places in the past one year due to abundance of apartments in the city, as per data obtained from two sources.
The data suggests the real estate market in Bengaluru — end-user centric and often called the most resilient in the country — is still some time away from regaining its health.
Rentals in the IT areas, apart from Kanakapura Road and JP Nagar, have on average gone down by 2-3% in the second quarter of the year, compared to the same period a year earlier. In several places, it has remained flat. Only a few cases have seen an uptick.
Rentals in IT areas have gone down by 2-3% in Q2 2018
Rents in Konanakunte on Kanakapura Road have shown the maximum increase — up by 9% — data from realty portal Magicbicks showed.
Rents for 2BHK in Electronic City Phase I hovered on average at Rs 18,438 in the second quarter of 2017, and currently stands at Rs 18,481. Another prime location, Kundanahalli, has seen rents dip by 1.4% to Rs 22,220. The steepest decline, about 6%, was in HSR Layout Sector 1.
Historically, rentals have gone up by an average of 5%, which is why rental contracts have a 5% annual increase built into them.
E Jayashree Kurup, head editorial and advisory in Magicbricks, said rental yields are expected to remain stagnant till the city’s housing market reaches a stage where the existing and new rental housing stock (by way of fresh construction) is close to demand for rental housing. Rentals in upcoming areas such as those beyond KR Puram flyover have failed to go up. Data from property consultancy Silverline Realty shows rents on Old Madras Road have remained stagnant, though they are significantly lower than in the IT hotspots nearby. Average rentals there are about Rs 17,000 for a 2-BHK compared to Rs 30,000 in adjoining Whitefield.
Sales, too, have not been great. Units sales rose just 2% to 13,382 units in the first six months of the year, compared to the same period in 2017, data showed.
…but it is the largest office market in APAC
Avik Das1, Bengaluru is largest office market in APAC, April 12, 2019: The Times of India
From: Avik Das1, Bengaluru is largest office market in APAC, April 12, 2019: The Times of India
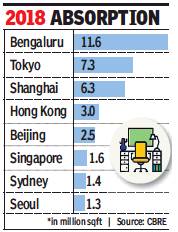
Bengaluru is the largest office market not only in India, but also by far the biggest in the Asia-Pacific region.
India’s Silicon Valley absorbed 11.6 million sqft of office space last year on a net basis (taking account of vacated space), compared to Tokyo’s 7 million, Shanghai’s 6 million, Hong Kong’s 3 million and Beijing’s 2.5 million, according to estimates by property consultancy CBRE.
Bengaluru has held this position for the past few years as more global companies set up captive technology and back-office centres, attracted by the city’s talent. Traditional IT companies and domestic new-age ventures have also taken significant space.
“One of the benchmarks of Bengaluru’s broader growth as one of Asia-Pacific’s most dynamic commercial real estate spaces is its embrace of agile real estate strategies,” said Anshuman Magazine, chairman & CEO of CBRE India, South East Asia, Middle East & Africa.
Agile real estate strategy refers to flexible workplaces and portfolios that can quickly adapt to meet the changing needs of individuals and the organisation. “We have been seeing consistently that clients are looking to set up or consolidate their operations in large integrated parks across the city, which has resulted in such a huge demand,” Michael Holland, CEO of Embassy Office Parks, told TOI last year. Embassy is one of India’s biggest office space providers.
Realtors/ agents
‘95% of realtors in 12 states without PAN’
Pradeep Thakur, ‘95% of realtors in 12 states without PAN’, February 13, 2019: The Times of India

From: Pradeep Thakur, ‘95% of realtors in 12 states without PAN’, February 13, 2019: The Times of India
After CAG Audit, I-T Dept Too Fails To Verify Returns
A performance audit on the real estate sector across 12 major states in India by the Comptroller and Auditor General has revealed that 95% of the 54,578 developers, builders and real estate agents registered with the registrar of companies (RoC) did not have mandatory PAN number.
A cross verification with the income tax department could not establish if these companies were filing their income tax returns.
In a report tabled in Parliament on Tuesday, the federal auditor has found that not a single developer/builder or real estate agents in as many as seven states have PAN numbers.
They include West Bengal where of the total 20,893 companies registered with the RoC not a single one has PAN. Uttar Pradesh has 7,849 companies without PAN registered with the RoC. Among other large states where not a single real estate company has declared PAN, include Bihar, Gujarat, Odisha, Rajasthan and Uttarakhand.
The findings are significant in view of recent cases of large real estate developers found having siphoned off home buyers’ money to personal ventures. An investigation under the Supreme Court supervision on Amrapali had revealed that the builder had diverted over Rs 3,000 crore of home buyers funds to different projects.
Another big builder, Jaypee Infratech, has defaulted in delivering 30,000 homes for more than seven years and has been undergoing insolvency at present.
“RoCs did not have information about PAN in respect of 51,670 (95%) of a total of 54,578 companies for which data was made available to audit,” CAG noted, and observed that it was difficult to ascertain whether these companies were in the tax net of the income tax department, except in Andhra Pradesh and Telangana where it could identify PAN in respect of 147 of these companies. The audit was conducted in the real estate sector with the objective to ascertain whether all the developers/builders and real estate agents are in the tax net and are filing income tax returns.
“ There is no mechanism with the I-T department to ensure that all the registered companies have PAN and are filing their returns regularly,” CAG said.
2017> 19: rising demand, inventory declines

From: June 29, 2019: The Times of India
See graphic, '2017> 19: rising demand, inventory declines '
YEAR-WISE TRENDS
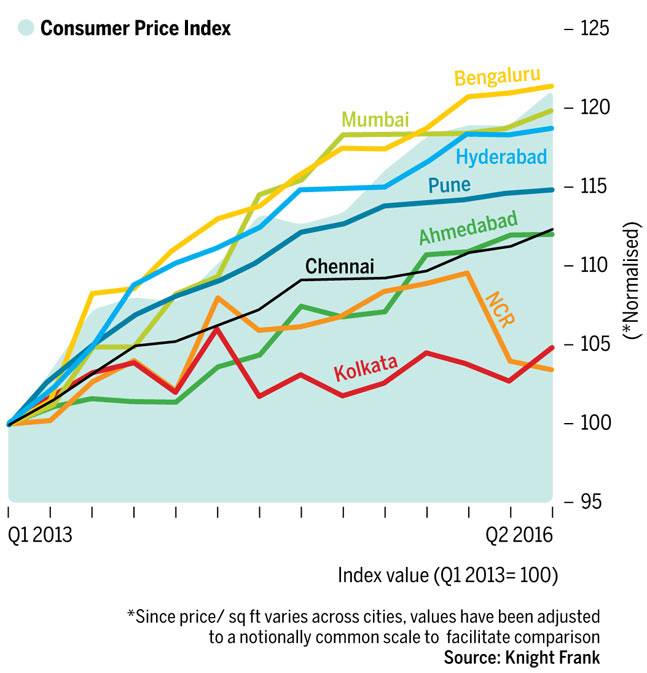
2013-16/ Stagnant growth in Bengaluru
M.G.Arun & Shweta Punj , Realty Check "India Today" 28/11/2016
See graphic
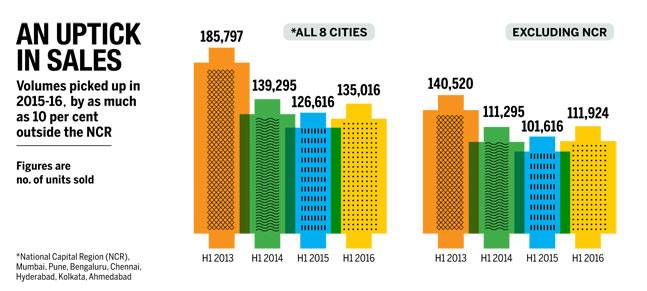
Sales & Growth: NCR ,Mumbai ,Pune ,Bengaluru ,Chennai ,Hyderabad ,Kolkata ,Ahmedabad
M.G.Arun Shweta Punj , Realty Check “India Today” 28/11/2016
See graphic
2017
Housing sales down 26% in NCR in first half
Housing sales down 26% in NCR in first half of 2017|Jul 06 2017 : The Times of India (Delhi)
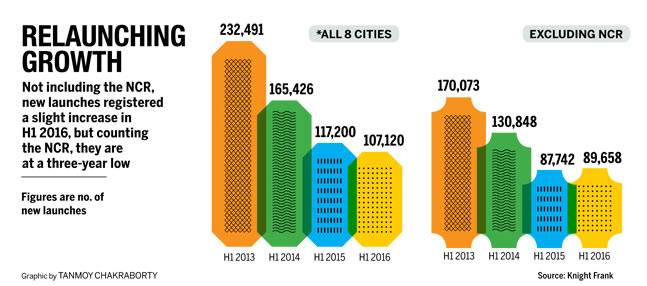
New Delhi PTI Housing sales fell 26% in Delhi-NCR in the first half of 2017, as demand continued to be sluggish postdemonetisation, despite a price correction of 20% in the last 18 months, according to international property consultant Knight Frank.
Unsold housing stock in the Delhi-NCR property market stood at 1.8 lakh units -highest in the country -that will take developers four-anda-half years to sell. About 17,188 units were sold in the first half of 2017, compared to 23,092 units in H1 2016, Knight Frank India said. Housing sales did improve marginally by 2% from the previous six months, which saw lowest half yearly sales due to demonetisation move.
“NCR market continues to find newer depth and slide continues. NCR housing market is passing through the worst phase. No end to it,“ Knight Frank India Executive Director (Advisory , Retail and Hospitality) Ghulam Zia told reporters.
The consultant released latest report `India Real Estate Residential and Office' for January-June 2017 tracking eight top cities in the country.
On launches, Zia said it hit a “new low“ and fell by 73% in the first six months of this year at 4,800 units, 70% of which were below Rs 25 lakh, signalling shift towards affordable housing segment.
He attributed the fall in launches to demand slowdown and builders' focus on completing existing projects in view of the new Real Estate (Regulation and Development) Act.“Dwindling consumer confidence in the market courtesy delay in projects marred by litigations and poor connectivity in potential growth areas has slowed the market. That slowdown has restricted developers to launch new projects,“ the report said.
2017: Sales in Bengaluru, NCR Delhi, Chennai fell 26%, 6%, 20%
Prabhakar Sinha, ‘Demand poor, homes get cheaper’, January 11, 2018: The Times of India
From: Prabhakar Sinha, ‘Demand poor, homes get cheaper’, January 11, 2018: The Times of India
From: Prabhakar Sinha, ‘Demand poor, homes get cheaper’, January 11, 2018: The Times of India
NCR Sales Fell 6% In 2017, Says Report
Residential real estate prices fell across the country in 2017 due to demonetisation, the implementation of the Real Estate Regulation Act (RERA) and goods and services tax (GST).
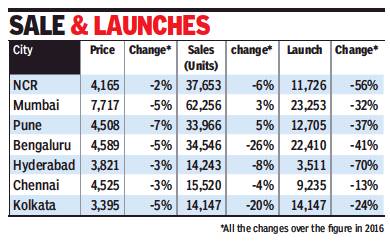
According to a Knight Frank report, prices fell by an average of 3% across cities, with Pune witnessing the highest decline, 7%, followed by Mumbai at 5% in 2017. Prices in the NCR, which had already fallen in the last six years, dropped another 2% on average.
The main reason for the fall is poor demand. Sales in Bengaluru, NCR Delhi and Chennai fell sharply — 26%, 6% and 20%, respectively. However, the Mumbai and Pune markets witnessed a slight upward movement. The report pointed out that as RERA had been implemented properly in Maharashtra, sales had picked up in Mumbai and Pune by 3% and 5%, respectively.
Because of slow sales, launches witnessed an unprecedented slowdown during the year. New launches fell by 56% in NCR Delhi and by 41% in Bengaluru. This has affected the sector badly.
NCR witnessed 6% lower sales at 37,653 units while prices fell by 2% due to a slowdown in demand and the impact of new realty law RERA and GST, said property consultant Knight Frank India.
The report also pointed out that that the share of affordable homes among new launches rose from 53% in 2016 to 83% in 2017, indicating developers' focus on properties within the Rs 50 lakh price bracket. The main reason for the launch of affordable housing is the huge demand in the segment and the subsidies under the Prime Minister Awas Yojana.
In fact, if compared to real estate activity in 2010, it is very bad. “By the end of 2017, the residential sector had shrunk to a fraction of its size in less than a decade. Nevertheless the nearstandstill triggered by the note ban seems to have tapered with time,” Knight Frank India chairman Shishir Baijal said.
In 2010, India had witnessed the launch of 4.80 lakh apartments; in 2017, the number is 1.03 lakh. At the same time, sales plummeted from 3.61 lakh apartments to 2.28 lakh.
However, RERA has provided a silver lining. “Select markets wherein Rera has matured have seen developers re-launch projects at attractive prices, which led to an uptick in sales in 2017... It’s a buyers’ market today and we hope the momentum holds steady...,” Baijal said.
2018
Unsold flats
Prabhakar Sinha, At 1.5L, NCR records max number of unsold flats, March 6, 2018: The Times of India
From: Prabhakar Sinha, At 1.5L, NCR records max number of unsold flats, March 6, 2018: The Times of India
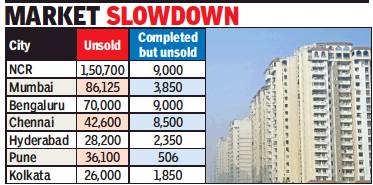
At 1,50,700, the national capital region (NCR) has the highest number of unsold residential units among the leading cities in the country, reveals a survey conducted by real estate consultancy firm JLL. Overall, these cities, including NCR, Mumbai, Bengaluru, Chennai, Kolkata and Pune, have an inventory of around 4.40 lakh unsold units.
While Chennai is on the top of the completed unsold housing units with around 8,500 units (around 20%) out of 42,600 unsold units, in NCR, only 6% — around 9,000 units — of the unsold units are ready.
The unsold inventory of completed units is estimated at 35,000 units in the top cities. Ramesh Nair, CEO & country head of JLL India, said a significant volume of unsold inventory would ensure that the capital values across most markets would stay buyer-friendly to ensure sales velocity.
With a slowdown in project launches in most markets, more unsold units are likely to get absorbed in the next few quarters. As a trend, end-users have been more inclined to buy a unit as it reaches closer to the date of completion. This has also incentivised the developers to complete a project to improve cash flow.
However, there are fewer buyers for incomplete projects, creating a downward bias in most markets. “From the beginning of 2016, the sector has witnessed changes like RERA, Demonetisation and GST, which have also led to a general slowdown in overall construction activities,” Nair said. Demands, too, have become slow following these changes. “We expect sales velocity to start picking pace in the second half of the year mostly on account of stable prices, making entry attractive,” he added.
In NCR, Noida and Greater Noida together contributed nearly 60% (around 90,000 units) of the total unsold inventory, mostly in incomplete projects. The survey said most of the sales are happening closer to completion, leaving only a minimum percentage of completed unsold inventory at only 5,600 units, 6.5% of total unsold inventory in the twin cities.
Gurgaon saw only limited unsold inventory — largely in incomplete projects at peripheral locations. At 850, less than 4% of the unsold units are ready.
In Greater Mumbai, Thane saw the lowest volume of unsold inventory with approximately 12,500 units — almost entirely under construction — and 163 in the completed category. Thane has been seeing strong traction among endusers due to high quality of construction, ease of commute and a general upgrade of social infrastructure which has been proportionate to the growth of the location, the report said.
Navi Mumbai, on the other hand, recorded over 24,000 unsold units, of which over 10% (2,650) are in the completed projects. Most of these projects are in the peripheral locations of Kharghar and Panvel, which are mostly investor-driven markets. Mumbai city has recorded close to 50,000 unsold units, mostly in the underconstruction projects. Around 150 units are complete but unsold.
Bengaluru, which recorded nearly 70,000 unsold units, has seen an influx of new launches in 2017 backed by a strong and stable economic condition. Even then, 13% of its completed units remain unsold.
2019
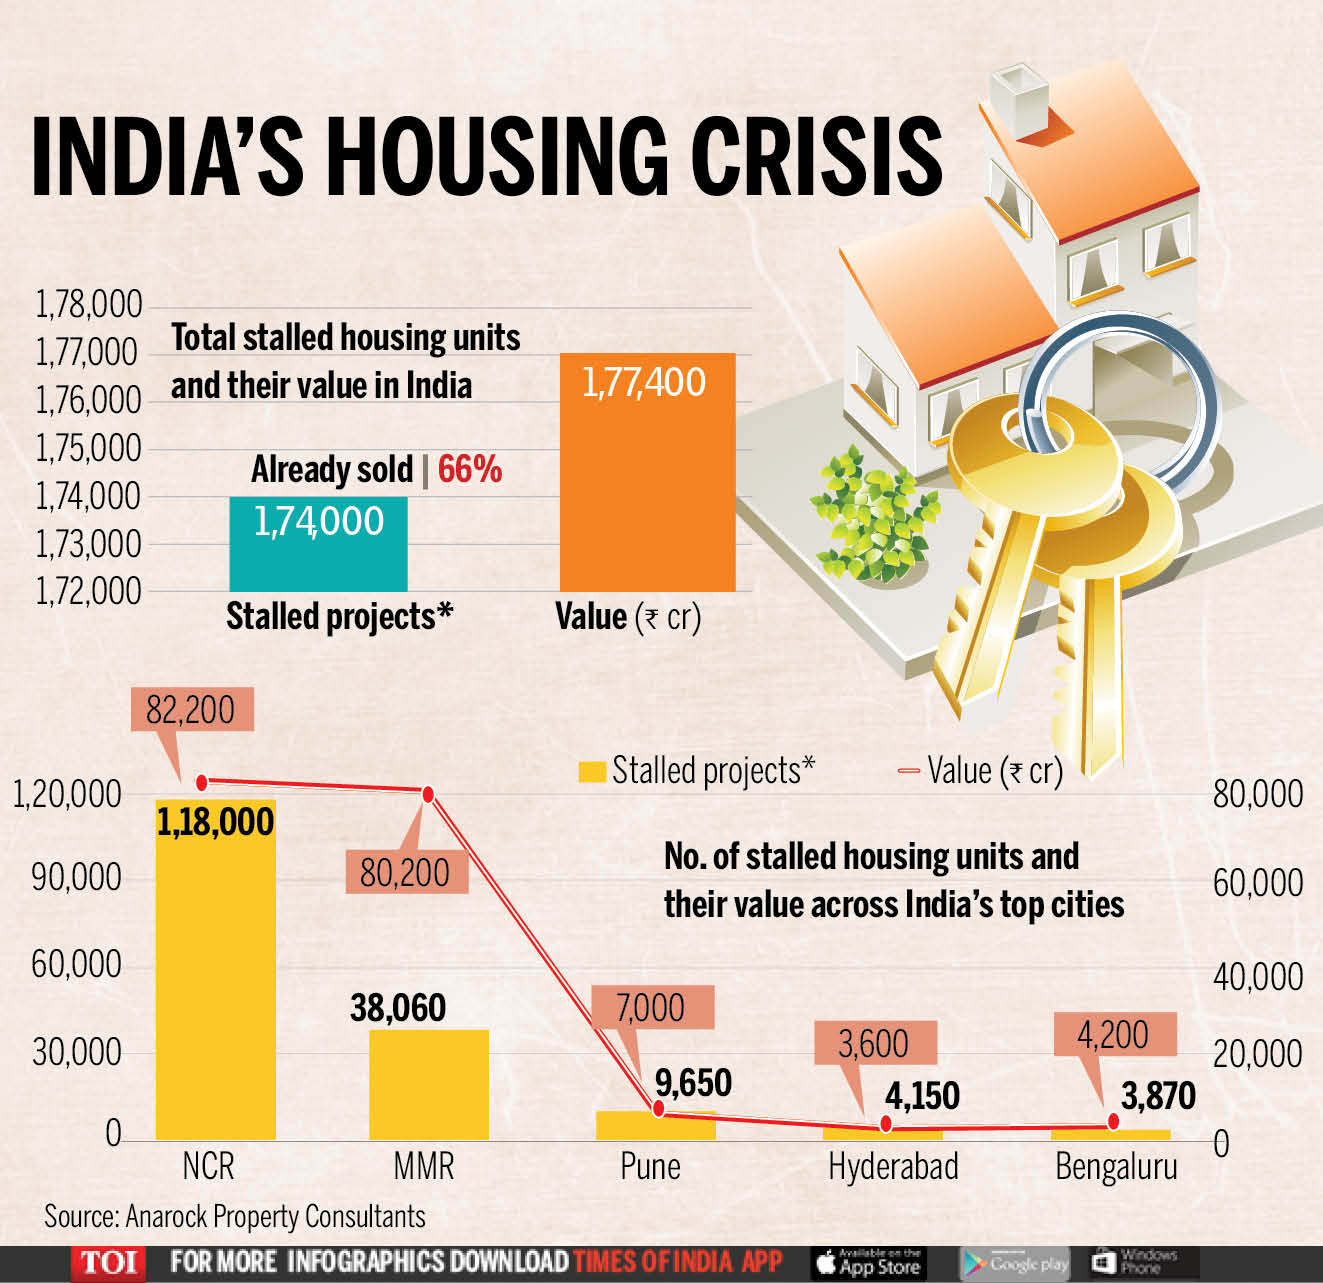
2019: 220 realty projects stalled in 5 cities
August 28, 2019: The Times of India
From: August 28, 2019: The Times of India
1.74L houses worth Rs 1.8Lcr stalled as 220 realty projects take a hit
As many as 220 projects — equaling 1.74 lakh homes worth Rs 1.8 lakh crore — are completely stalled in India’s top cities. Almost 66% of these (1.15 lakh homes costing Rs 1.1 lakh crore) have been sold to buyers who are now left in the lurch. These projects have absolutely no construction activity going on, with most being grounded due to either liquidity issues or litigations. Affected homebuyers now see a glimmer of hope with the Supreme Court’s intervention in the Amrapali case.
See also
Housing and urban affairs: India
National Capital Region (India): Shelter
Real estate: India
