Cities of India: the best and the worst
This is a collection of articles archived for the excellence of their content. Readers will be able to edit existing articles and post new articles directly |
Best overall
India Today Best Cities study: 2014
As India increasingly shifts to its cities, the dominance of the south remainsunchanged
Kaushik Deka
November 20, 2014
The urban population in India is growing at such a rapid pace that by 2020, 35 per cent of the country's total population is expected to live in the cities; the projection is 50 per cent by 2050. According to a 2010 McKinsey Global Institute report, India's urban population will grow from 340 million in 2008 to 590 million in 2030. So the big question is: are Indian cities equipped enough to deal with this population explosion? How liveable are our cities?
The India Today Best Cities study is an ambitious attempt to find the answer. The first version of this annual exercise last year examined 30 capital and metro cities and 20 emerging cities on 11 parameters- overall, economy, housing, transport, public services, healthcare, education, crime and safety, entertainment, environment and investment. This year, we have added one more category-cleanliness.
However, what has remained unchanged is the dominance of south Indian cities. Chennai remains unchallenged as the top capital city while Coimbatore displaces Vadodara as the best emerging city in the overall category.
Across the 12 categories, Hyderabad and Chandigarh are the two capital cities which appear among the top five ranks in six categories, the highest, followed by Mumbai and Chennai in five categories each. The Union Government has announced a grand plan to create 100 smart cities. While chalking out the policy road map, the Government might as well pay attention to a worrisome trend that has emerged from the two India Today Best Cities studies-the uneven distribution of urban development. The winners this year come from just nine of the country's 29 states.
Civic systems
Ranking: 2014
Delhi 5th in India, way behind world
New Delhi: TIMES NEWS NETWORK
The Times of India Jun 07 2014
Survey Ranks It Low For Lack Of Politically Representative Civic Systems And Transparency
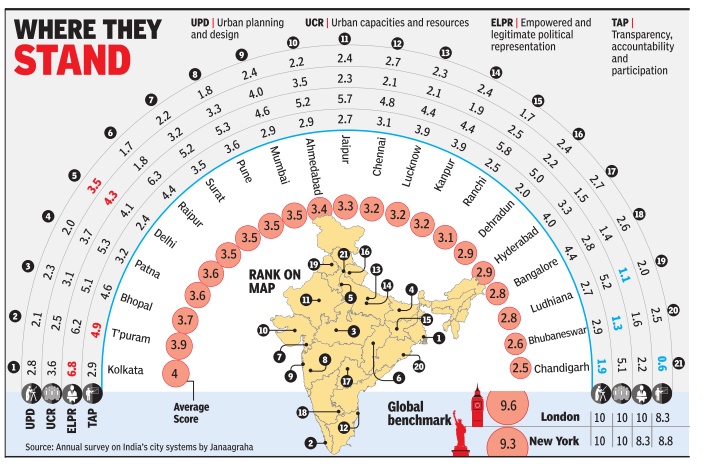
It’s not a patch on the likes of New York and London, but the bad news is that Delhi even trails other Indian cities in terms of civic systems. A survey by Bangalore based Janaagraha Centre for Citizenship and Democracy has ranked it fifth behind Kolkata, Thiruvananthapuram, Bhopal and Patna.
The annual survey evaluates the performance of 21 cities, including 18 state capitals, on four parameters: urban planning and design (UPD), urban capacities and resources (UCR), empowered and legitimate political representation (ELPR), and transparency, accountability and participation (TAP).
Although Delhi leads Indian cities in urban planning and urban capacities, which includes budget and staff strength, it lags in terms of political representation and accountability. Janaagraha claims some audit queries on financial and project related discrepancies are pending in Delhi since 1964—50 years.
“Imagine if this were a company instead of a city, it would have been immediately delisted from the stock exchange,” said Ramesh Ramanathan, co-founder, Janaagraha. Delhi also has error rates of more than 20% in its municipality election voter list.
Delhi with a large staff strength of 140,000 and Mumbai with a huge budget of Rs 30,000 crore have mayors with terms of one year and 2.5 years, respectively . Delhi does not have a public disclosure law, neither do Kolkata, Ahmedabad and Chandigarh. Thiruvananthapuram is the only city to have a local body ombudsman to resolve inter-agency disputes which often slow down projects.
And unlike Ranchi and Patna, Delhi does not have independent external auditors (a panel of chartered accountants). All these facts have gone against Delhi.
While the benchmark cities, London and New York, have average scores of 9.6 and 9.3 (on 10), all Indian cities have scored in a range of 2.5 to 4. Chandigarh, famous for being a planned city, has slipped to the bottom with 2.5 points for coming up short on contemporary planning needs, public disclosure and a community participation law.
Delhi also has some catching up to do with major cities in the developing world. It has 1.4 lakh civic employees for a population of 1.7 crore while Sao Paulo in Brazil had more than 1.7 lakh employees in 2004 for a smaller population. Mexico City has one of the most “open” or accessible municipalities while Delhi doesn’t even have a citizen’s charter.
On the brighter side, Delhi is the only Indian city to have legal provisions of decentralization to a local level in its town and country planning Act. The other cities have archaic plans, with Hyderabad following an Act that was drafted in 1920. Delhi is the only Indian city with ward-level spatial development plans and has scored 3.8 for planning but zero for implementation.
Smaller cities have better and relatively newer legislations compared to the bigger cities, hence Thiruvananthapuram, Bhopal and Raipur find a place in the top 10.
Janaagraha benchmarked the 21 cities on 83 questions covering 115 parameters.
Mumbai has better `civic sense' than Delhi
Subodh Varma, April 21, 2017: The Times of India
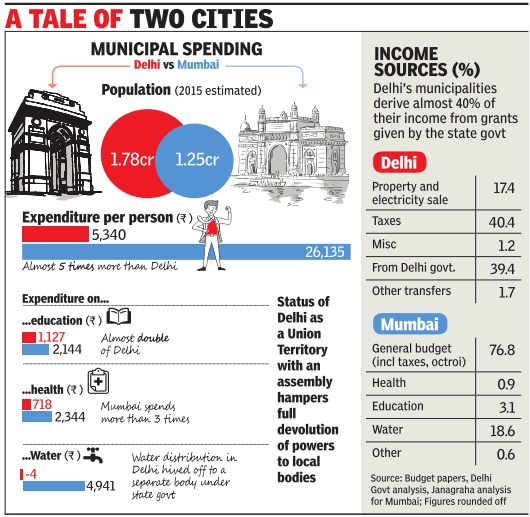
The scorching heat of an early summer in the capital is somewhat being tempered by expectation that life might become better after the municipal polls on April 23, given the cool election promises being made by the contending parties. Not surprisingly , however, none of the parties is revealing where it will find the funds to back the generous assurances. The reality , as Delhi's citizens know well, is that the three municipal corporations are hamstrung by a chronic cash crunch that has forced employees into striking work over delayed salaries, foiled attempts to check outbreaks of dengue and other diseases and left civic services in a shambles. With a cumulative budget of Rs 9,551 crore in 2014-15, the three municipal bodies spent an average of just Rs 5,340 per person in a year. Nearly 40% of the money went into paying civic employees and corporators, and to meet general administrative expenses. Sanitation activities, like collection and disposal of garbage, and cleaning of drains, accounted for just Rs1,258 per person. Healthcare, including running dispensaries and conducting disease prevention programmes, came for even less at Rs758 per person.
Compare this with the spending of Greater Mumbai Municipal Corporation, the country's richest municipal body with an annual budget over five times that of Delhi. It spent three times more on health and two times more on the education per person. Remember, the population residing in Mumbai's municipal area is considerably less than in Delhi.
How does Mumbai manage to generate more income? Can't Delhi do the same? Of course, Delhi's status as a Union territory with an assembly hampers full devolution of powers to local bodies, unlike in the case of Mumbai.Octroi, development charges and property tax are the main sources of revenue for the Municipal Corporation of Greater Mumbai. Delhi's municipalities derive almost 40% of their incomes from grants given by the state government.Water distribution is a significant source of income in Mumbai, but in Delhi this has been hived off to a separate body under the state government.
In short, for the municipalities in the capital to become resource rich, either the whole set-up in Delhi needs to be changed or more grants will have to be given to them. This crucial fact, of course, doesn't exercise the minds of the political leaders out wooing the voters.
Cleanliness
Small cities put metros to shame
Mahendra Kumar Singh | TNN
New Delhi: They may not have the glamourous tag but when it comes to cleanliness and sanitation, smaller cities like Chandigarh, Mysore, Surat, Tiruchirapalli and Jamshedpur have beaten the metros in the sanitation ratings released by the Union urban development ministry on Monday.
Not surprisingly, Chandigarh is on top, followed by Mysore, Surat, New Delhi Municipal Council area and Delhi Cantt in the top-five list of civic areas graded by independent agencies appointed by the ministry.
Cities like Tiruchirapalli, Jamshedpur, Mangalore and Rajkot fall in the top 10 list out of 441 cities and towns with a population of more than one lakh subjected to the test.
What could surprise many, Kanpur, once a major industrial city and considered quite polluted, ranked 10th in the list. With an ambitious task of 100% sanitation, the ministry took up the rating exercise with the objective of promoting safe sanitation in around 400 cities and towns across the country. Though Municipal Corporation of Delhi (MCD) could not make it to the list of top 25 released by the ministry, metropolitan areas — Navi Mumbai, Bangalore and Chennai — got the 11th, 12th and 13th rank, respectively. Kolkata could manage the last rank in the list of top 25 cities and towns.
Cities and towns have been rated on parameters such as complete elimination of open defecation, elimination of open scavenging, safe collection and disposal of total human excreta. On basis of the rating, cities are been classified as Red, Black, Blue and Green which would denote increasing level of achievement of good environmental and health outcomes.
The overall sanitation standard in cities and towns in the country was reflected in the fact that not a single city could achieve the top most classification of Green, while only four — Chandigarh, Mysore, Surat and New Delhi Municipal Council area — could find a place in second best classification of Blue.
Though the ministry did not release the list of the worst (Red) category, only 25 cities and towns out of 441 could find place in the Blue and Black categories.
The Capital’s neighbouring township of Noida could manage the 17th rank while Ahmadabad achieved the 19th place. Haridwar got the 21th rank and Vijaywada 24th in the list.
Releasing the rating, urban development minister S Jaipal Reddy hoped that some cities would reach the top most Green classification soon. He said the rating exercise for class I cities and towns was undertaken in order to sensitize the states and cities as well as citizens about the current state of sanitation and raise awareness about the need for improvement.
Climate/ weather
Most comfortable weather
IIT finds city’s comfort zone
Four-Year Study Calculates Hours Of Comfortable Weather
Jayashree Nandi TNN
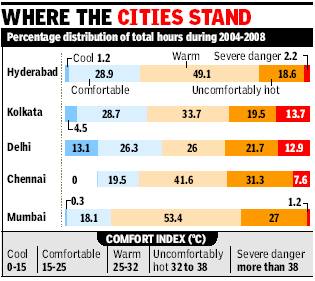
New Delhi: Extreme summers and winters in Delhi are clearly uncomfortable. But Indian Institute of Technology (IIT) Delhi has calculated the percentage of hours when most Delhiites may be finding the weather to be “comfortable”. In a recent study, IIT’s Centre for Atmospheric Sciences (CAS) has ranked five cities on the basis of “comfortable hours”. Hyderabad has the highest comfortable hours, followed by Kolkata, Chennai, Delhi and Mumbai in the descending order.
The idea of which temperature range is comfortable is based on a comfort index defined by Saskatchewan weather station in Canada that considers 15 to 25 degrees comfortable while 25 to 32 degrees warm. The index, according to IIT scientists, is suited for Indian cities too. Comfort index means hours that fall under temperature, humidity and wind speed conditions that is optimum for people to carry out light to moderate physical activities without being affected by the weather. The CAS team assessed temperature and other weather data for the five cities from 2004 to 2008 and then graded them under five categories — cool, comfortable, warm, uncomfortably hot and severe danger.
The analysis found that 70% of the time all the five cities were uncomfortable. For instance, Hyderabad —which ranks highest as per the comfort index — had only 28.9% of the time in the comfortable category but 18.6% of the time in the uncomfortably hot category. Delhi had a whopping 12.9% of time in the severe danger category and about 26.3% of time in the comfortable category. Mumbai surprisingly has only 0.3% of the time in the severe danger category. It concludes that less than 30% of the time in these cities is comfortable for outdoor activities or indoor time without cooling needs.
“There is too much seasonal variation. The ranking of cities according to comfortable hours does not imply which city is most comfortable. The idea was to analyse how much time annually can be spent without the use of energy for heating or cooling. Also from the tourism point of view, we wanted to see which is the ideal time to visit these cities,” said Manju Mohan, the lead author of the study.
Another part of the study is to develop a method of assessing comfortable hours despite the seasonal variation. That looks at each month to check for the time that is not extremely hot or cold. For instance, “uncomfortable hours” have not been factored in the current ranking. If the ranking is done as per uncomfortable hours then Kolkata, Delhi and Chennai will rank higher than Mumbai.
Cost of living: most and least inexpensive
The 10 least expensive cities in the world
2013-14
1. Mumbai (India)
2. Karachi (Pakistan)
3. New Delhi (India)
4. Damascus (Syria)
5. Kathmandu (Nepal)
6. Algiers (Algeria)
7. Bucharest (Romania)
8. Panama City (Panama)
9. Jeddah (Saudi Arabia)
10. Riyadh (Saudi Arabia)
2013-14: the world's least inexpensive cities are all in South Asia

Mumbai tops list of world's 10 least expensive cities, Delhi third: Survey Kounteya Sinha,TNN | Mar 4, 2014
[timesofindia.indiatimes.com/city/mumbai/Mumbai-tops-list-of-worlds-10-least-expensive-cities-Delhi-third-Survey/articleshow/31413718.cms The Times of India]
LONDON: For an average Indian, living costs in Mumbai may be a nightmare. But the new Worldwide Cost of Living 2014 index has thrown up an interesting finding.
India's city of dreams has emerged as the world's cheapest city to live in. The analysis takes into account the concept of value of money — how much bread would you get for one dollar or for that matter a litre of petrol. While Mumbai has emerged as the country with the best value for money spent, Delhi has emerged the third cheapest, placing it right at the bottom of the world's most expensive cities.
For example, buying 1 kg bread in Mumbai would cost $ 0.91 while in Delhi it would be $ 1.05 as against $ 3.36 in Singapore which has toppled Tokyo to be the world's most expensive city to live in this year. The average cost of one litre unleaded petrol in Mumbai is $ 1.21 and in Delhi $ 1.14 as against $ 2.50 in Paris — the world's second most expensive city.
Singapore topped 131 cities globally to become the world's most expensive city to live in 2014, according to the economist intelligence unit (EIU). Asia is interestingly home to some of the world's most expensive cities as well as to many of the world's cheapest cities.
The index says: "Within Asia the best value for money is in the Indian subcontinent (defined as India, Pakistan, Bangladesh, Nepal and Sri Lanka). Mumbai is the cheapest location in the survey and three of the four cheapest cities surveyed hail from Pakistan, India and Nepal. Mumbai's title as the world's cheapest city and is a reflection of the structural factors that define price within the Indian subcontinent."
It added: "Although India has been tipped for future growth, much of this is driven by its large population and the untapped potential within the economy. Income inequality means that low wages proliferate, driving down household spending and creating many tiers of pricing that keep per capita spending low. This, combined with a cheap and plentiful supply of goods into cities, as well as government subsidies on some products, has kept prices down, especially by western standards."
Besides Singapore, cities making up the top five most expensive cities to live in are Paris, Oslo, Zurich and Sydney, with Tokyo falling to sixth place. The economic intelligence unit's Worldwide Cost of Living Survey looks at more than 400 individual prices.
The survey gathers detailed information on the cost of more than 160 items-from food, toiletries and clothing to domestic help, transport and utility bills — in every city. More than 50,000 individual prices are collected in each survey round.
2015: Delhi 2nd costliest city in India
The Times of India, Jun 18 2015
Delhi 2nd costliest Indian city for expats
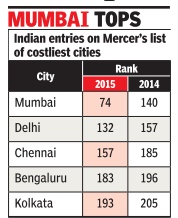
Delhi continued to be ranked the second costliest city in India for expats, even as it moved up 25 places in market analyst Mercer's 21st Annual Cost of Living Survey 2015, which lists 207 cities worldwide. The survey named Luanda, the capital of Angola, as the world's costliest city for expatriates to live in, while Mumbai was ranked India's most expensive metro.
Delhi was ranked 132 in the list which places cities in the descending order in terms of living costs, with the costliest cities on top.
Other Indian cities in the list were Chennai (157), Bengaluru (183) and Kolkata (193), all adjudged more expensive than last year. In the subcontinent, Karachi (205) was ranked the world's third least expensive city.
Mercer said Mumbai, and other Indian cities, had climbed up the rankings due to rapid economic growth, inflation on the goods and services basket and a stable currency against the US dollar.
Mumbai witnessed higher inflation over the past year as compared to other metro cities, higher cost of fuel and transportation, and increased prices of food items, home services and rentals. Mercer's survey is one of the world's most comprehensive, and is designed to help MNCs and governments determine compensation allowances for their expatriate employees.
2015: Club Sandwich Index
See graphic.

2015: Mumbai is world's cheapest city
The Times of India, Oct 10 2015
Study: Mumbai is world's cheapest city to live in
Kounteya Sinha
Mumbai has emerged as the world's cheapest city to live and work in, among 12 top metropolitan cities of the world. London, Hong Kong and New York are the world's most expensive cities for companies to accommodate employees, with costs in London going through the roof, says Savills World Research.
The cheapest city in the index is Mumbai, where it costs just $29,088 to accommodate an employee, up only 2.4% since 2008, while Shanghai comes in at $38,089, up 15.6%. On comparison, the index which measures the combined cost of residential and office rental per person per year found that London's costs averaged $118,425 in the first half of 2015, an increase of 20.7% since the index was launched in 2008.This is marginally more expensive than Hong Kong where costs have risen just 0.4 per cent since 2008, and New York which has seen 28.4% growth.
San Francisco has been the biggest riser, with growth of 59.8% since 2008
Yolande Barnes, director of Savills World Research said “Our LiveWork report says that while London, Hong Kong and New York are the world's most expensive cities for accommodating employees, relatively speaking Mumbai's real estate costs are more expensive as they are five times the average GDP, compared to London and New York where real estate is only twice and 1.5 times the GDP respectively.“
2017: Bengaluru, third cheapest city in the world
Survey: Bengaluru third cheapest city in the world to live in, TNN, Mar 22, 2017, The Times of India
HIGHLIGHTS
Four Indian cities are among the 10 cheapest places on the planet
Chennai occupies the sixth place, Mumbai seventh and New Delhi tenth
Almaty in Kazakhstan is the cheapest city in the world, followed by Lagos in Nigeria
Singapore retains its title as the world's most expensive city for the fourth consecutive year, while Hong Kong remains second
It's hard to believe, but true. Tech capital and pensioners' paradise Bengaluru has been declared the third cheapest city in the world in a report compiled by the Economist Intelligence Unit (EIU), an arm of The Economist Group.
The report says three other India cities figure in the list, with Chennai occupying the sixth place, Mumbai seventh and New Delhi the tenth position. The four Indian cities are among the 10 cheapest places on the planet.
Almaty in Kazakhstan has been ranked the cheapest in the world, followed by Lagos in Nigeria. Karachi was placed 4th, Algiers (5th), Kiev (8th) and Bucharest (9th) rank. Singapore retained its title as the world's most expensive city for the fourth consecutive year, while Hong Kong remained second, closely followed by Zurich at the 3rd place. Others in the 10 most expensive list include Tokyo at the 4th position, Osaka (5th), Seoul (6th), Geneva (7th), Paris (8th), New York (9th) and Copenhagen at 10th place. The Worldwide Cost of Living is a biannual EIU survey that compares more than 400 individual prices across 160 products and services. These include food, drink, clothing, household supplies and personal care items, home rents, transport, utility bills, private schools, domestic help and recreational costs.
The EIU's Worldwide Cost of Living 2017 report sa Cost of Living 2017 report said Asia is home to some of the world's most expensive cities and also to many of the world's cheapest cities. "Although the Indian subcontinent remains structurally cheap, instability is becoming an increasingly prominent factor in lowering the relative cost of living of a location," the EIU said, adding that "this means that there is a considerable element of risk in some of the world's cheapest cities". Within Asia, the best val ue for money has traditionally come from South Asian cities, particularly those in India and Pakistan, the report said. Half of the 10 cheapest locations surveyed are in this region, including Karachi which ranks 4th.
"India is tipped for rapid expansion as Chinese growth declines, but much of this is driven by its demographic profile, and in per capita terms, wage and spending growth will come from a low base," the report said.
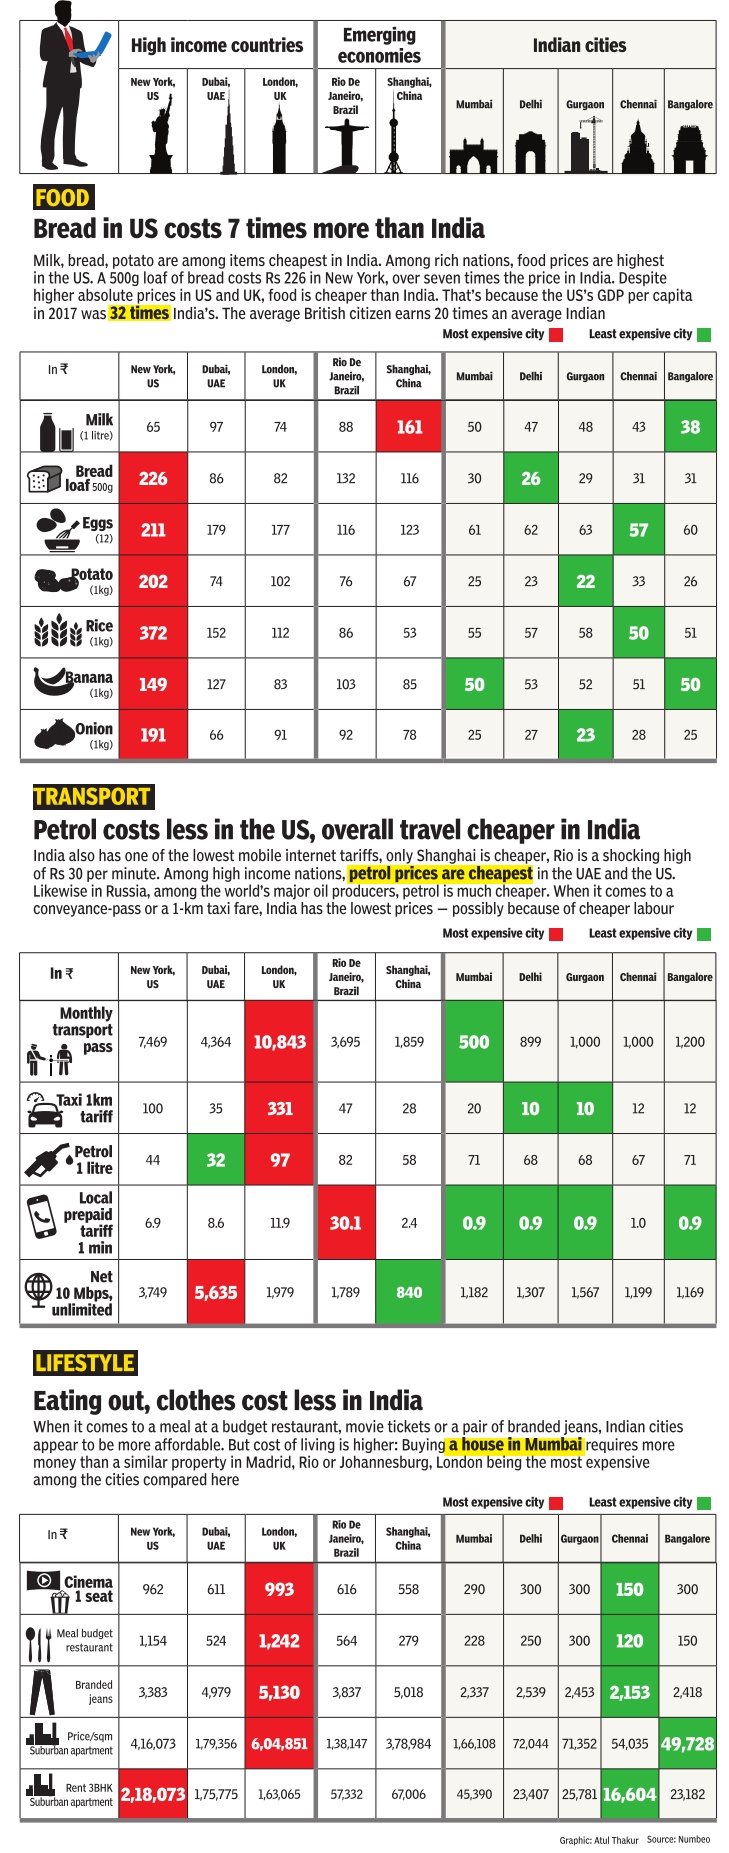
Indian cities vs. high income countries
The Times of India, June 21, 2017
See graphic.
Economic performance
The wealth of India’s cities: 2016
Mumbai richest Indian city with wealth of $820 billion: Report, Feb 27, 2017: The Times of India
Agencies
HIGHLIGHTS
India's financial capital Mumbai is home to 46,000 millionaires and 28 billionaires, a report says
National capital Delhi is home to 23,000 millionaires and 18 billionaires with total wealth of $450 billion
Bengaluru has 7,700 millionaires and 8 billionaires and an aggregate wealth of $320 billion
Tourists at Mumbai's Gateway of India (Photo courtesy: Mumbai Mirror)Tourists at Mumbai's Gateway of India (Photo courtesy: Mumbai Mirror)
MUMBAI: Mumbai is the richest Indian city+ with a total wealth of $820 billion, a report has said.
According to the latest New World Wealth report, India's financial capital here is home to 46,000 millionaires and 28 billionaires, and is followed in terms of wealth by Delhi in second place and Bengaluru in third place.
Delhi is home to 23,000 millionaires and 18 billionaires with total wealth of $450 billion, while Bengaluru has 7,700 millionaires and 8 billionaires and an aggregate wealth of $320 billion. Home to 9,000 millionaires and 6 billionaires, Hyderabad is next with a total wealth of $310 billion.Pune, with a total wealth of $180 billion, has 4,500 millionaires and 5 billionaires+ .
Mid-size cities, 2011
The Times of India, Oct 07 2015

Dipak Dash
Star constituencies lag in economic performance
15 of 20 worst mid-size cities are in UP, Bihar: Report
Fifteen of the 20 worst mid-size cities by economic performance are from Uttar Pradesh and Bihar, according to a recent report on non-metropolitan class-I cities in India. Interestingly , five of these, which fall in the category of cities with less than 10 lakh population, have been traditionally represented by the who's who in Indian politics. According to the report prepared by the National Institute of Urban Affairs (NIUA) of Union housing ministry, the worst performers on economic parameters include Hajipur, Ara and Buxar in Bihar and Etawah, Akbarpur, Mirzapur, Lakhimpur and Barabanki in Uttar Pradesh. Jangipur in West Bengal also finds place in the list.
On the contrary , non-metropolitan cities from Tamil Nadu dominate the list of top 20 best ones as far as their economic performance is concerned. While Udhagamandalam ranks first and Gurgaon second, Noida, Gonda, Ambala and Rohtak also find pride of place among the best performing ones.
The report has been prepared based on the 2011 census data for 416 class-I nonmetropolitan cities.
The report also indicates how there is a huge gap in monthly per capita income among the top 20. While it's as high as Rs 29,560 in Udhagamandalam and Rs 28,802 in Karaikudi in Tamil Nadu it's only Rs 4,661 in Greater Noida and Rs 4,918 in Rewari in Haryana. The report points out an alarming trend of one in every five workers in such cities who were found to be living below the poverty line indicating that in most of cases workers may not be getting the mandated minimum wage. The report mentions, “20.5% of the male workers and 23.3% of female workers in non-metropolitan India were found to be below the poverty line in 2011-12. In 2011-12, 20.7% of the self-employed persons; 27.7% of the unpaid family workers; 3.3% of the employers; 41.8% of the casual workers; and 10.5% of the regular wage workers were found to be poor.“
It also has the names of cities, which have high internet penetration. While Gurgaon tops the list with more people having computer laptop with internet, Panchkula in Haryana and Aizawl in ranked second and third.
The report shows how major urban centres in north India have higher percentage of cars and jeeps. While in Panchkula and Gurgaon every third household has such a vehicle in Noida-Greater Noida more than 30% homes own a car.
2014: Growth of cities
Feb 12 2015
Chidanand Rajghatta
Only 6 Indian metros among top 100 in an Economic Performance Index
The Brookings Institution's 2014 Global Metro Monitor Map that measures and compares growth patterns in the world's 300 largest metro economies puts Delhi at 18th place, followed by Kolkota (among Indian cities) at 32nd.Mumbai (52) Chennai (57) Hyderabad (76) and Bangalore (87), round up the Indian cities in the Top 100, which expectedly is dominated by Chinese cities. China has 11 cities in the Top 20, and four in the Top 10.Surprisingly, Turkey has four in the Top 10, including Izmir, Istanbul, and Bursa at two, three and four, respectively. Macau got the top spot. The report compares growth patterns in the world's 300 largest metro economies on two key economic indicators -annualized growth rate of real GDP per capita and annualized growth rate of employment.
These indicators, which are combined into an economic performance index on which metro areas are ranked, matter because they reflect the importance that people and policymakers attach to achieving rising incomes and standards of living and generating widespread labour market opportunity, the report says.
There is increasing emphasis by planners in recent years on cities because, as the report shows, with only 20% of the population, the 300 largest metropolitan economies in the world accounted for nearly half of global output in 2014.
Despite the dismal ranking of Indian cities, they have all improved on their rankings from the 2009-2014 period, pointing to better prospects.
Most of the growth in the cities surveyed is occurring in developing countries, particularly in Asia.
The highest ranked developed western city is London, which is placed at 26, and the top ranked American city is Austin at 38.
2014: Risk to GDP
The Times of India, Sep 04 2015
Mayur Shetty
Mumbai tops world in terror risk to GDP
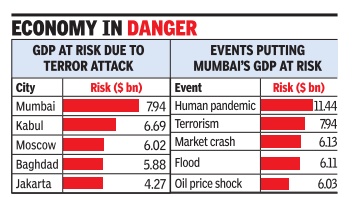
The 2611 attack on Mumbai might not have been on the same scale as New York's 911. But Lloyd's -the world's oldest active insur ance marketplace -believes Mumbai tops the global list in terms of economic output a risk ($8 billion) in the event of a terrorist attack. The city's gross domestic product at risk (GDP@risk) due to terrorism is slightly more than Kabul's ($7bn). What's more, Mumbai and Delhi rank third and fourth in GDP@risk due to a power outage. Lloyd's City Risk Index is the first bid to measure the economic output at risk in 301 cities from 18 man-made and natural threats over a decade.
In India the top cities in terms of GDP@risk are Ahmedabad, Bengaluru, Chennai, Delhi, Hyderabad, Kanpur, Kolkata, Mumbai, Pune and Surat, which together will generate an average annual GDP of $1.4 trillion in the coming decade. However, 12.6% of this economic growth is at risk from the combination of 18 man-made and natural threats.
The analysis assesses the threat to the cities in terms of how likely a catastrophe of a type of threat might affect the city over the next 10 years. It includes assessments of how vulnerable the city might be to that scenario and the resilience of the city in bouncing back from that catastrophe. The amount of economic output lost is represented in the GDP@risk figure, which is an expected loss figure. The expected loss is arrived at by computing the value of an expected loss multiplied by the probability of the loss. “In the case of New York, though it has higher value assets than Mumbai, its GDP@risk associated with terrorism is just $0.59bn compared to Mumbai's $7.94bn. This is because New York is less vulnerable to a terrorist attack (eg., because of its advanced security and intelligence infrastructure) and its economy is more resilient thus better able to bounce back after a terrorist event should it take place,“ Lloyd's said. The survey has some other interesting findings as well. While Mumbai, Delhi, Kolkata are the top three, Ahmedabad is a surprise in the fourth position due to the economy's susceptibility to losses arising out of flood ($14bn). Bengaluru is much lower on the list at 10th position because the biggest threat to GDP is a pandemic ($1.8bn).
Although Mumbai tops the list in terms of risk of terrorism to the economy , the biggest threat to the city's output according to Lloyd's is a human pandemic which could cause losses of $11.44bn followed by terrorism, market crash, flood and oil price shocks.
In terms of events, the biggest threat to economic output is a crash in stock markets which could wipe out $1trillion followed by Human Pandemic ($591 bn) and Windstorm ($586bn). The top three cities in terms of GDP at risk are Taipei ($181bn), Tokyo ($153bn) and Seoul ($103bn). The city that is exposed to most threats is New York, which is in the top five in nine of the 18 events which includes cyber risks, flood, freeze, heatwave, market crash, nuclear risks and oil price shock.
Wealth, 2017: Mumbai, Delhi, Kolkata, Hyderabad
HIGHLIGHTS
City Wealth Index ranks Mumbai at 21 and Delhi at 35.
The report has mapped super-rich population of 125 cities across 89 countries.
The ultrahigh net worth individuals affect investment and lifestyle decisions.
MUMBAI: Mumbai ranks 21st in the 'City Wealth Index' ahead of Toronto, Washington DC and Moscow, according to the Knight Frank Wealth Report 2017 released on Wednesday. Delhi at 35 is ahead of Bangkok, Seattle and Jakarta.
The report tracks the growing super-rich population in 125 cities across 89 countries and provides perspective on the issues that are influencing ultrahigh net worth individuals (UHNWI) investment and lifestyle decisions. This year's survey results are based on responses from almost 900 of the world's leading private bankers and wealth advisors. UHNWIs are those with net assets worth over $ 30 million (roughly Rs 200 crore).
The number of UHNWIs in India has increased by 290% during the last decade. India houses 2% of the world's millionaires (13.6 million) and 5% of world's billionaires (2,024).
In India, Mumbai leads the race with 1340 UHNWIs followed by Delhi (680), Kolkata (280) and Hyderabad (260) UHNWIs. Indian cities that saw a rise in UHNWIs compared to 2015 include Pune (18%), Hyderabad and Bangalore (both at 15%) and Mumbai (12%).
Out of 40 global cities, Mumbai ranks 11 in the 'future wealth' category ahead of Chicago, Sydney, Paris, Seoul and Dubai.
"Substantial proportion of wealthy Indians is likely to invest in residential property in the next two years - 40% within country and 25% overseas," it said.
Knight Frank India's chief economist & national director - research Samantak Das said, "In terms of real estate sector investment, the wealthy Indians have expressed their top priority in the office segment and logistics also sees a three-fold rise. Even though the residential market in India is reeling under pressure, 40% of wealthy Indians are likely to invest in residential property in India in the next two years while 25% are keen for overseas avenues."
UHNWIs in India prefer countries like Singapore, UK, UAE, USA and Hong Kong for owning a home. However, the global wealthy prefer buying properties in European countries.
27% of Indian UHNWIs have already invested in collectibles such as art, wine or classic cars. Motor yacht is the most sought after luxury asset followed by sailing yacht, race horse, private jet and sports team. "The preference for these items as luxury investment and spending is substantially lower than the global average," said the report.
In terms of most expensive prime residential i.e. the square metres of prime property US$1m will buy, Mumbai climbed up to rank 15 from 18 last year, ahead of Istanbul, Melbourne and Dubai.
Fitness
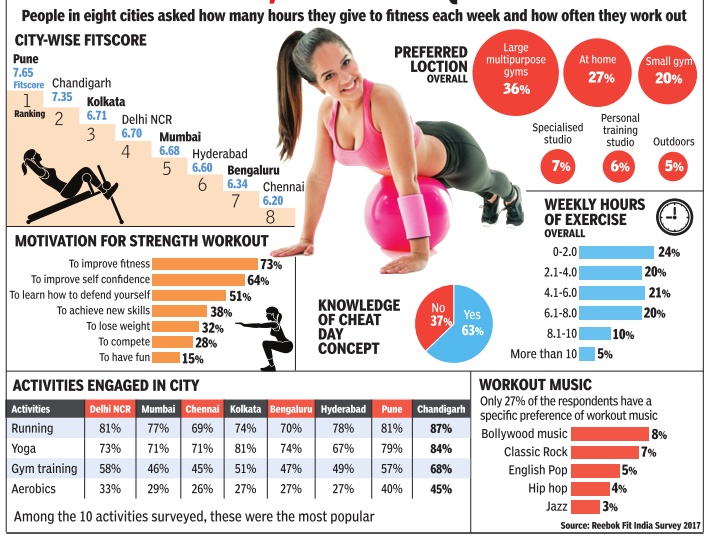
2017: Reebok survey
Governance
2017: Thiruvananthapuram tops
Delhi slips, Thiruvananthapuram tops city governance ranking , Feb 28, 2017, The Times of India
HIGHLIGHTS
The better a city scores in the survey, the more likely it is that it will be able to deliver better quality of life
In the survey, Pune is ranked second, up two ranks from 2015, while Kolkata retains its third slot
The low scores imply that Indian cities need to strengthen their city-systems
Delhi slips two places to rank ninth while Thiruvananthapuram retains its number one position in the annual city governance ranking, according to a survey released on Tuesday, which evaluated 21 major cities from the country's 18 states.
The Annual Survey of India's City-System (ASICS) was undertaken by not-for-profit institution Janaagraha Centre for Citizenship and Democracy (JCCD).
The better a city scores in the survey, the more likely it is that it will be able to deliver better quality of life to citizens over the medium and long-term.
In the survey, Pune is ranked second, up two ranks from 2015, while Kolkata retains its third slot.
The biggest gainer in the 2016 survey is Bhubaneswar, which has jumped eight places from 2015 to land at the 10th spot.
Bengaluru has dropped four places to rank 16, while Ludhiana, Jaipur and Chandigarh retain their previous positions of 19th, 20th and 21st respectively.
Releasing the survey, JCCD CEO Srikanth Viswanathan said India's cities are not poised to handle urbanisation well and the survey for 2016 reveals several systemic inadequacies in urban governance that could affect public service delivery.
Viswanathan said the survey showed that Indian cities score between 2.1 and 4.4 on scale of 10, as against the global benchmarks of London and New York, which score 9.3 and 9.8 respectively.
These low scores imply that Indian cities need to strengthen their city-systems - quality of laws, policies and institutions significantly to improve service delivery and deliver a high quality of life to citizens, he added.
The ASICS report is designed to help city leaders pin point issues in urban governance in their cities and help them chalk out a reform roadmap to make them more livable.
The City-Systems framework, comprises four distinct but inter-related components - urban planning and design, urban capacities and resources; empowered and legitimate political representation and transparency, accountability and participation.
Healthcare
Delhi and Mumbai
Subodh Varma, Why Mumbai has better ‘civic sense’ than Delhi, Apr 21, 2017: The Times of India
HIGHLIGHTS
BMC's annual budget is five times more than that of the cumulative budget of three municipal bodies in Delhi
Delhi’s municipalities derive almost 40% of their incomes from grants given by the state government
BMC spent three times more on health and two times more on the education
NEW DELHI: The scorching heat of an early summer in the capital is somewhat being tempered by expectation that life might become better after the municipal polls on April 23, given the cool election promises being made by the contending parties. Not surprisingly, however, none of the parties is revealing where it will find the funds+ to back the generous assurances. The reality, as Delhi's citizens know well, is that the three municipal corporations are hamstrung by a chronic cash crunch+ that has forced employees into striking work over delayed salaries, foiled attempts to check outbreaks of dengue and other diseases and left civic services in a shambles.
With a cumulative budget of Rs 9,551 crore in 2014-15, the three municipal bodies spent an average of just Rs 5,340 per person in a year. Nearly 40% of the money went into paying civic employees and corporators, and to meet general administrative expenses. Sanitation activities+ , like collection and disposal of garbage, and cleaning of drains, accounted for just Rs 1,258 per person. Healthcare, including running dispensaries and conducting disease prevention programmes, came for even less at Rs758 per person. Compare this with the spending of Greater Mumbai Municipal Corporation, the country's richest municipal body with an annual budget over five times that of Delhi. It spent three times more on health and two times more on the education per person. Remember, the population residing in Mumbai's municipal area is considerably less than in Delhi.
How does Mumbai manage to generate more income? Can't Delhi do the same? Of course, Delhi's status as a Union territory with an assembly hampers full devolution of powers to local bodies, unlike in the case of Mumbai. Octroi, development charges and property tax are the main sources of revenue for the Municipal Corporation of Greater Mumbai. Delhi's municipalities derive almost 40% of their incomes from grants given by the state government. Water distribution is a significant source of income in Mumbai, but in Delhi this has been hived off to a separate body under the state government. In short, for the municipalities in the capital to become resource rich, either the whole set-up in Delhi needs to be changed or more grants will have to be given to them. This crucial fact, of course, doesn't exercise the minds of the political leaders out wooing the voters.
Liveability Index
2010: Delhi best city, NCR no match
Megha Suri Singh | TNN
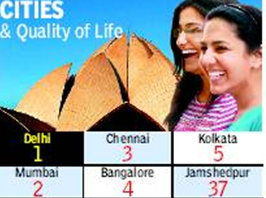
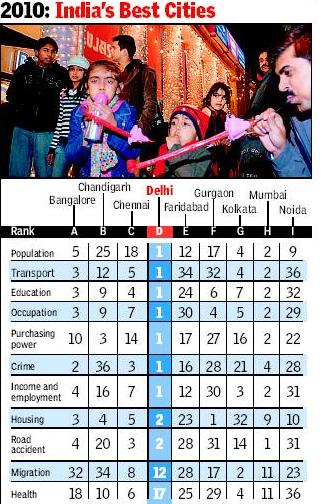
New Delhi: Despite all its problems, Delhi offers the best quality of life to its residents among all cities in the country, according to a ‘Liveability Index’ released by CII. In the index, based on surveys, Delhi outscores metros like Mumbai, Chennai, Bangalore and Kolkata; NCR towns Gurgaon, Noida and Faridabad; and even planned cities like Chandigarh.
Delhi ranks first on parameters like population density, safety, transport, education, job opportunities and accidents. The only red line in the capital’s card is health care, where the city is ranked 17th. Kozhikode, Thiruvananthapuram, Kochi and Kolkata score high on this front.
Among NCR cities, Gurgaon ranks ninth on the list — it tops the chart on housing and educational facilities but lags behind due to lack of job opportunities, crime and unsafe roads and public transport. Noida ranks 27th due to poor health care, crime rate, no public transport and high rate of accidents.
In NCR, worst city to live in is Faridabad
New Delhi: ‘Liveability Index’ released by the Confederation of Indian Industry, while terming Delhi as the best city to live in, stated that the worst city in NCR is Faridabad with a rank of 32. The city needs upgradation of employment opportunities, public transport, roads, migration and healthcare.
Delhi also scores relatively low (12th) on migration. But cities like Indore, Pune, Chandigarh, Goa, Bangalore, Jaipur and Faridabad are far worse at ranks 37, 35, 34, 33, 32, 29 and 28, respectively.
After Delhi, the next best cities to live in, according to the survey, are Mumbai, Chennai and Bangalore, in that order. The bottom rankers in the index are Jamshedpur (ranked 37th), Visakhapatnam (36th), Patna (35th), Lucknow (34th) and Ludhiana (33rd).
The survey studied 37 Indian cities over a decade to deduce a Quality of Life index. ‘‘The study uses hard data collected from reliable sources to eliminate the possibility of personal bias or a sampling error obscuring the reality,’’ said an official.
2014: Noida best
Source: The Times of India
1. The Times of India, Aug 16 2015
2. The Times of India, Aug 16 2015, Sharmila Bhowmick
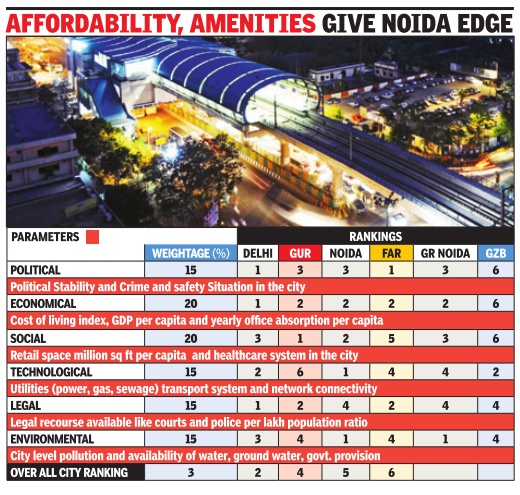
Noida is the best NCR city to live in because its civic infrastructure is more evolved and cost of living moderate, says a recent study , placing it above Gurgaon which emerged as NCR's office district. Faridabad was the most stable and Ghaziabad the least, reports Sharmila Bhowmick. The Residential Preference Survey 2015, compiled by real estate services and consultancy giant Colliers International, India, ranked five NCR cities across political, economic, social, technological, environmental and legal factors. The research was compiled with the help of field experts and secondary sources such as Google and government databases.
There are people who always defend “dynamic“ Gurgaon, and claim it's the best city in NCR. And then there are others who swear by “planned-city“ Noida.Now, finally , there's a study that factors in various parameters to reach a more informed ranking. Right on top, beating Gurgaon, is Noida. And it is the best city to live in NCR because its civic infrastructure is more evolved and cost of living moderate.
According to the `Residential Preference Survey 2015' by real estate services and consultancy giant Colliers International, India, living in Noida is the best bet for people who like to lead a hassle-free and laidback life with enough amenities, even though many residents may have to travel long distances to Delhi or Gurgaon for the sake of their jobs.
In the study , Gurgaon has predictably emerged as NCR's office district. It is the swishest NCR city and creates most employment, but also has the most expensive real estate.
The research by Colliers on the basis of a Pestle study of comparative indices-based on political, economic, social, technological, environmental and legal parameters--includes five NCR cities of Gurgaon, Noida, Faridabad, Greater Noida and Ghaziabad. Colliers compiled its research with the help of field experts, as well as secondary sources like NUMBEO, Wikipedia, Google and other government databases.
“Pestle is a strategic tool which gauges macro environmental factors. Accordingly, we ranked cities on parameters such as political, economic, social, technological, environmental and legal, which impact a person's decision making on which city to live in. The research shows some interesting pointers,“ Surabhi Arora, associate director (research) at Colliers International, India, told TOI.
It appears from the study that when people choose a city to live in or invest in property , political stability is one of the most important deciding factors. “To determine political stability , we have taken qualitative indices of crime in the cities over the past six months. It revealed Faridabad as the most stable across a combination of factors, with Ghaziabad the least stable. Gurgaon, Noida and Greater Noida are all at par,“ Arora said. However, Ghaziabad is the most crime-prone with 79.30 points according to the survey. Noida and Greater Noida are both at 57.79 points.
In economic indices, Gurgaon, at 160.27 points, is the most expensive NCR city to live in, while Noida stands at 93.94 points. “This shows that for the same basket of goods -a qualitative combination of rent, grocery , restaurants, etc -you spend a low of Rs 93.94 in Noida, but a high of Rs 160.27 in Gurgaon,“ Arora said.
In social indices, Gurgaon scored the highest in healthcare facilities at 78.17 points, based on secondary sources. “Although professionals choose to live in Gurgaon because most corporate offices are located there, in the long term, and in terms of lifestyle quality, Noida is so far the best bet in NCR,“ Arora said.
Road travel
Fastest in Delhi, Pune
The Times of India Jan 01 2016
With an average on-road speed of 23 km per hour, Delhi and Pune are among he fastest in terms of average vehicular movement among he top seven cities in India, says a study.
According to data collected by cab aggregator Ola, Kolkata and Bengaluru were among the slowest with average speeds of 7kmhr and 18 kmhr, respectively.Chennai, Mumbai and Hyderabad had average speeds of 1, 20 and 19 kmhr, respectively according to data collected over he last six months.
Road safety
Country's largest carmaker Maruti Suzuki India on Monday released a road safety index, covering eight cities including the national capital and Mumbai.
The index, compiled across several categories on the basis of citizen views and ground level surveys, rates cities across the country on road safety on various parameters like road lighting, maintenance and infrastructure.
The names of winner cities were announced by Union Transport Minister Nitin Gadkari. While Mumbai featured on top for pedestrian rights, Delhi scored maximum for its connectivity, road quality and road infrastructure.
As per the index, Bengaluru topped in road safety while Ahmedabad scored high on road cleanliness.
"Road safety is increasingly becoming a matter of national importance. As a leader in automobile industry we are working on inculcating safe driving habits among people through various training initiatives," MSI Executive Director Marketing & Sales RS Kalsi said. This initiative of city-wise road safety index further strengthens the company's mission for safer roads, he added.
The objective of the report is to lay down parameters which can become guidelines for government institutions, NGOs and to improve road safety, Kalsi said. Other cities covered under the index include Pune, Kolkata and Hyderabad
Women
Best and worst cities for women
December 11, 2014
Two years after the Nirbhaya case, the recent incidents have again put a question mark on Delhi's record in ensuring safety for women. NCRB data on violent sexual offences (rape and assault on women) suggests that the national capital is among the worst cities in the country. Among 53 large cities, the rate of these crimes (the number per lakh population) was 73.9 for Gwalior and 59.5 for Delhi -the two cities ranking first and second in the hall of shame. Five of the ten most dangerous cities on this count are in Madhya Pradesh. The data also shows that Coimbatore, Chennai, Dhanbad, Rajkot and Madurai are among the safest cities for women.
2013-14: safest Indian cities
Mumbai loses safest city tag, slides to 4th rank: Survey
TNN | Mar 6, 2014
MUMBAI: With rising incidents of crimes against women in Mumbai, the metropolis has lost the top slot as the place perceived to be most secure for women.
An online survey done by a travel portal put Ahmedabad on the top slot. "Ahmedabad garnered 86 % votes and was followed by Pune at 84 % and Bangalore at 81 %. Mumbai, which was number one in 2013, received only 72% votes," stated the survey released ahead of Women's Day by TripAdvisor. The survey mentioned that 53% said they travel alone only to destinations, which are perceived as being safe.
Of the 63% women who have not travelled alone ever, only 8% felt it was unsafe to travel alone abroad but 33% felt it was unsafe to travel alone in India. "An encouraging proportion of women in India have started to travel by themselves or in all-women groups," Nikhil Ganju, country manager, TripAdvisor India said. Despite safety being a concern, over 51% respondents were unaware that hotels in India have floors exclusively for women.
See also
Cities, districts of India: cleanliness rankings
For ‘The educational levels of cities, 2011’, see Higher Education: India
