Income Distribution:India
(→Disparities) |
(→Rural households’ incomes) |
||
| Line 17: | Line 17: | ||
[[Category:Development|I]] | [[Category:Development|I]] | ||
[[Category:Government|I]] | [[Category:Government|I]] | ||
| + | =Disparities= | ||
| + | ==Rich getting richer/ 2010== | ||
| + | |||
| + | [http://epaper.timesofindia.com/Default/Client.asp?Daily=CAP&showST=true&login=default&pub=TOI&Enter=true&Skin=TOINEW&AW=1393708348876 Times of India] | ||
| + | |||
| + | |||
| + | 120k Indians hold a third of national income | ||
| + | |||
| + | Marks Increase Of More Than 50% Over 2008 Figure: Study | ||
| + | |||
| + | Rukmini Shrinivasan | ||
| + | |||
| + | New Delhi: Last year [2010?] may have been a cruel year for much of the country with slow growth and double-digit food inflation, but India’s high net worth individuals (HNWIs) prospered — just over 120,000 in number, or 0.01% of the population, their combined worth is close to one-third of India’s Gross National Income (GNI). | ||
| + | |||
| + | HNWIs, in this context, are defined as those having investable assets of $1 million or more, excluding primary residence, collectibles, consumables, and consumer durables. According to the 2009 Asia-Pacific Wealth Report, brought out by financial services firms Capgemini and Merrill Lynch Wealth Management, at the peak of the recession in 2008, India had 84,000 HNWIs with a combined net worth of $310 billion. To put that figure in perspective, it was just under a third of India’s market capitalization, that is, the total value of all companies listed on the Bombay Stock Exchange — as of end-March 2008. The average worth of each HNWI was Rs 16.6 crore. | ||
| + | |||
| + | To get a fix on just how rarefied a level it puts them in, we did some simple calculations that threw up stunning numbers. It would take an average urban Indian 2,238 years, based on the monthly per capita expenditure estimates in the 2007-8 National Sample Survey, to achieve a net worth equal to that of the average HNWI. And that’s assuming that this average urban Indian just accumulates all his income without consuming anything. A similar calculation shows that an average rural Indian would have to wait a fair bit longer — 3,814 years! | ||
| + | |||
| + | According to the firms’ 2010 World Wealth Report, India now has 126,700 HNWIs, an increase of more than 50% over the 2008 number. | ||
| + | |||
| + | While the figure for combined net worth is not available, it seems safe to assume that as a class not only have India’s super-rich recouped their 2008 losses, they have even made gains over their pre-crisis (2007) positions. In 2007, 123,000 HNWIs were worth a combined $437 million. | ||
| + | |||
| + | Meanwhile, in 2009 alone, an estimated 13.6 million more people in India became poor or remained in poverty than would have been the case had the 2008 growth rates continued, according to the United Nations Department of Economic and Social Affairs (UNDESA). Also, an estimated 33.6 million more people in India became poor or remained in poverty over 2008 and 2009 than would have been poor had the pre-crisis (2004-7) growth rates been maintained over these two years. | ||
| + | |||
| + | The 2009 Asia-Pacific Wealth Report notes that the HNWI population in India is also expected to be more than three times its 2008 size by the year 2018, with emergent wealth playing a key role. Like China, relatively few among the current HNWI population (13%, compared to 22% in Japan) have inherited their wealth and even fewer (9%) are over the age of 66. | ||
| + | =="Inequality should be measured on income per capita"== | ||
| + | |||
| + | [http://epaperbeta.timesofindia.com//Article.aspx?eid=31808&articlexml=Govt-data-on-inequality-misleading-21012015015005 ''The Times of India''] | ||
| + | |||
| + | Jan 21 2015 | ||
| + | |||
| + | ''' Govt data on inequality misleading ''' | ||
| + | |||
| + | Inequality in South Asia is much more glaring than what government data shows because standard yardsticks of measuring income don't reveal the true picture, says a World Bank report `Addressing Inequality in South Asia', released on Tuesday . | ||
| + | For instance, the Gini coefficient -the standard measure to gauge income inequality -ranges from 0.28 to 0.40 in this region, suggesting a level of inequality much lower than in countries like Argentina, Malaysia, Chile or Brazil. The caveat to this comparison, however, is that in South Asia inequality is measured on the basis of consumption per capita while in advanced economies as well as Latin America, it is based on income per capita. The consumption-based approach doesn't give the true picture of inequality as it does not cover the spending habits of the richest sections of the population. This is because in these countries, the typical questionnaire for surveys that measure income is focussed on a relatively basic basket of goods and services. | ||
| + | |||
| + | Based on a 59th round NSSO survey that was focussed on measuring wealth (land, building, machinery , financial assets and so) the report estimates that the average net worth of the top 10% of the population in India was 380 times that of the bottom 10%. The net worth could support consumption for 23 years for the top bracket and less than three months for the bottom one. | ||
| + | |||
| + | The huge income difference between the richest and the poorest also means a wide degree of difference in access to basic needs like nutrition, health care and education. Because of these differences, the distribution of wealth in the high economic growth period following liberalization has been more favourable to a much smaller section of society , the report said. | ||
| + | |||
| + | The report said that the total billionaire wealth represented about 10% of India's GDP in 2012, which was an outlier in the ratio of billionaire wealth to GDP among economies of similar development levels. Interestingly , 40% of India's billionaire wealth is estimated to be inheritance while 60% originates from `rent-thick sectors' such as real estate, infrastructure, construction, mining and telecommunications. | ||
| + | |||
| + | Evidently , for a majority of its population, India is not the land of equal opportunity .The income share of India's top 0.01% was less than 0.4% in 1980, but rose to 1.5 to 2% by the end of the 1990s. During this period, the income share of the top 0.1% was 3 to 4.5%, suggesting growth was strongly biased towards the ultra-rich. Up to 2010, India had the gentlest rate of poverty decline in South Asia. | ||
| + | |||
| + | The report classified the Indian population into three groups -the poor, the vulnerable (people just above the poverty line) and the middle class. Between 200405 and 2009-10, about 40% of poor households moved above the poverty line. Similarly about 11% of poor and vulnerable moved into the middle class during the same period. Alarmingly , during the same period, about 14% of the non-poor groups slipped into poverty . | ||
| + | |||
| + | The lack of social security and access to basic social needs like health care, food security and education is the main reason behind this cycle of poverty . | ||
| + | |||
= Rural households’ incomes= | = Rural households’ incomes= | ||
==2011-13 == | ==2011-13 == | ||
Revision as of 22:59, 24 October 2016


This is a collection of articles archived for the excellence of their content. Readers will be able to edit existing articles and post new articles directly |
Contents |
Disparities
Rich getting richer/ 2010
120k Indians hold a third of national income
Marks Increase Of More Than 50% Over 2008 Figure: Study
Rukmini Shrinivasan
New Delhi: Last year [2010?] may have been a cruel year for much of the country with slow growth and double-digit food inflation, but India’s high net worth individuals (HNWIs) prospered — just over 120,000 in number, or 0.01% of the population, their combined worth is close to one-third of India’s Gross National Income (GNI).
HNWIs, in this context, are defined as those having investable assets of $1 million or more, excluding primary residence, collectibles, consumables, and consumer durables. According to the 2009 Asia-Pacific Wealth Report, brought out by financial services firms Capgemini and Merrill Lynch Wealth Management, at the peak of the recession in 2008, India had 84,000 HNWIs with a combined net worth of $310 billion. To put that figure in perspective, it was just under a third of India’s market capitalization, that is, the total value of all companies listed on the Bombay Stock Exchange — as of end-March 2008. The average worth of each HNWI was Rs 16.6 crore.
To get a fix on just how rarefied a level it puts them in, we did some simple calculations that threw up stunning numbers. It would take an average urban Indian 2,238 years, based on the monthly per capita expenditure estimates in the 2007-8 National Sample Survey, to achieve a net worth equal to that of the average HNWI. And that’s assuming that this average urban Indian just accumulates all his income without consuming anything. A similar calculation shows that an average rural Indian would have to wait a fair bit longer — 3,814 years!
According to the firms’ 2010 World Wealth Report, India now has 126,700 HNWIs, an increase of more than 50% over the 2008 number.
While the figure for combined net worth is not available, it seems safe to assume that as a class not only have India’s super-rich recouped their 2008 losses, they have even made gains over their pre-crisis (2007) positions. In 2007, 123,000 HNWIs were worth a combined $437 million.
Meanwhile, in 2009 alone, an estimated 13.6 million more people in India became poor or remained in poverty than would have been the case had the 2008 growth rates continued, according to the United Nations Department of Economic and Social Affairs (UNDESA). Also, an estimated 33.6 million more people in India became poor or remained in poverty over 2008 and 2009 than would have been poor had the pre-crisis (2004-7) growth rates been maintained over these two years.
The 2009 Asia-Pacific Wealth Report notes that the HNWI population in India is also expected to be more than three times its 2008 size by the year 2018, with emergent wealth playing a key role. Like China, relatively few among the current HNWI population (13%, compared to 22% in Japan) have inherited their wealth and even fewer (9%) are over the age of 66.
"Inequality should be measured on income per capita"
Jan 21 2015
Govt data on inequality misleading
Inequality in South Asia is much more glaring than what government data shows because standard yardsticks of measuring income don't reveal the true picture, says a World Bank report `Addressing Inequality in South Asia', released on Tuesday . For instance, the Gini coefficient -the standard measure to gauge income inequality -ranges from 0.28 to 0.40 in this region, suggesting a level of inequality much lower than in countries like Argentina, Malaysia, Chile or Brazil. The caveat to this comparison, however, is that in South Asia inequality is measured on the basis of consumption per capita while in advanced economies as well as Latin America, it is based on income per capita. The consumption-based approach doesn't give the true picture of inequality as it does not cover the spending habits of the richest sections of the population. This is because in these countries, the typical questionnaire for surveys that measure income is focussed on a relatively basic basket of goods and services.
Based on a 59th round NSSO survey that was focussed on measuring wealth (land, building, machinery , financial assets and so) the report estimates that the average net worth of the top 10% of the population in India was 380 times that of the bottom 10%. The net worth could support consumption for 23 years for the top bracket and less than three months for the bottom one.
The huge income difference between the richest and the poorest also means a wide degree of difference in access to basic needs like nutrition, health care and education. Because of these differences, the distribution of wealth in the high economic growth period following liberalization has been more favourable to a much smaller section of society , the report said.
The report said that the total billionaire wealth represented about 10% of India's GDP in 2012, which was an outlier in the ratio of billionaire wealth to GDP among economies of similar development levels. Interestingly , 40% of India's billionaire wealth is estimated to be inheritance while 60% originates from `rent-thick sectors' such as real estate, infrastructure, construction, mining and telecommunications.
Evidently , for a majority of its population, India is not the land of equal opportunity .The income share of India's top 0.01% was less than 0.4% in 1980, but rose to 1.5 to 2% by the end of the 1990s. During this period, the income share of the top 0.1% was 3 to 4.5%, suggesting growth was strongly biased towards the ultra-rich. Up to 2010, India had the gentlest rate of poverty decline in South Asia.
The report classified the Indian population into three groups -the poor, the vulnerable (people just above the poverty line) and the middle class. Between 200405 and 2009-10, about 40% of poor households moved above the poverty line. Similarly about 11% of poor and vulnerable moved into the middle class during the same period. Alarmingly , during the same period, about 14% of the non-poor groups slipped into poverty .
The lack of social security and access to basic social needs like health care, food security and education is the main reason behind this cycle of poverty .
Rural households’ incomes
2011-13
The Times of India, Jul 04 2015


Subodh Varma
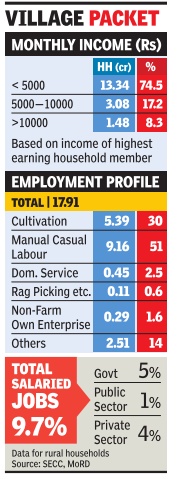
92% village homes run on less than Rs 10,000 a month
Giving a more storied picture of rural India, the Socio-Economic and Caste Census (SECC) released says that a staggering 92% of rural households reported their maximum income below Rs 10,000 per month. Nearly three quarters of all rural households said that the income of the highest earning member was Rs 5,000 or less. The SECC was conducted during 2011-12 with some states completing it in 2013, due to a lengthy process of seeking objections on collected data. It found that about 18 crore households lived in rural areas, including outgrowths of towns.
The SECC found that over 9 crore households were living by doing casual manual labour. That's more than half of all rural households. Cultivators were reported as numbering 5.39 crore households, making up about 30%. The muchheralded non-agricultural enterprises were providing livelihood to just 29 lakh households, a meagre 1.6% of the total.
There seems to be a significant difference with Census 2011 figures. The Census counts people, and according to it, in 2011 there were 9.2 crore cultivators and 8.1 crore agricultural labourers. This would translate to about 2 crore cultivator households and 1.7 crore agricultural labourer households.
However, Abhijit Sen, former member of the Planning Commission who was involved in designing the survey, told TOI that this comparison should not be done because the SECC asked about incomes while the Census asked about work.
“Also, everybody in a household doesn't work. So converting Census-based worker figures to households will not give a true picture,“ he added.
But on one issue, the SECC is perhaps better reflecting the lives of rural people. The Census gives figures for `agricultural labourers' whereas the SECC gives figures for those working as casual manual labourers, which is not confined to agricultural labour alone. Due to pressure on land,fragmentation, and low returns, a vast army of people, both men and women, are turning to any kind of casual labour to earn a living.
“Each rural household will have different kinds of casual workers. The SECC is reflecting this reality,“ Sen said.
SECC reports that only about 10% of rural households have salaried jobs. Of these, about two thirds are in public sector, and a third, 6.4 lakh in all, work regular private sector jobs. And, less than 5% of the rural households pay income tax or professional tax. This is mainly because agricultural income is not taxed and with over 92% households earning less than Rs.10,000, most don't qualify .
Urban India
No source of income for 35 lakh households
The Times of India, Jul 04 2015
35 lakh urban families have no income
At least 35 lakh families in cities and towns have no source of income while 90 lakh households are headed by women, according to raw and unreleased data from the Socio-Economic and Caste Census in urban areas, reports Dipak Dash. About 1 crore households own at least one of four items -fridges, landline phones, washing machines and twowheelers; 86 lakh households own all these.