Delhi: traffic and road accidents
(→2018, road fatalities) |
(→New Year gridlocks) |
||
| Line 173: | Line 173: | ||
In Noida, traffic inspector Layak Singh said that the maximum number of accidents are reported from the expressway area and hence, the data was a little surprising and had to be analysed. | In Noida, traffic inspector Layak Singh said that the maximum number of accidents are reported from the expressway area and hence, the data was a little surprising and had to be analysed. | ||
| + | |||
| + | =Offences= | ||
| + | ==2017-19== | ||
| + | [https://epaper.timesgroup.com/Olive/ODN/TimesOfIndia/shared/ShowArticle.aspx?doc=TOIDEL%2F2019%2F12%2F03&entity=Ar00316&sk=40185963&mode=text Dec 3, 2019 ''Times of India''] | ||
| + | |||
| + | [[File: Spot challans issued for various offences, 2017-19; Causes of underage driving, 2017-19; Fatal accidents, 2017-19.jpg|Spot challans issued for various offences, 2017-19; Causes of underage driving, 2017-19; Fatal accidents, 2017-19 <br/> From: [https://epaper.timesgroup.com/Olive/ODN/TimesOfIndia/shared/ShowArticle.aspx?doc=TOIDEL%2F2019%2F12%2F03&entity=Ar00316&sk=40185963&mode=text Dec 3, 2019 ''Times of India''] |frame|500px]] | ||
| + | |||
| + | |||
| + | A two-wheeler crash that killed all three teenaged riders near Khuni Darwaza in central Delhi late on Saturday, highlighted three traffic offences brazenly committed across the city that endanger the lives of both the offenders as well as others — underage driving, riding without a helmet and triple-riding on two-wheelers. | ||
| + | |||
| + | The sheer number of people committing these offences can be gauged by the challans. More than 10 lakh challans have been issued this year for riding without helmets. Tickets for triple-riding were 1,58,857 till November 15 while 1,005 minor were found driving. | ||
| + | |||
| + | The three teenagers who died near Delhi Gate were speeding on a scooter that skidded off the road and hit a pole. “Parents increasingly find it okay to let their minor kids ride two-wheelers. It is a very dangerous trend,” an official said. | ||
| + | |||
| + | '''Underage driving: Cops say their hands tied''' | ||
| + | |||
| + | A senior police officer from the district stated that in 70% of the cases, minors were caught using a scooter. “Scooter is much easier for minors to ride than motorcycles. We have carried out campaigns against underage driving at various locations including Karol Bagh, Daryaganj, Patel Nagar and Delhi Gate,” he said. | ||
| + | |||
| + | Between September 1 and November 15, when the new MVA was in force, Delhi Police prosecuted 92 people for underage driving and 6,500 people for triple-riding. As many as 70,371 challans were issued for riding without helmet during this period. | ||
| + | |||
| + | These are cases which have been detected by cops, hundreds of riders go unnoticed while many others are let go as the new MV act has not been notified. | ||
| + | |||
| + | Traffic police also claimed that their hands were tied since the new motor vehicle act has not been notified by the government. “On-the-spot challans and impounding is not in our domain right now. We do challan minors as well but all are directed to the court. Whether a vehicle is to be impounded and the registration cancelled is now for the courts to decide. If we had the authority, the vehicle would be taken away then and there,” said a senior traffic official. | ||
| + | |||
| + | Police officials said many children who live in slums are found driving two-wheelers which is owned by their parents. | ||
| + | |||
| + | A special campaign carried out in a slum area on underage driving recently had an interesting fallout. Police said the cases of motor vehicle thefts reduced after a lot of juveniles were booked for driving. | ||
| + | |||
| + | A total of 1,388 motor vehicle thefts were registered up to September 1 this year, the number increased to 1,644 by December 1. On an average, around 173 cases were reported before the implementation of the new motor vehicle act, and once the drive was launched the cases reduced to 85 a month. | ||
| + | |||
| + | [[Category:Crime|D DELHI: TRAFFIC AND ROAD ACCIDENTSDELHI: TRAFFIC AND ROAD ACCIDENTSDELHI: TRAFFIC AND ROAD ACCIDENTSDELHI: TRAFFIC AND ROAD ACCIDENTS | ||
| + | DELHI: TRAFFIC AND ROAD ACCIDENTS]] | ||
| + | [[Category:India|D DELHI: TRAFFIC AND ROAD ACCIDENTSDELHI: TRAFFIC AND ROAD ACCIDENTSDELHI: TRAFFIC AND ROAD ACCIDENTSDELHI: TRAFFIC AND ROAD ACCIDENTS | ||
| + | DELHI: TRAFFIC AND ROAD ACCIDENTS]] | ||
| + | [[Category:Pages with broken file links|DELHI: TRAFFIC AND ROAD ACCIDENTSDELHI: TRAFFIC AND ROAD ACCIDENTSDELHI: TRAFFIC AND ROAD ACCIDENTS | ||
| + | DELHI: TRAFFIC AND ROAD ACCIDENTS]] | ||
| + | [[Category:Places|D DELHI: TRAFFIC AND ROAD ACCIDENTSDELHI: TRAFFIC AND ROAD ACCIDENTSDELHI: TRAFFIC AND ROAD ACCIDENTSDELHI: TRAFFIC AND ROAD ACCIDENTS | ||
| + | DELHI: TRAFFIC AND ROAD ACCIDENTS]] | ||
=Parking space for vehicles= | =Parking space for vehicles= | ||
Revision as of 16:16, 28 June 2021
This is a collection of articles archived for the excellence of their content. |
PART I: TRAFFIC
Buses
2016-18: 280% increase in illegal buses’
March 28, 2018: The Times of India
The number of buses found plying illegally in Delhi has increased by 280%, the government informed the House. The total number of buses found plying illegally has increased to 7,961 in 2017-18 (till February) from 2,084 in 2016-17 — an increase of 280%. The number of challans issued has increased to 13,962 in 2017-18 (till February) from 3,010 in 2016-17.
Congestion: The worst areas
Delhi's ten worst/ 2016
ROAD STUDY - 10 worst black spots remain unsafe, Dec 03 2016 : The Times of India
The School of Planning and Architecture (SPA) is the first university in the country to include road safety in its curriculum. The course is a part of the master's programme in transport plan ning
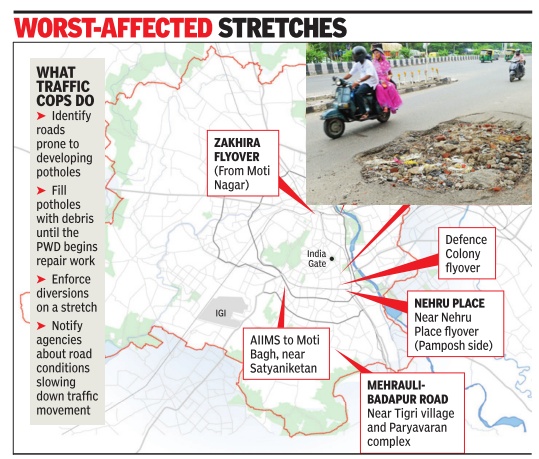
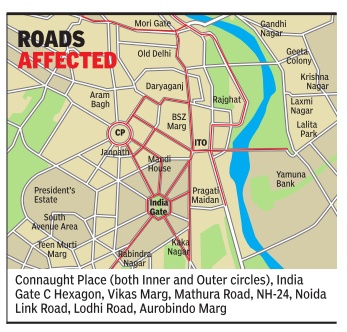
A black spot is an accident prone area. Of the 128 such spots identified by the traffic police, the worst ten were ranked according to the highest criticality by SPA.
They are: Sarai Kale Khan, Kashmere Gate Chowk (Mori Gate), Nigambodh Ghat, Mukundpur Chowk, Dr Bhabha Marg crossing, Punjabi Bagh Chowk, ISBT Kashmere Gate, Mahipalpur flyover, Shani Mandir and Shahdara flyover.
Although the number of such fatalities have gone down from 2,153 in 2010 to 1,532 in 2015, Delhi still ranks first in road deaths in the country , said K K Kapila, who heads the Interna tional Road Federation -a Geneva-based global body working for safer and better roads.
“Black spots can be made safer for motorists through accident investigation and engineering prevention techniques. Simple measures such as improving visibility by removing hazards, installation of street lighting, redesigning of junctions and roadways to accommodate the needs of pedestrians and cyclists, provision of appropriate road markings and traffic can significantly reduce road accidents,“ said Kapila.
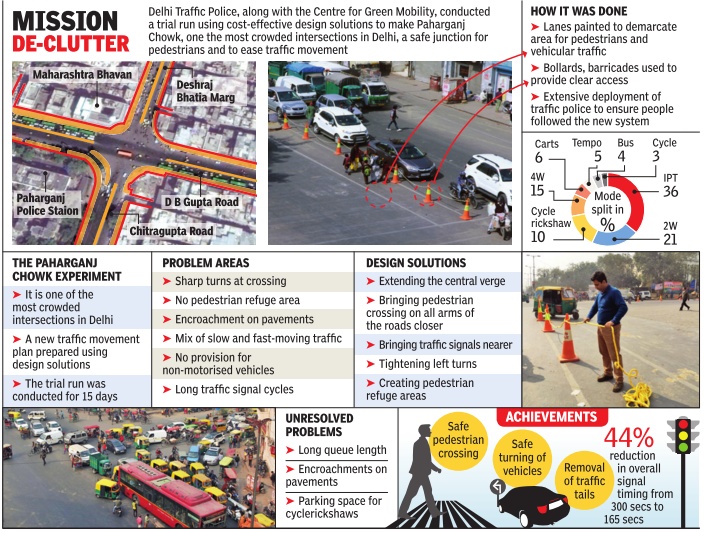
Paharganj decongestion: 2016
See graphic
Paharganj, traffic decongestion
Four choked flyovers/ 2018
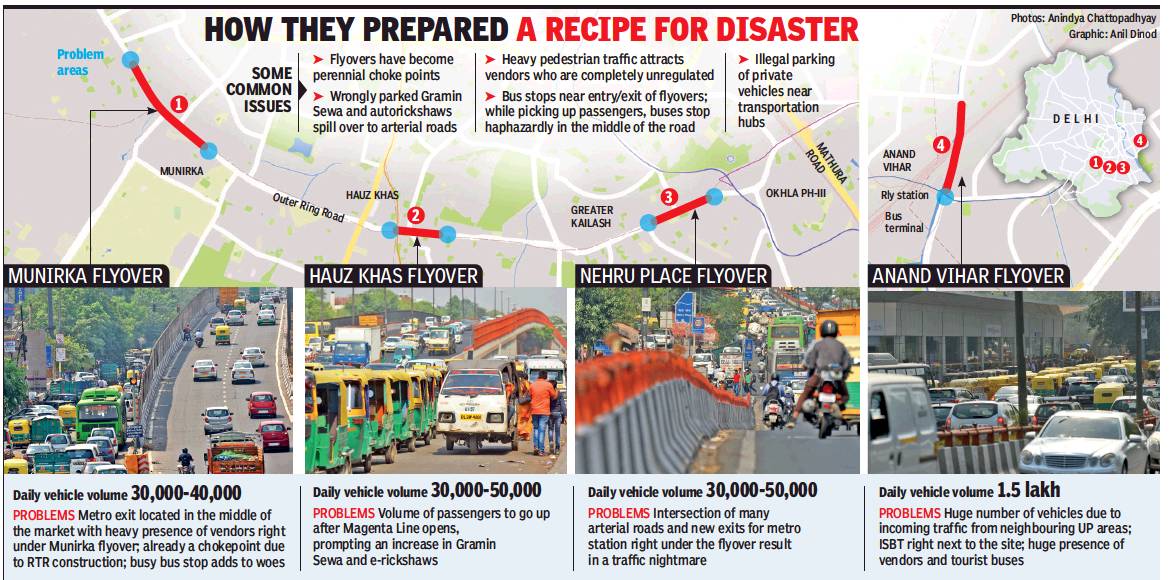
From: Paras Singh & Mayank Manohar , Why life’s a crawl at these four flyovers, May 11, 2018: The Times of India
Metro Stations, Bus Stops And Encroachments At Their Mouth Have Turned Them Into Choke Points
Meant to ease the commuter pains, flyovers, metro station and bus stop have led to high mobility corridors turning into choke points mainly because they have been crammed into the same congested space. This was evident when TOI visited four roadways in Munirka, Anand Vihar, Nehru Place and Hauz Khas.
The small entry/exit of the soon to become operational metro station, for instance, hardly elates potential train users in Munirka. In its vicinity are the massively encroached Munirka Village market and a carriageway of the flyover, and the 40-ft road shares space with a bus stop and haphazard autorickshaws parking.
“If a bus stops, the entire road is blocked for a few minutes,” complained Munirka resident Shyam Singh Tokas of the current situation. “Around 50 metres from the metro station entry is the makeshift parking point for Gramin Sewa vehicles. When the metro corridor starts functioning this month, these will obviously congregate at the entry point, turning the place into a nightmare.” For vehicles going towards the airport, this will only add to the problems caused by the ongoing RTR flyover construction.
Hauz Khas, like Munirka, remains clogged through the day. At the metro station there, soon to become an interchange point for the Yellow and Magenta lines, the authorities expect a considerable rise in footfall. Outer Ring Road there is already crowded with autorickshaws and Grameen Sewa vehicles, and the illegal hawkers that TOI found at the site only added to the obstructions on the road.
In east Delhi, the flyover near Anand Vihar metro station has a daily traffic volume of 1.5 lakh vehicles. Whatever little space is available is taken over by private buses, e-rickshaws, autorickshaws and vendors, with the bus stop near the flyover another congestion point. TOI observed buses stopping in the middle of road to allow people to board and disembark, further choking the road.
While the authorities talk about developing multi-modal transportation hubs, the lack of planning has made these intersections of different transport modes unmanageable. “How are bus stops and metro stations constructed at the mouths of flyovers?” asked Chetan Sharma, general secretary, Confederation of NCR RWAs.
Experts say that multi-utility zones should have been the way forward. But as Professor Sewa Ram of the transport planning department at the School of Planning and Architecture pointed out, “UTTIPEC created the concept of multi-utility zones, which provide space for informal sectors alongside bus stops, etc, but the lack of focus on the latter has led to this mess.” He argued that a tea vendor, for example, will always exist because of the demand at such spots but the streets design does not consider them.
Ram said that merely declaring places spaces as novending, no-parking zones doesn’t help. Space has to be provided based on utility and practicality. “A cobbler, for example, cannot be put at a place that doesn’t attract many people,” he explained. Having studied the problem, he was against roadside parking on major roads, recommending a ban on parking on the upper hierarchy roads, where the main aim is mobility.
Economic cost of traffic congestion
Rs 60,000cr a year: IIT-M
Dipak Dash, Traffic chaos costs Rs 60,000cr annually, Feb 5, 2017: The Times of India
IIT-M Study Says Loss May Touch Rs 98,000 Crore by 2030
Traffic congestion on Delhi roads costs around $10 billion or about Rs 60,000 crore annually. This is on account of fuel waste due to idling of vehicles, productivity loss, air pollution and road crashes, according to a study done by IIT, Madras.
As the vehicular population ra pidly grows in the capital, the study projects the congestion cost would increase to the tune of around Rs 98,000 crore by 2030 unless steps are taken to tackle the daily mayhem. It has recommended dedicated lane for buses since “the productivity loss due to congestion delays of commuters who use buses accounts for about 75% of total cost of congestion“.
Congestion has become a routine on Delhi's roads despite a large number of flyovers and elevated stretches coming up in the past several years. The definition of peak hours has changed as almost all major roads remain clogged from 9 am to 9 pm and it's worst in the case of roads linking Gurgaon, Faridabad, Noida and Ghaziabad. “One study by IIM-Calcutta in 2012 had shown how Rs 60,000 crore was being lost because of congestion on the entire NH network. Our study showed how the cost of congestion is similar only in the national capital,“ said Harry Raymond Joseph, one of the authors. The other two authors Gaurav Raina and Krishna Jagannathan are faculty members at IIT, Madras.
Harry said about 50% of these costs can be offset by making a single infrastructural change -dedicated bus lanes -and using smart traffic management systems. The study mentions buses are the most popular means of road transport catering to about 60% of Delhi's total demand and the average occupancy in buses is 20 whereas the average occupancy in cars and two-wheelers is 2.2 and 1.2 persons respectively .
A study conducted by Maharashtra's transport department last year had shown that one bus can replace 35 private cars and thereby reduce congestion. Another study by a global automobile major in 2015 had shown that congestion was the main reason for anxiety for at least six out of every 10 Indian drivers on the roads.
Pitching for the government to put greater emphasis on buses, the study has recommended, “In order to make dedicated bus lanes effective, it would be important to have more frequent and more comfortable buses. This could also help in shifting a fraction of the motorists to buses. Additionally , it would be prudent to employ state-of-the-art scheduling policies for buses.“
It has also suggested the need to employ intelligent traffic management systems including smart traffic lights to reduce fuel wastage.
New Year gridlocks
2017/ 18: road traffic
Somreet Bhattacharya, First day first show is all on city roads, January 2, 2018: The Times of India
Traffic Thrown Out Of Gear As 2.5L Gather At India Gate, Rajpath To Welcome 2018
The city was in a mood to party — and it showed on its roads. For more than six hours, traffic was reduced to a crawl, as more than 2.5 lakh people gathered around India Gate and Rajpath to celebrate the advent of 2018. Traffic police said the volume was several times the regular load. The roads, which were largely empty till noon, unexpectedly turned into a traffic nightmare by 3pm. People heading to the zoo or India Gate resulted in more than 4 lakh vehicles being stranded at Mathura Road — a distance that usually takes five minutes to cover.
Traffic police had deployed 40 teams around C-Hexagon: they had a crowd of 90,000 to 1lakh in mind during the peak hours. However, officers said the crowd suddenly started swelling around 2pm as the cold weather seemed favourable for an outing.
According to an estimate, more than a lakh people travelled to India Gate from neighbouring cities; the rest were from Delhi. Around 3pm, the situation took such an alarming turn that special commissioner (traffic) Dependra Pathak ordered the closure of a part of C-Hexagon near Rajpath. Traffic police officers said they roped in local cops to keep the crowd under control. “We could not allow pedestrians and vehicles to move at the same time. It could have resulted in a law and order problem,” said a senior officer.
Historian-author Rana Safvi recounted her nightmare: “I was out to attend a Safdar Hashmi memorial function at Constitution Club. I have been a regular to the event ever since my return to India. But the travel was so nightmarish — with jams extending to Noida — that it took me three hours to reach. I really don’t want to venture out again on New Year’s Day.”
Traffic officers said the sudden surge in the volume could also be attributed to better metro connectivity. “A lot of people travelled to Delhi using the newly inaugurated magenta metro line. They travelled to India Gate and Delhi Zoo in auto-rickshaws and buses thereafter,” said an officer.
Even Noida and Ghaziabad roads were choked. “I did not have the slightest of hints that it could take this long to reach from Noida to ITO. The route that I usually cover in half an hour took me four hours today,” said Radhika Awasthi, a traveller. “It looks like the first evening of this new year shall be spent on road, staring at people as they curse each other,” she said.
Some people parked their cars near C-Hexagon and walked to Rajpath. Arpit Singh Rana, who regularly travels from Dwarka to Daryaganj via Connaught Place, said his journey usually took around 45 minutes. “Since the traffic was hardly moving, I parked my car at Shiva-ji Stadium metro station and boarded a train instead. That, too, was crowded but at least I reached my destination in time,” he said.
2017/ 18: surface and metro trains
When metro stations, trains couldn’t cope with numbers, January 2, 2018: The Times of India
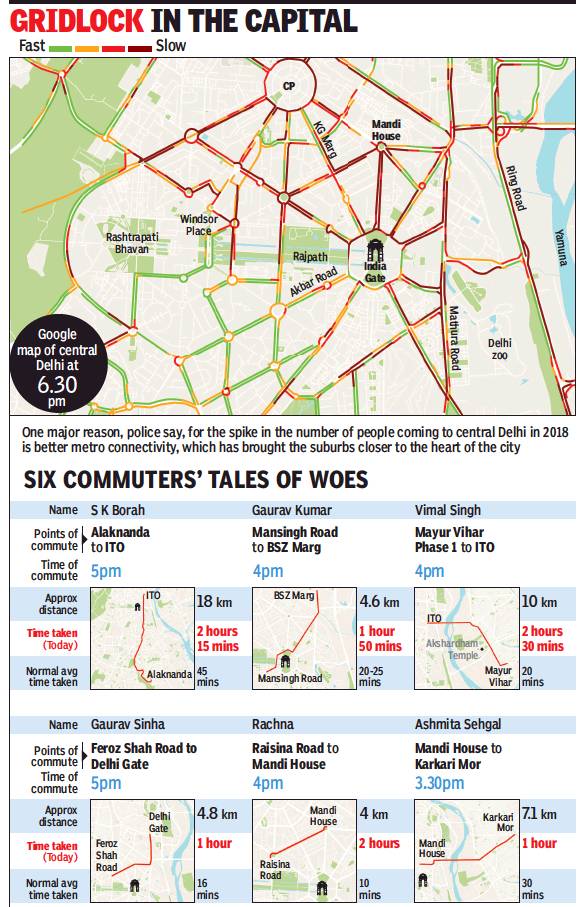
From: When metro stations, trains couldn’t cope with numbers, January 2, 2018: The Times of India
As lakhs of people descended on India Gate and Rajpath for New Year celebrations on Monday afternoon, metro stations were witness to near-apocalyptic scenes. Due to their proximity to the two locations, the Central Secretariat station saw massive rush. Mandi House, Rajiv Chowk and Patel Chowk were badly affected as well. While on any given day, around 25 lakh people use metro for travelling, the ridership went up several notches on Monday, even as DMRC refused to divulge any details.
According to traffic police, the capital roads saw several times the usual load in the afternoon — the situation wasn’t any better for Delhi Metro. The Central Secretariat station — an interchange point for Yellow Line (Samyapur Badli-Huda City Centre) and Violet Line (Kashmere Gate-Escorts Mujesar) — was the worst hit. Commuters could be seen standing in long queues and jostling with each other at the entry and exit gates. Travellers crowded the token vending machines, while many sat on the ground. “The station had become so crowded by 5pm that it was becoming difficult to even breathe. Some commuters started feeling uneasy and sat down on the floor due to exhaustion,” Anand Shrivastava, a commuter, said. “The trains were running at a very low frequency. There was so much rush that I had to skip a few before I could board one. People were pushing and shoving like crazy and it was really a case of the survival of the fittest,” he said.
Many travellers said that entry to the Central Secretariat station was closed for some time due to the heavy rush in the evening. A Delhi Metro Rail Corporation spokesperson, however, claimed that at no point was entry to the station closed. What added to the chaos was unavailability of other modes of transport, with buses and auto-rickshaws also being diverted from Central Delhi. Even app-based cabs were tough to come by, leaving metro the only viable option for many.
While Shrivastava did manage to board a train after much struggle, many others were not as lucky. “There must have been more than a thousand people outside the station, waiting to enter. Just getting inside was a battle. It was claustrophobic,” Deepak Kumar, another commuter, said. “Most of those travelling by metro on Monday were not regular users and were queuing up to buy tokens as they didn’t have smart cards. As a result, queues at token counters and ticket vending machines were serpentine. After seeing the huge crowd inside, I lost the courage to travel by metro and decided to come out. The crowd was so huge that it took me 20 minutes to just leave the station,” he said.
Sudipta Chakraborty, another hassled commuter TOI caught up with, said: “From outside Mandi House station, you could only see a sea of heads trying to climb down the stairs. Inside, it was total chaos, particularly on the platform where the Faridabad-bound trains arrive. Most commuters were finding it difficult to get tokens from the vending machines and there was no one from DMRC to help us out.”
People complained that apart from the rush, trains were running at slow speed and the frequency was low too. They also said that trains were stopping at all stations for unusually longer duration. “I had to wait for 15 minutes to board a train from Vaishali around 4.30pm when, on a normal day, a train arrives every three minutes. The rush was unusual even though Vaishali is a terminal station and it is not difficult to find a seat there. Monday was quite different though,” said Manisha Sharma, a regular traveller.
Roads in Noida and Ghaziabad, too, were choked with several vehicles moving bumper to bumper — and it wasn’t much of a surprise that stations in these locations were teeming with people.
Drunk drivers
1,745 drunk drivers booked — double the number last year, January 2, 2018: The Times of India
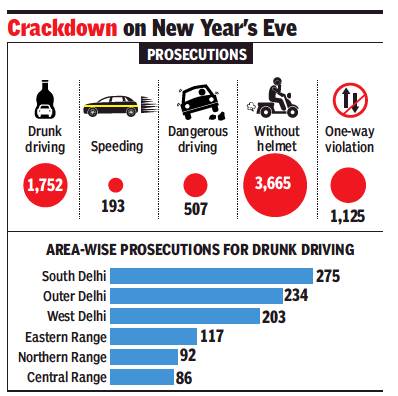
From: 1,745 drunk drivers booked — double the number last year, January 2, 2018: The Times of India
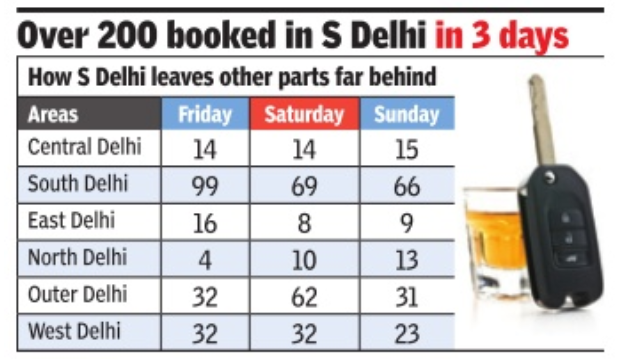
The traffic police booked 1,745 drunk drivers during New Year’s Eve on Sunday, double the number they had booked in 2016. The maximum number of prosecution was from south Delhi.
Special commissioner (traffic) Dependra Pathak said regular traffic picket teams were asked to keep strict vigil on any vehicle leaving the market areas. “We had asked our men to ensure zero tolerance for drunk driving and deployments were made across the city to conduct surprise checks. This resulted in the higher number of prosecution,” said Pathak.
However, some Delhiites managed to bypass checks by allowing women to drive vehicles to avoid being flagged down by cops. Police officers said that about 10 women had been booked. In 2016, 889 people were booked for drunk driving.
In south Delhi, 275 drunk drivers were booked, out of which 33 were challaned at four pickets in Kotla Mubarakpur. Police officers said that a picket on Nelson Mandela Marg had caught the highest number of tipsy drivers with 18 challans.
The traffic police set up 433 check posts, out of which 125 were for checking drunk driving. Police officers said that most drivers came up with excuses such as ‘drinking for the first time’ and ‘taken just a few sips’ to evade being challaned. The police have also suspended the licence of all violators. Some of the drivers were even asked to park their cars and hire cabs after they were found to be drunk beyond the permissible limits.
Senior officers said that before midnight, 745 drivers were booked for drunk driving while 1,000 were booked after midnight. In total, 16,420 people were booked for other offences across the city.
According to the traffic police, areas around Greater Kailash, Saket and Safdurjung markets were found to be prone to drunk driving, with 30 people being booked in these areas on Sunday night. More than 40 people were booked at check posts near Vasant Vihar and Vasant Kunj.
Police pickets outside religious establishments were asked to be alert about stunt biking in Lutyens’ Delhi. Across the city, 4,033 people were booked for riding without helmets and dangerously driving two-wheelers.
A drive was also conducted on January 1 after large numbers of people were found to have gathered at eateries across the city.
In order to prevent revellers from driving drunk, the traffic police had put up banners across the city wishing drivers a happy new year while reminding them about prosecution for drunk driving. It had also formed teams along with the local police to book drunk drivers for dangerous driving.
NCR’s worst: Ghaziabad, Noida roads/ 2017
Shalabh, Gzb, Noida roads most unsafe to travel: Report. January 2, 2018: The Times of India
The two cities in the national capital region—Ghaziabad and Noidaapart from Lucknow, are extremely unsafe and accounted for maximum fatalities in road mishaps in Uttar Pradesh in the past one year, a data compiled by the state police show. The data—collected by police to curb road accidents in the state—further reveal that last year, the highest number of road accidents occurred in Indirapuram and Sahibabad in Ghaziabad and in Sector 20, Noida.
While the figures of fatalities are still being collected, it show that the highest number of accidents took place in Lucknow, Ghaziabad, Gautam Budh Nagar and Kanpur City districts, in that order.
Traditionally, Kanpur has remained the most vulnerable for road users in UP. The department is now contemplating to rope in experts to improve road design features at the identified blackspots in NCR.
Director of transport at World Resources Institute, India, Amit Bhatt said, “Vehicle population is increasing at an alarming rate in Delhi and NCR. Most urban planning is focused on high-speed commute. While four-wheelers do benefit, a lot of times, twowheeler riders or cyclists and pedestrians are at the receiving end since their safety is largely overlooked.”
While majority of accidents in Lucknow took place on outskirts, most SOS calls in Noida originated from Sector 20 police station area. In Ghaziabad, Indirapuram and Sahibabad accounted for most accidents.
Bhatt stressed that accidents occur frequently at places like Noida Bypass, which connects Noida City Centre with Dadri, as motorists start speeding up.
ADG (law and order) Anand Kumar said, “We are compiling road accident and casualty figures and would share our findings with concerned departments. Experts would be roped in to give recommendations to government.”
In Noida, traffic inspector Layak Singh said that the maximum number of accidents are reported from the expressway area and hence, the data was a little surprising and had to be analysed.
Offences
2017-19
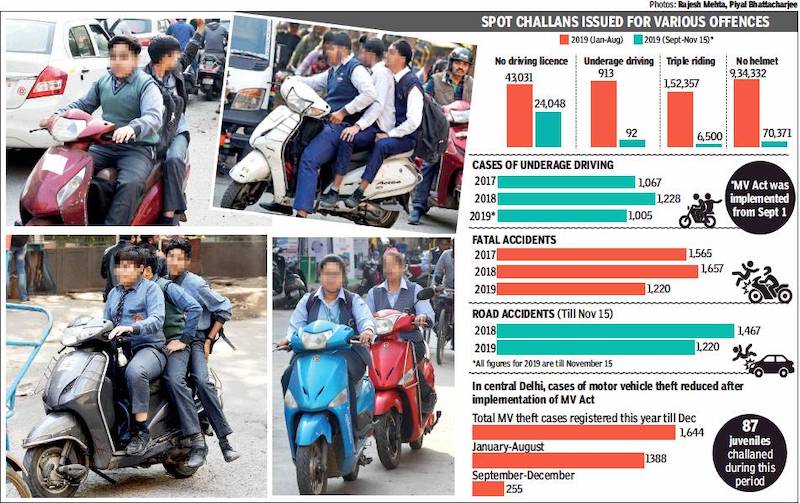
From: Dec 3, 2019 Times of India
A two-wheeler crash that killed all three teenaged riders near Khuni Darwaza in central Delhi late on Saturday, highlighted three traffic offences brazenly committed across the city that endanger the lives of both the offenders as well as others — underage driving, riding without a helmet and triple-riding on two-wheelers.
The sheer number of people committing these offences can be gauged by the challans. More than 10 lakh challans have been issued this year for riding without helmets. Tickets for triple-riding were 1,58,857 till November 15 while 1,005 minor were found driving.
The three teenagers who died near Delhi Gate were speeding on a scooter that skidded off the road and hit a pole. “Parents increasingly find it okay to let their minor kids ride two-wheelers. It is a very dangerous trend,” an official said.
Underage driving: Cops say their hands tied
A senior police officer from the district stated that in 70% of the cases, minors were caught using a scooter. “Scooter is much easier for minors to ride than motorcycles. We have carried out campaigns against underage driving at various locations including Karol Bagh, Daryaganj, Patel Nagar and Delhi Gate,” he said.
Between September 1 and November 15, when the new MVA was in force, Delhi Police prosecuted 92 people for underage driving and 6,500 people for triple-riding. As many as 70,371 challans were issued for riding without helmet during this period.
These are cases which have been detected by cops, hundreds of riders go unnoticed while many others are let go as the new MV act has not been notified.
Traffic police also claimed that their hands were tied since the new motor vehicle act has not been notified by the government. “On-the-spot challans and impounding is not in our domain right now. We do challan minors as well but all are directed to the court. Whether a vehicle is to be impounded and the registration cancelled is now for the courts to decide. If we had the authority, the vehicle would be taken away then and there,” said a senior traffic official.
Police officials said many children who live in slums are found driving two-wheelers which is owned by their parents.
A special campaign carried out in a slum area on underage driving recently had an interesting fallout. Police said the cases of motor vehicle thefts reduced after a lot of juveniles were booked for driving.
A total of 1,388 motor vehicle thefts were registered up to September 1 this year, the number increased to 1,644 by December 1. On an average, around 173 cases were reported before the implementation of the new motor vehicle act, and once the drive was launched the cases reduced to 85 a month.
Parking space for vehicles
2012-16
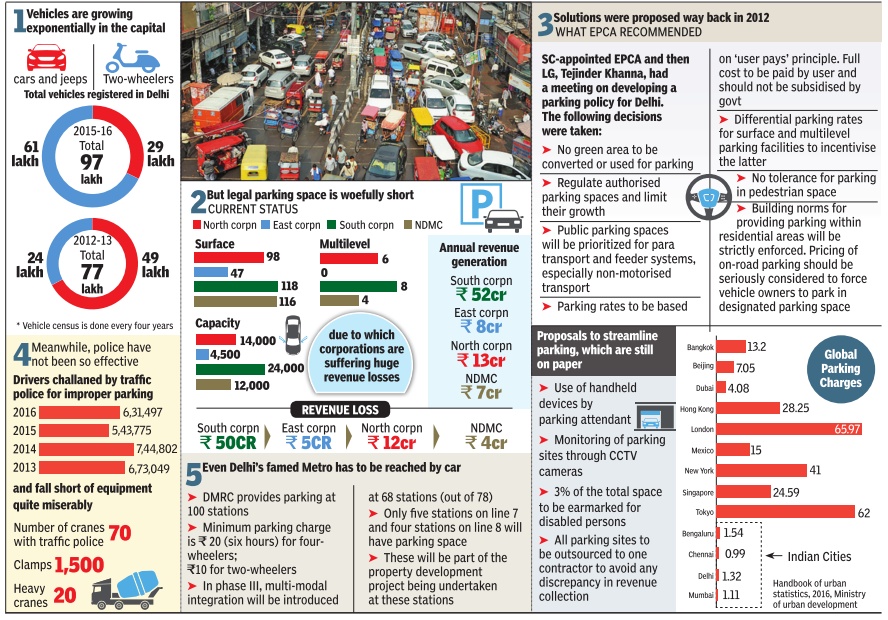
See graphic:
Number of vehicles, 2012-16, current status of legal parking space, solutions proposed in 2012, drivers challaned for improper parking, 2013-16, parking at metro stations in Delhi and global parking charges
2018/ Khatara Gadi (Junk Vehicle) app(lication): to check parked junk vehicles
The Delhi government aims to launch a dedicated app to check the presence of junk vehicles parked on city roads in accordance with the provisions of the Capital’s first comprehensive parking policy, sources claimed on Saturday.
Tentatively named the ‘Khatara Gadi (Junk Vehicle) app’, the programme, through linkage with a centralised database of vehicles registered here, will be equipped to provide information about the age of a vehicle based on its registration number, the source added.
“Citizens can use the app to click pictures of such vehicles... The app will use geotagging to tow away such vehicles, which can later be disposed at junking facilities,” said the source, adding that the Transport Department hopes to launch the app next week.
The move is in line with the soon-to-be-notified Delhi Maintenance and Management of Parking Rules, 2017, which aims to enforce strict fines and even start criminal proceedings against vehicle owners found in violation of its provisions.
The policy mandates impounding of junk vehicles — that is, petrol vehicles that are over 15 years old and diesel vehicles more than 10 years old. Besides tying up with a Public Sector Undertaking (PSU) with the wherewithal to dispose such vehicles at a facility coming up in Greater Noida, the policy also aims to empower private entities to take up their disposal.
Free up space
The idea, according to the source, is to free up as much space as possible to provide parking, especially in the vicinity of residential areas, by removing junk vehicles which have either been abandoned by owners who have moved away or vehicles which are in junk condition.
The Department will initially go after junk vehicles parked across the city, following which it intends to provide the service to the general public.
The public will be able to contact the Department for de-registration of junk vehicles, before being guided through the process of disposing these at designated facilities.
The policy in this regard, according to the source, is in the process of being chalked and is expected to be submitted for review to the Delhi government by the end of January.
According to the source, the Delhi government is mulling a tie-up with the MSTC, a PSU under the Union Steel Ministry and engaged in recycling waste, at the Greater Noida facility.
Speed of traffic flow
Average speed in 2017
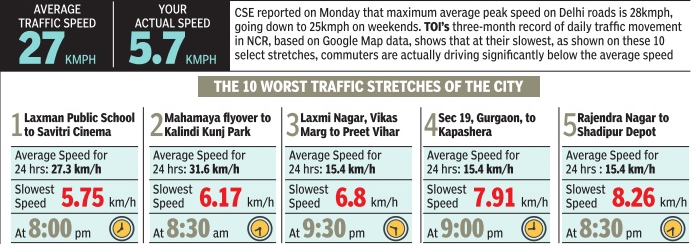
The ten worst traffic stretches in Delhi, 2017: part 1;
From: Average traffic speed on the ten worst road stretches in Delhi in July 2017, Jul 12 2017 : The Times of India (Delhi)
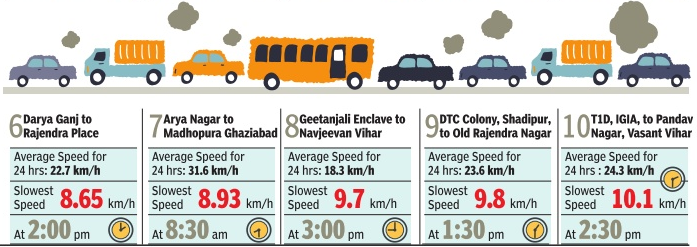
From: Average traffic speed on the ten worst road stretches in Delhi in July 2017, Jul 12 2017 : The Times of India (Delhi)
See graphics:
Average traffic speed and your actual speed;
The ten worst traffic stretches in Delhi, 2017: part 1
The ten worst traffic stretches in Delhi, 2017: part 1
Trucks entering Delhi
2015-17: Massive under-reporting to evade environment compensation charge
From: Jayashree Nandi, EPCA finds ₹800cr ‘shortfall’ in collection of green cess, March 27, 2018: The Times of India
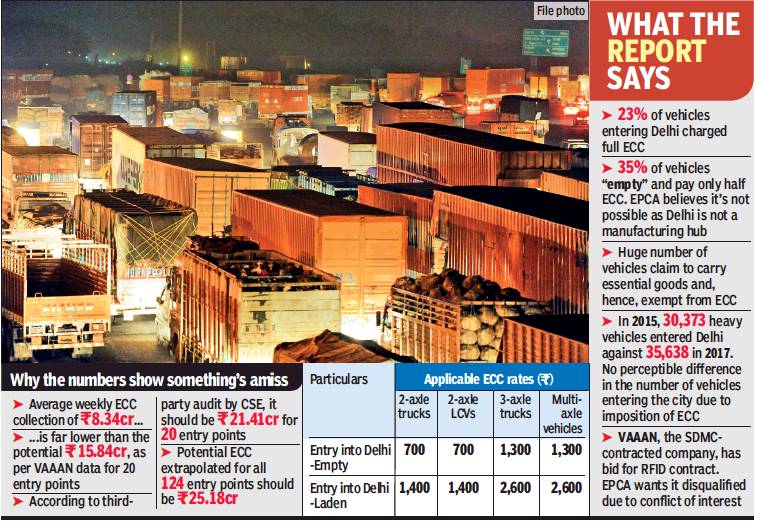
The SC-mandated Environment Pollution Control Authority (EPCA) has found massive under-reporting of the number of trucks entering the city, leading to an annual shortfall of Rs 500-800 crore in the amount collected as environment compensation charge (ECC) by the concessionaire but not deposited.
In a report submitted before the Supreme Court on Monday, EPCA said the calculation of the shortfall was based on two independent audits conducted to ascertain the number of trucks coming into Delhi, one of which was commissioned by the South Delhi Municipal Corporation that has been tasked with collecting the ECC.
ECC was imposed by SC in 2015 to reduce air pollution by curbing the number of heavy vehicles entering Delhi. It had also directed that the ECC collected be used for pollution control.
EPCA said, based on the SDMC-contracted audit, the weekly potential ECC collection should be Rs 15.8 crore at the minimum while only Rs 8.3 crore was being deposited. The second audit, conducted by Centre for Science and Environment estimated a much higher shortfall .
EPCA said a portion of the green cess isn’t being deposited
Consider withdrawing pollution cess, for now: EPCA
SC-Mandated Body Finds It Improbable That 35% Of Vehicles Running Empty And, Thus, Paying Half ECC
EPCAcalled for temporary withdrawal of collection till a radio frequency identification system is set up.
Alternatively, EPCA said SDMC’s toll concessionaire should be directed to deposit the “missing” amount from the date of issuing the contract in October 2017. In 2017, EPCA had directed SDMC to commission a traffic study to ascertain the total number of trucks entering Delhi. Following this, SDMC awarded the study contract to VAAAN Infra Pvt Limited. The traffic study was conducted in two phases October 3 to October 17 and October 25 to November 8. EPCA then requested CSE to commission a third-party audit of the VAAAN study and independent verification of the footage submitted by them.
The audit revealed that there was “under-reporting and misclassification of the vehicles which has an impact on calculation of ECC,” the report states. “We will examine the EPCA report and then respond. We (SDMC) get a fixed amount from the ECC project annually as per provisions in the contract with the private concessionaire,” said a senior SDMC official.
The VAAAN study was conducted at 20 of the 124 entry points to Delhi that account for 85% of the heavy vehicles entering the city. It estimated that about 30,292 heavy vehicles daily or 9 lakh heavy vehicles a month were entering Delhi. When extrapolated for 124 entry points, the estimate comes to about 35,638 vehicles daily.
CSE’s independent study conducted at eight of the 20 locations selected by VAAAN found about 44,811 vehicles entering from these 20 points and when extrapolated to 124 entry points, the total number of heavy vehicles was estimated at 52,719 daily.
EPCA calculations found a gap of nearly Rs 800 crore annually. “The current system that is based on cash collection and allows for human discretion is extremely flawed, if not outright corrupt,” EPCA says.
The SC in 2016 had directed that SDMC install a RFID system at entry points. But SDMC is yet to award the contract. The RFID project tender was floated on November 8, 2017. The bid due date was delayed twice and bids were received only on January 31, 2018.
The other discrepancy EPCA noted was that the VAAAN study found only 23% of heavy vehicles were laden and paying full ECC while 35% of the vehicles were running empty and paying half. EPCA thinks this is unlikely because Delhi is not a manufacturing hub where so many empty trucks would enter every day.
How SDMC lost crores by dragging feet on RFID system
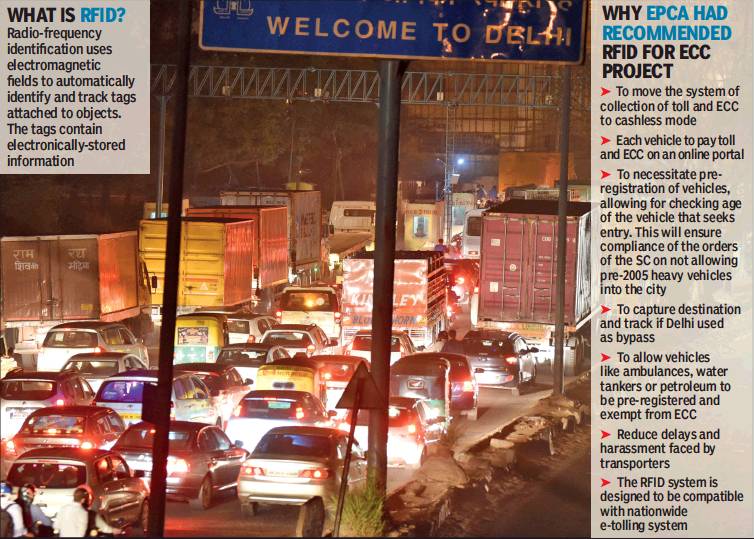
From: Jayashree Nandi, Green cess: How corp lost crores by dragging feet on RFID system, March 28, 2018: The Times of India
Delay May Have Led To Under-Reporting Of Trucks Entering The City
The SC-mandated Environment Pollution Control Authority, in its recent report to the Supreme Court, has recalled how the south corporation has still not managed to implement a radio frequency identification system for charging environment compensation charge from trucks entering the city.
This delay may have led to the under-reporting of the number of trucks entering the city and, consequently, a major shortfall in the collection of ECC from trucks, as reported by TOI on Monday. The RFID project has still not been awarded because of complications in the tendering process.
In October 2015, the SC — while imposing ECC on all commercial vehicles entering Delhi — had also directed the installation of RFID at least nine entry points by November of the same year. Again, in January 2016, it stressed on the urgency of implementing RFID for ECC.
“We leave it open to the authority concerned to examine the feasibility of any better arrangement … We only hope that an appropriate decision on the subject will not be delayed any further and would expect the authorities to file a status report by the next hearing,” the apex court had said.
The top court saw the RFID system as a solution to plugging leakages and corruption. EPCA members believe had RFID been implemented on time, it could have prevented leakage of ECC money to the tune of nearly Rs800 crore.
But SDMC had to terminate its contract with its toll contractor, which was also supposed to implement RFID. Harish Salve, amicus to SC on air pollution, had contended that allowing the toll contractor to install RFID might not be the right thing because it would leave the system susceptible to manipulation.
According to senior SDMC officials, they were initially apprehensive about RFID because NHAI’s experience with RFID has not been very successful. “Only 18% of the NHAI tolls are on RFID. So, we had hired a consultant suggested by EPCA that made the tender document for us in 2017. They made it on a build-operate-transfer mode, which required the successful bidder to invest, design, construct and operate RFID for five years. We received only two bids. That is why we informed EPCA that, maybe, this mode was not favourable and we are not getting enough bidders,” a senior SDMC official said.
SDMC wanted the tender terms reworked to attract wider participation from bidders. The same consultant designed tendering under the Engineering-Procurement-Construction (EPC) mode, which required the successful bidder to undertake the design and construction of the RFID Project in its entirety and operate it for five years. Under this mode, the RFID contractor would get paid for the construction of the project on a milestone basis, during the construction phase itself.
Further, for discharging its obligations during the operations period, the RFID contractor would be entitled to a monthly fee from SDMC for the entire operations period. The RFID project tender (in EPC mode) was floated by SDMC on November 8, 2017. “The bid due date was postponed twice by SDMC and the bids were received on January 31. EPCA understands the process is underway and the contract will be awarded soon,” EPCA stated in its recent report to SC.
But SDMC officials said it was unlikely that the project would be awarded soon. Of the five bidders in the new mode, two were disqualified due to “conflict of interest”. One of them is the company that conducted a traffic survey for SDMC to ascertain the number of trucks entering Delhi. EPCA pointed that giving the project to them would clearly be a conflict of interest. But the company moved high court against SDMC for faulty tendering and has now moved SC. “The next date of hearing in SC is April 4. We cannot award the project until we have a verdict from SC,” a senior SDMC official said.
But EPCA members said awarding the project to the highest bidder would mean the concessionaire will have interest in ensuring more trucks come in and more ECC is collected. “The whole purpose of ECC as a pollution curbing intervention will be defeated,” an EPCA member told TOI.
“Even if we have RFID, there will be leakages since RFID cannot help ascertain empty vehicles. Instead, our lawyers have suggested that the highest bidder be awarded the project,” he added.
Vehicles, number of
Increase in 2015-16
Among vehicles, autos clock highest growth in 2015-16, March 8, 2017, The Times of India
Delhi saw a 9.94% increase in the number of vehicles in 2015-16. Among them, autorickshaws clocked the highest growth at 142.72%. Interestingly , the period also saw a phenomenal annual growth in buses--74.19%, and ambulances--95.81%. These are the highlights of the Delhi government's Economic Survey 2016-17.
According to the survey report, during 2015-16, the number of vehicles per 1,000 population was 530, a significant jump from 491the previous year. It was only 317 a decade ago. In fact, the annual growth rate of vehicles in 2005-06 was 8.13% as opposed to 9.94% in 2015-16. The previous year it was only 6.89%. Incidentally , according to the transport department, the number of vehicles registered in Delhi has crossed the one-crore mark by December 2016.
Meanwhile, the Delhi Metro has expanded its network, with phase III set to take it to over 300km. The survey reveals that the two new corridors of phase III are scheduled to become operational this year, along with the extension of li ne 5 to Bahadurgarh. The Dwarka-Najafgarh corridor is set to be commissioned in 2017 as well. The Economic Survey also lists the addition of 517 buses to the Delhi Metro feeder bus system.
The survey shows a steady fall in the ridership of DTC buses. The average daily ridership was 35.37 lakh in 2015 16. This is a significant fall from the 46.77 lakh commuters in 2012-13 or even the 38.87 lakh who took bus rides in 2014-15. Meanwhile, the number of cluster buses in 2015-16 was 1,490 with a daily ridership of 10.61 lakh. The fleet utilisation was 98.84% in the cluster bus system as opposed to the 83.63% of DTC buses.
The survey also makes a point about the Delhi government coming up with more bus rapid transit (BRT) corridors, but does not give details on these projects. It lists the Ambedkar Nagar-Moolchand BRT as an operational corridor, though it was dismantled last year. The survey says that renovation work of the Anand Vihar and Dwarka ISBTs have been handed over to PWD while work on the Sarai Kale Khan ISBT is being undertaken in two phases.
2017: more than 1 crore vehicles
Delhi now has over 1 crore vehicles, June 5, 2017: The Times of India
The number of registered vehicles in the national capital has crossed the one crore mark, amid growing concerns over rising pollution levels and poor traffic conditions in the city.
Data accessed from the transport department of Delhi government puts the total number of registered vehicles at 1,05,67,712 till May 25. There are 31,72,842 registered cars in the city .
The biggest chunk of the registered vehicles -66,48,730 -in the city is, however, motor cycles and scooters that are known as major air polluters due to poor emission standards.
Other major categories of registered vehicles in the national capital include goods carriers (2,25,438), motor cab (1,18,424), moped (1,16,092), passenger three wheelers (1,06,082), goods three wheelers (68,692), buses (35,332), erickshaws (31,555) and maxi cabs (30,207), the data said. Several reports suggest that vehicular pollution is one of the major contributors in polluting the air in the national capital.
Concerned over the in creasing level of air pollution in Delhi, the National Green Tribunal had on November 26, 2014 barred all vehicles private cars, bikes, commercial vehicles, buses and trucks over 15 years old from plying in the capital.
In its recent audit study , EPCA (Environmental Pollution, Prevention and Control) had also found that Delhi has lakhs of vehicles plying without the mandatory `pollution under control' certificates.
The blatant violations, that potentially imperil the health of millions, have put the spotlight on around 970 centres in the city , that are certified to check the emission content of around 70 lakh vehicles in the city , the report had stated.
2017: A vehicle for every second resident; e-ricks grow 838%
March 20, 2018: The Times of India
There is a vehicle for every second person in Delhi now, with the vehicular count going beyond the onecrore mark in the capital. In 2016-17, the city saw a growth of nearly 7% in vehicles compared to 2015-16, states Economic Survey of Delhi.
The survey reveals that Delhiites’ dependence on private transport increased in 2016-17 while the number of people using public transport buses declined during the same period.
Following the survey data, it may be inferred that a sizeable number of population has moved from public transport to two-wheelers. Hovering around 66 lakhs, twowheelers now constitute 63.6% of all vehicles in the city. The category saw an 8.2% growth in 2016-17 in comparison to 2015-16. The number of cars, at 31.5 lakhs, recorded a growth rate of 5.6%.
Though the overall growth rate of vehicles in Delhi slowed down in 2016-17, the number of vehicles per 1,000 population has still gone up. The number of vehicles grew by nearly 7%, less than the growth rate of nearly 10% witnessed in 2015-16. The number of vehicles per 1,000 population, however, grew from 530 in 2015-16 to 556 in 2016-17.
Para-transit too witnessed a significant growth in 2016-17. The number of taxis has grown by 29.9% with nearly 1.2 lakh registered cabs in 2016-17 over 91,073 in 2015-16. The count of autos, however, remained static, hovering around one lakh, due to a cap on their number.
While the metro, despite a dip following the fare hike, has emerged as the backbone of public transport in Delhi, the survey reveals that vehicles meant for last-mile connectivity has seen an increase. The number of other passenger vehicles, including erickshaws and maxi cabs, has grown by 838.4%, as their numbers have risen from just 6,368 in 2015-16 to 59,759 in 2016-17. A major reason behind this jump is that erickshaws are now being registered with the transport department.
Delhi Transport Corporation (DTC), on the other hand, has seen a dip not only in the ridership but also in the number of buses in its fleet. From 46.8 lakh passengers in 2012-13, the number has come down to 31.5 lakhs in 2016-17. The number of DTC buses on road has also come down to 3,547 in 2016-17 from 3,817 in 2015-16.
In terms of fleet utilisation, 1,757 cluster buses are doing much better at 98.1% compared to Delhi Transport Corporation ’s 85.1%.
2018, 19: details of vehicle-types
SOMREET BHATTACHARYA, July 18, 2019: The Times of India
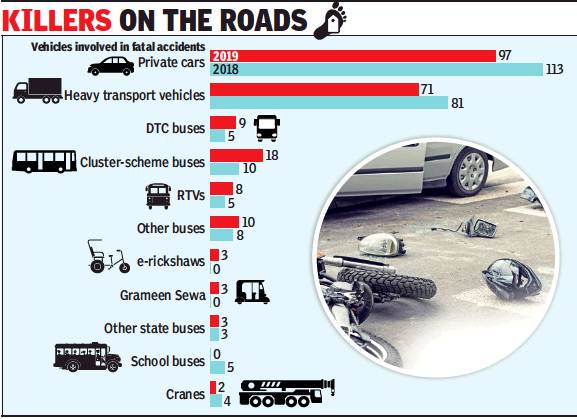
From: SOMREET BHATTACHARYA, July 18, 2019: The Times of India
There has been an 80% spurt in fatalities caused by cluster and DTC buses this year, in a clear indication of the rising danger from rashly driven buses in the capital, Delhi Police data reveals.
The data also found private cars to be the biggest killers on the roads with 97 fatalities, followed by heavy transport vehicles and trucks with 71 fatalities.
Cluster buses were found to be involved in 18 fatalities till May 31 this year, compared with 10 during the same period in 2018. DTC buses were involved in nine fatalities, as against five in 2018. Together, public transport buses figured in 27 fatalities in the five-month period, sharply up from 15 in the same period last year. The number swelled to 45 when crashes caused by RTVs and state transport buses were added. This is nearly double the figure for the same perod in 2018.
Delhi has about 5,000 buses on the roads on any given day. The drivers who are supposed to be trained in sticking to the left lane are often found violating lane rules and jumping signals. It was found that most drivers employed by DTC or DIMTS had earlier driven private vehicles or were semi-skilled. Even though the bus operators claim to have sensitised them on handling heavy vehicles, the drivers often seem to turn a blind eye to rules.
Most cluster buses driven way above the speed limit
Earlier this week, a woman was killed and four others seriously injured when a cluster bus mowed through several vehicles on D B Gupta Road in central Delhi. Though the driver claimed that the brakes had failed, passersby told cops that the driver was reeking of alcohol. Cops are awaiting forensic reports to establish the cause of the accident.
“Since no incentives are given to drivers for reaching early, they seem to be racing on the roads purely to save time before the next trip,” said a police officer. During the peak hours, cops rarely stop drivers for an offence, since flagging down a bus would stall traffic during the busy period. Police officers say most of the violations take place during peak hours when traffic volumes are heavy. While their counterparts in the DTC face serious consequences if their buses are found to be involved in accidents, cluster bus drivers have a more lenient penalty. Even though the government claims to have fitted GPS devices to track their movements on a map, in reality none of these devices are functional.
“By tracking cluster buses through GPS, we have found that they usually speed at around 60 kmph despite the prescribed limit being 40 kmph,” a transport department official said.
PART II: ROAD ACCIDENTS
Accident-prone areas
2018
Somreet Bhattacharya, July 12, 2019: The Times of India

From: Somreet Bhattacharya, July 12, 2019: The Times of India
The list of the worst accident-prone stretches of 2018 prepared by Delhi Traffic Police now has two new additions, Bhalswa Chowk and Mukarba Chowk. Both these places have been under the scanner of road planners due to their faulty designs. Almost 50% of people who died in accidents last year were pedestrians who were mowed down while crossing the road.
While the stretch near Kashmere Gate ISBT remains the deadliest in the city, Mahipalpur flyover and Mathura Road near Nizamuddin have also got a prominent place in the list due to changes in the road geometry last year. Traffic police are in the process of preparing a research report that will provide a detailed analysis of these stretches and the reason for a spike in accidents. Police said the blind bends near Nigambodh Ghat and Hanuman Temple near Kashmere Gate ISBT have led to fatal accidents involving speeding drivers. Last month, a Maruti Ertiga driven by a businessman overturned on the footpath while taking a turn at the bend killing a homeless man. A number of measures to reduce speed at these bends were proposed, but none of them were implemented. Bhalswa Chowk and Mukarba Chowk on Ring Road recently turned into speeding zones after the inauguration of the signal-free elevated stretch. “The lack of measures for slowing down traffic emptying onto Ring Road from the nearby colonies of Burari, Jahangirpuri and Bhalswa Dairy has been creating conflict zones for slow and fast moving vehicles and turning it into an accident-prone area,” said a police officer.
Moreover, as the speed on stretches like Mathura Road and Outer Ring Road has gone up considerably after the completion of Delhi Metro projects, it has ended in high pedestrian fatalities. Police have suggested creation of multiple pedestrian crossover points on these stretches to reduce the number of accidents.
The study has also pointed out towards an increase in the number of deaths of cyclists, especially in morning hours. Africa Avenue and Alipur Road were found to be the two most dangerous roads for cyclists.
A similar study conducted last year found that 845 fatal crashes occurred after dark, while 720 happened during the day. Even though the peripheral expressways have reduced the number of goods vehicles in the city, most of the accidents were found to have occurred between 7pm and 2am.
Poor lighting on the roads is the reason behind almost half the accidents, followed by potholes and encroachments, police said. Once the final report is prepared, the list of accident-prone stretches will be shared with the roadowning agencies. A road safety advocacy group will also be roped in to suggest ways to reduce the number of fatalities.
Averting Accidents
Re-engineer 10 black spots: SPA
Rumu Banerjee, Road to redemption for 10 black spots, Jan 24, 2017: The Times of India
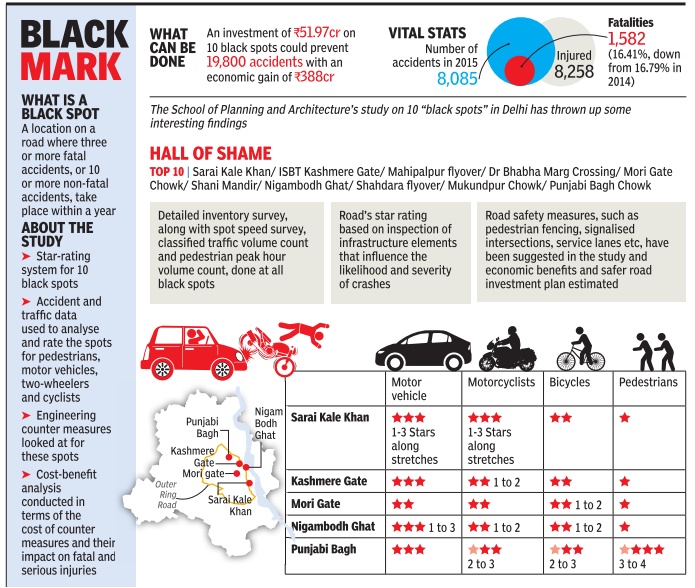
Black spots, or locations on roads where three or more fatal or alternately 10 or more non-fatal accidents take place every year, can be reengineered to save both lives and money, says a study carried out by the School of Planning and Architecture.
This could be of significance in a city that has seen the number of accidents spiralling. In 2015, Delhi Police reported 8,085 accidents, of which 1,582 involved fatalities. The SPA study says that simple engineering counter-measures could avert thousands of such accidents. Carried out on 10 “black“ spots, the research determined that an investment of Rs 51.97 crore could help prevent 19,800 accidents and result in economic gains of Rs 388 crore over 20 years.
Prof PK Sarkar, under whose supervision the SPA study was conducted, said, “The findings provide a roadmap on how to reengineer these black spots, prioritise them and help bring down accident rates drastically.“ The black spots studied were originally identified by Delhi Police. “These include the heavily crowded Sarai Kale Khan, Kashmere Gate ISBT, Mahipalpur flyover, Shani Mandir, Nigam Bodh Ghat and areas like Punjabi Bagh Chowk,“ said Sarkar.
Using stars, the study rated the 10 black spots in terms of severity and likelihood of accident for different categories of users -motor vehicles, two-wheelers, cyclists and pedestrians. Among factors surveyed were spot speed, classified traffic volume count and pedestrian peak hour volume count.
Sarkar said that the star rating was achieved through a software developed by the International Road Assessment Programme, a non-profit organisation, and was based on inspection of infrastructure and elements that influenced the likelihood of accidents and severity of crashes on the locations. Lower the rating, the more dangerous that site was to that category of user.
“After the rating, the model is calibrated, and an estimate of the existing number of deaths and serious injuries at any point on the network can be made,“ explained Sarkar. This information can be used to examine the potential death and serious injury reduction that is possible through proven engineering counter measures at any location.
After finding that 52% of the road stretch at the 10 sites returned 3-star rating for vehicles, 50% had 2-star rating for two-wheelers, 38% had a 1-star rating for pedestrians while 34% had 2-star rating for bicycles, the study concluded, according to Sarkar, “An investment of Rs 49.97 crore for road safety counter measures at these spots could save 1,981 fatal and 17,890 injurious accidents in 20 years.“
The study, carried out by Shawon Aziz, discussed remedial measures too.Of these, high-cost solutions included adding or widening lanes, gradeseparated crossings for pedestrians or exclusive service and cycle lanes. Introduction of road safety barriers, pedestrian facilities, traffic calming measures or signalised intersections constituted mediumcost remedies, while lowcost steps involved delineation, use of retro-reflective markings, guideposts, warning signs, etc
Buses and accidents
2011-18
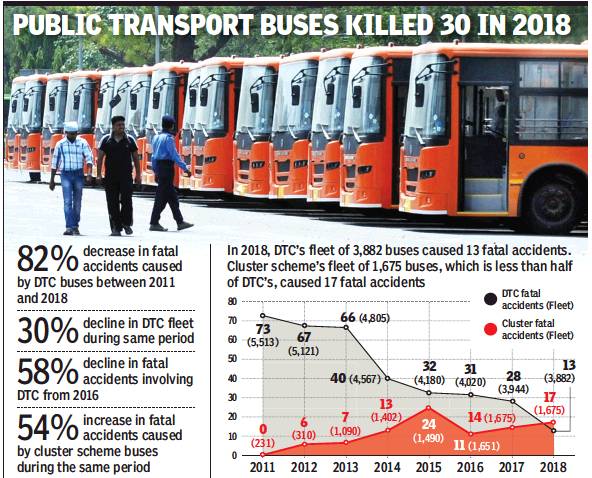
From: Sidhartha Roy, GPS tracking can’t take orange cluster buses off their killer run, February 16, 2019: The Times of India
Though DTC’s Fleet Is Twice As Big, Its Fatal Crash Numbers Are Going Down
Each one of the 1,675 orange-coloured cluster buses running on capital roads is equipped with a functional GPS device, or so officials claim. The fact that they are monitored “real time” has done little to rein in errant drivers, though. Of the 30 people killed by public transport buses in 2018, as many as 17 were victims of the cluster-scheme buses, which are run by private concessionaires but monitored and managed by DIMTS. The other 13 fatalities involved DTC buses.
At 3,882, the Delhi Transport Corporation has twice as many buses in its fleet. In the last three years, fatal accidents involving DTC buses have, however, gone down 58%, while accidents by cluster scheme buses have seen a 54% rise. The decline in the number of fatal accidents caused by DTC buses is a part of a trend since 2011. From 73 fatalities in 2011 to 13 in 2018, there has been a dip of about 82%.
This has coincided with the drop in number of DTC buses. In 2011, the fleet was 5,531-strong. Officials, however, ascribe the falling rate of fatal accidents to better training and psychological conditioning of drivers and better working conditions. DTC’s managing director Manoj Kumar told TOI that the corporation has moved from vigilance and disciplinary-type of administration to a more human resource-oriented one. “We have changed our approach and made it more HR-oriented,” Kumar said. He added that, earlier, drivers would face salary cuts and their increments would get affected if they were involved in any accident. In case of minor accidents nowadays, DTC tries to motivate the drivers to perform better and drive carefully.
“We have improved the condition of our depots, done up rest rooms for drivers, provided better sleeping mattresses and also better toilets,” Kumar said. “We also have tie-ups with reputed hospitals where our drivers are provided free medical tests. This ensures that they are absolutely fit and free from physical ailments,” he said.
DTC still doesn’t have GPS devices on all its buses. Police sources, however, claim that it’s the cluster buses that are the biggest violators when it comes to speeding. “By tracking cluster buses through GPS, we found that are usually driven around 60 kmph against a prescribed limit of 40 kmph,” a transport department official said.
A DIMTS spokesman said: “All cluster-scheme buses are monitored through GPS tracking and penalties are imposed in case of speeding.” Private concessionaires are paid by Delhi government on kilometre basis and cluster bus drivers are expected to complete a certain number of trips a day. According to transport department officials, drivers speed to complete as many trips as possible.
Cluster buses: why they are
Buses operating under the cluster system are increasingly earning the notoriety once reserved for the Blueline buses. While police have been asking Delhi Integrated Multimodal Transit System Ltd, which monitors these buses, to rein in the rash drivers, little has been done. Not surprisingly, last year cluster buses were involved in 17 fatal accidents.
The buses sporting an orange colour and driven by employees of private concessionaires but monitored by DIMTS pay scant to road rules, speeding beyond the permitted limits, violating lane discipline and ignoring traffic signals, often in competition with the DTC buses operating on the same routes. They were behind the death of 17 people in 2018, itself a doubling of the number they killed in 2017.
Delhi has around 1,600 cluster buses on the roads every day. Their dangerous antics have defeated the rationale behind the scheme, which was to allow one concessionaire to drive in a particular cluster of routes to avert any sort of competition leading to speeding and rash driving. However, the private concessionaires are paid by Delhi government on a per kilometre basis with the cluster buses expected to complete a certain number of trips in a day. According to transport department officials, the cluster scheme drivers speed to complete their trips as early as possible.
“Even though there are no incentives given to the drivers for reaching their destinations early, they speed purely to make free time before the next trip,” explained a police officer. During the peak hours, cops rarely stop the errant drivers for fear that an idling bus will stall the traffic on the road. It is also at the peak hours, therefore, that most violations take place, said traffic police officers.
When contacted, the DIMTS spokesperson didn’t take calls or respond to text messages.
While their counterparts in DTC face serious consequences if their buses get involved in accidents, the cluster bus drivers face more lenient penalties at the hands of their private employers, which only emboldens them. And though DIMTS claimed to have fitted GPS devices to track the movement of all its buses, in reality such devices rarely work. A transport department official said, “By tracking the cluster buses through GPS, we realised that they usually run at a speed of around 60 kmph when the prescribed limit is 40 kmph.”
2012-18
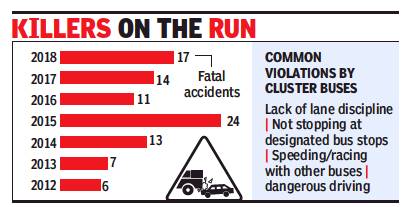
From: Somreet Bhattacharya, Paid on km basis, these drivers are always in a rush, March 29, 2019: The Times of India
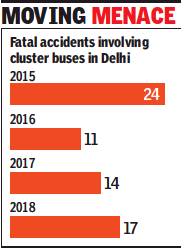
From: March 29, 2019: The Times of India
See graphics:
Common violations by cluster buses, 2012-18
Total accidents involving cluster buses in Delhi, 2015-18
Causes of accidents
2017-Feb 2018: time, type of vehicle, drunkenness, T- points
City roads turn death traps after midnight, March 12, 2018: The Times of India
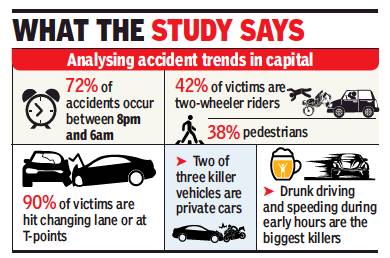
2017-Feb 2018: time, type of vehicle, drunkenness, T- points
From: City roads turn death traps after midnight, March 12, 2018: The Times of India
More than 70% of the accidents on Delhi roads happen between midnight and 6am, according to the traffic police.
The capital reported 215 fatal accidents till February 28 this year. In 2017, 213 cases were seen in the same period. Police officers said that in 50% of the cases, drivers claimed they couldn’t see the victim because of light from the other side of the road or because of another vehicle in front of them.
The other accidents happened because of bad roads or encroachments. From midnight to 6am, major traffic signals are put on blinking mode or don’t have policemen to monitor traffic.
Last week, a biker was crushed by a truck on the Lajpat Nagar flyover when he tried to avoid hitting some bricks lying on the road and slipped. While traffic policemen are present on the roads till 11pm, policing past midnight is solely dependent on the local police teams.
According to the temporal trend of accidents in the capital, the midnight-2am and 4am-6am slots are considered the most dangerous as trucks are allowed to enter the city and the traffic volume is high.
The traffic police study found that 55% of the accidents were caused because of speeding as drivers were unable to slow down their vehicles at traffic signals and ended up hitting a divider or another vehicle. A similar case was seen on Tolstoy Marg in Lutyens’ Delhi last week when the driver could not slam the brakes on time after spotting an autorickshaw on the way.
The study also found that in 40% of the cases, both the victims and the accused drivers were in the age group of 19-30 years. Alarmingly, 6% of the drivers found to be involved in accidents were underage.
Apart from inadequate checks for speeding and drunk driving, the police found that 30% of the accidents were because of encroachments on the road, while another 15% happened due to light reflecting on the windshield of the vehicle.
Of the 750 accidents reported past midnight last year, almost 300 were hit and run cases as there was no one to see or catch the accused, according to the study. Also, most roads where accidents took place were not under CCTV surveillance. According to the traffic police data, roads around Najafgarh, Dwarka, Model Town and Mehrauli were found to be most prone to fatal accidents past midnight. The police attributed this to speeding and reckless driving.
Therefore, two Peripheral Expressways might Bring Down Road Fatalities
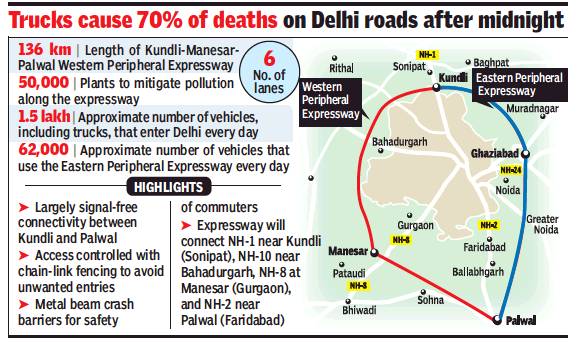
From: Sidhartha Roy, Ring around Delhi to keep nearly a lakh vehicles out, September 22, 2018: The Times of India
2 Peripheral Expressways Likely To Bring Down Road Fatalities
Nearly 70% of the deaths on Delhi’s roads past midnight are caused by trucks and 60% of these vehicles are not even destined for the city.
In August, more than 62,000 vehicles used EPE to bypass the capital, said Alok Kumar, joint commissioner (traffic), Delhi Police
Approximately 1.5 lakh vehicles, including both goods and passenger vehicles, enter the capital every day.
“Most of the accidents occur near highways and the biggest black spots of Delhi are located along the national highways. As per our data, freight vehicles are involved in 44% of the accidents,” said Sewa Ram, professor of transport planning, School of Planning and Architecture. “If these vehicles are taken away from the national highways, thanks to the peripheral expressways, there should be some reduction in crashes that are taking place now,” he said.
According to Gaurav Dubey, programme manager (sustainable mobility), Centre for Science and Environment, accidents tend to happen in the late hours as roads are empty and as a result, speed of vehicles are high unlike during the day when congestion brings down chances of fatal crashes. “This traffic is largely composed of heavy vehicles with a high chance of fatal accidents. If heavy vehicles are put off the roads, there is definitely going to be some kind of benefit though it is difficult to give a figure without doing a survey,” he said.
Referring to non -destined vehicles, Dubey said, “Many vehicles come to Delhi unnecessarily. Western Peripheral Expressway will be beneficial for these vehicles as well as they won’t have to waste time.”
Said S Velmurugan, head, traffic engineering and safety division, Central Road Research Institute. “We will witness a 25% reduction in road crashes if goods vehicles without any shipment for Delhi are not allowed to enter the city. In the case of passenger vehicles, however, the reduction will be around 10-12%,” he said.
“Eastern Peripheral Expressway is witnessing accidents and we assume a safety audit has been done for Western Peripheral Expressway,” said Sewa Ram. “We hope some lessons are learnt from EPE and safety record of Western Peripheral Expressway would be better.”
Velmurugan also stressed on the need to look into the road safety aspects of peripheral expressways, each around 135km long. “Loops and some other locations need adequate safety treatment, apart from proper signage and road markings.”
A spokesperson of Essel Infraprojects Limited, which has constructed the largest section of the expressway, said WPE would be accesscontrolled with chain-link fencing to control unwanted entries or exits. “The expressway also boasts of three-footwide metal beam crash barriers throughout the six lanes for increased safety of the commuters,” he said.
Causes of deaths
Over 70% of fatal cases have riders without helmets
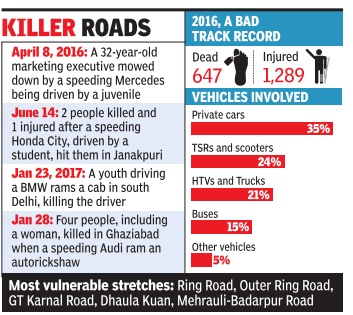
Delhi's road users are notorious for flouting rules. Among them, two-wheeler riders often dispense with helmets, zig-zag through the streets and frequently test fate by riding in the wrong direction on the road. Police figures reveal that in 72% of fatalities involving two-wheelers, the riders did not have proper helmets.
According to a police study conducted last year, hitand-run cases, as in the case of Arora, accounted for almost 50% of the road deaths. Traffic police officers say that the most vulnerable periods are between 10pm and midnight and between 4am and 6am. Pedestrians and two-wheeler riders comprised 90% of the victims, the rest being car drivers. Of the pedestrians, around 80% were forced to use the main roads because there were no footpaths on the treacherous stretches.
Police officers are optimistic about Arora's killer being found soon since figures show that in almost 90% of the hit-and-run cases reported in 2016, the errant drivers were traced within 48 hours.CCTV footage provided vital clues for detecting the killer cars.
The cops admitted that lack of surveillance and loose enforcement of law at night allowed the errant driver to escape. “In almost 70% of these cases, the victim succumbs to the injuries with hardly anyone on the roads to cater to them within the golden hour,“ said an officer.
Police officers say that accidents are most probable at T-point intersections or multi-level intersections, where a colony road meets an arterial road. Senior police officers observed that the mouths of flyovers and merging points of roads are now becoming sites of regular accidents. Cops studying the nature of accidents say that private car drivers were mostly at fault.
Garima Bhatnagar, joint commissioner (traffic), said that reducing the number of hit-and-run cases would require strict enforcement of rules disallowing juveniles to drive. “We managed to reduce the number of fatal accidents to 1,548 last year, but in most of these cases the causes were petty violations, including speeding at intersections,“ Bhatnagar said. “We have identified 69 points on arterial roads that are prone to accidents and have suggested changes that could slow down vehicles approaching them.“
1 in 3 road deaths due to flouting of traffic rules
Aug 16 2017: The Times of India
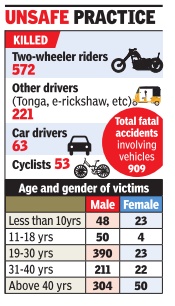
One in every three people killed in road accidents in Delhi suffers that terrible fate because of flouting basic safety regulations like not wearing a helmet or a seatbelt. Delhi traffic police say last year, 572 people were killed in accidents involving two wheelers of whom 70% were either speeding or not wearing safety gear. And of them, 90% were men.
Experts say that it takes more than just learning to ride a motorcycle to control a high power sports bike. In fact, biking enthusiasts, part of various clubs in Delhi, have to undergo rigorous training to even venture out on the city roads. Most of the sports bikes need strong reflexes and great control, especially on Indian roads that are often crowded.Strong biking laws are a must, say many experts.
Essa Khan, a sports bike instructor in Noida, says many youngsters think professional biking is all about showing off half-learnt skills.Abhishek Kumar, a dealer of super bikes in central Delhi, said, “We always tell riders to be aware of the rides they are on. Since there are no bikerspecific laws in the country , there should be some way through which the government must rein in these practices. They give the general public a wrong impression about sports bike owners.“ Police officers say parents who gift such bikes to their teenaged children must monitor their use. Their data also show that almost 40% of road deaths involving two-wheelers are caused due to rider error. Sometimes, safety gear isn't up to the mark as well.For instance, the helmets available for super bikes often do not comply with the standards. On Monday , too, the victim's helmet was destroyed on impact.
Police also say that T-points and multi-point intersections are the usual spots for accidents. Mouths of flyovers and places where colony roads merge with arterial are becoming danger zones. Police, however, say that private cars are often responsible for two-wheeler crashes.
Incidence/ frequency of accidents
2010: fewer accidents
Study shows fewer accidents in 2010
Delhi Police Says Number Of Mishaps Down By 15.5% In First Three Months
Megha Suri Singh | TNN
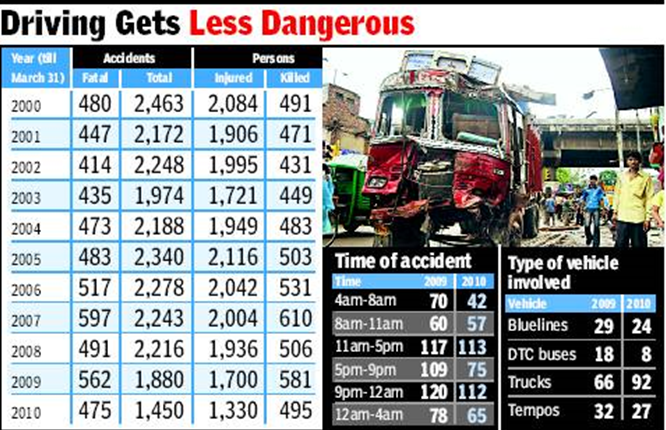
Delhi roads seem to be becoming much safer if the accident figures compiled by the Delhi Police for the first three months of this year are to be believed. The study reveals that the number of accidents reported this year — 1,450 — is the lowest the city has seen in the past decade. Traffic police attributes it to increasing congestion and therefore reduced speeds, phase-wise completion of large construction projects and large presence of cops on the roads during rush hours.
A look at the figures reveals that 495 people have been killed in accidents this year (till March 31) and another 1,330 people suffered injuries. There has been a decline of about 15.5% in the total number of accidents. Trucks continue to be the major killers as they have been involved in 92 accidents, followed by Bluelines with 24 accidents and Delhi Transport Corporation (DTC) buses with 8 accidents.
Over the years, the highest number of accidents has been reported in the wee hours of the day (midnight to 4am) and this year too, 65 accidents occurred during this time. But the maximum number of accidents — 120 — have taken place between 9pm and 12pm. This is about eight accidents less than the figure for last year.
Senior traffic police officials feel it is not possible to attribute the reduction in accidents to any one reason. But a recent mandate to post traffic policemen at all the intersections in the city during the morning and evening rush hour could have been a factor.
‘‘We have shifted the focus from enforcement to traffic management during the morning and evening rush hour. Now, every traffic signal in the city is physically manned by policemen. Wewould have taken a hit on prosecution, but the focus is on better traffic management,’’ said an official.
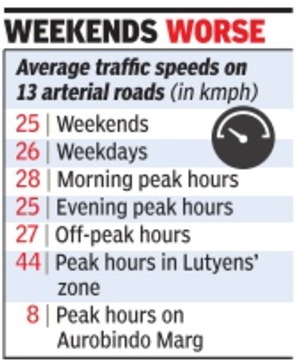
Police sources say that the average speed on several key corridors like Ring Road, where people could earlier speed has also reduced due to congestion and traffic jams. This, they said, also could have translated into fewer accidents.
2010-16: vehicles multiply but accidents dip 26%
Average Traffic Speed Down 10% To 36kmph
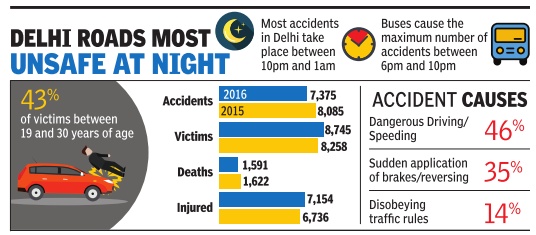
Accidents in the city have dipped by 26.4% since 2010 despite the addition of 32 lakh new vehicles in these seven years. The average speed on Delhi's roads has come down 10% -from 40kmph to 36kmph -in this period.
A study ordered by police commissioner Amulya Patnaik and conducted by the Delhi traffic police has found that the increase in the number of private vehicles and lack of adequate public trans port resulted in more pedestrians being involved in accidents than others.
The study found that though 8.7 lakh vehicles were added in 2016 alone, Delhi saw a marginal decrease of 2.9% in the total number of fatalities last year, compared with 2015.“We aim to reduce this further by increasing enforcement regulations, creating awareness and suggesting engineering improvements,“ said Ajay Kashyap, special commissioner, traffic. The Ring Road stretch bet ween Burari and Mangolpuri saw the most accidents; the entire Ring Road accounted for 123 fatal accidents in 2016, making it the deadliest in the city. Areas around Badarpur, Tughlaqabad and Sarita Vihar were found most prone to non-fatal accidents because of the high density of cars.
Speeding, disobeying traffic signals, lane indiscipline and sudden braking are the major cause of accidents. Poor lighting conditions on the road accounted for 22% of the accidents in 2015. In 28% of the cases, the victims were found to have been killed while crossing roads. Improper road designs and crossover points result in the maximum number of deaths, according to traffic police officers. Narrow roads resulted in 44% of the accidents while a lack of central verge caused 41% of pedestrian deaths in 2015. The study shows that pedestrians have a 90% chance of survival if they are hit by a car travelling at a speed of 30kmph or lesser.
Cops found that 34% of the total errant vehicles were private cars, out of which 68.2% were found to be registered in Delhi and 22.11% in Haryana. Hit-and-run incidents account for 48% of the accidents.
Forty-six per cent of the total accidents was found to have been caused by speeding and dangerous driving. It was found that accidents tend to increase between 8pm and 2am. The number of deaths involving cyclists has reduced from 69 in 2015 to 52 in 2016.
Drivers were found to have crashed their vehicles causing 194 fatal accidents in 2016, of which 91 were found to be riding two wheelers while 38 were found driving cars. Highest number of accidents were caused between March and April between 10pm and 1am. Pedestrians were mostly killed between 7pm and midnight. The maximum number of accidents were found to be occuring at T-point intersections, bus stands and at cut-outs on dividers.
The police study reveals that 45.1% of the total accidents were caused due to the driver's fault, whereas in 48.2% the cause of the accident was unknown. Only 2.1% of the accidents are caused due to the road designs and 46% of the accidents were found to have been caused due to speeding and dangerous driving.
Cops have recommened removal of black spots, encroachments on footpaths and construction of footways for pedestrains on some of the worst stretches to reduce pedestrian fatalities. They have identified 20 stretches across the city where pedestrian movements can be guided to reduce walking on the road. Police have proposed the segregation of lanes into four zones, namely slow-moving, public transports, vehicles moving between 20-40 kmph and higher speed vehicles to avoid collisions. Two wheelers have to be kept in the third lane to avoid conflict with four wheeled vehicles. Police have also advocated for better monitoring of intersections.
2014-15: Major traffic offences in Delhi
The Times of India, Aug 15 2015
Somreet Bhattacharya
Jumping signal and illegal parking vie for top honours in challan book
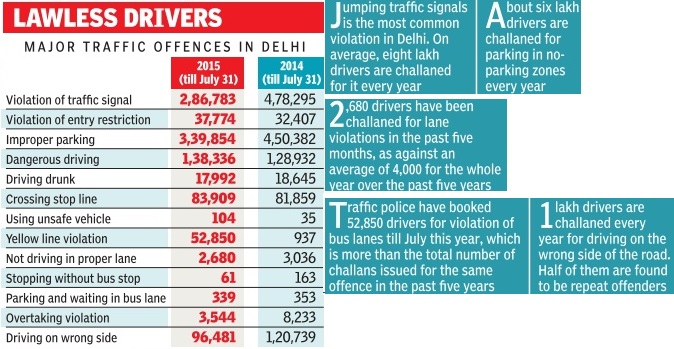
It doesn't take much to throw Delhi's traffic out of gear.A car changing lanes at the last moment, a bus stopping to pick up passengers or an auto parked on the roadside can do it. All of these fall under the category of minor traffic violations but their effect on the city and its stress levels is enormous. So is the number of these violations.Although only a minority of errant drivers gets challaned, police records show 3.4 lakh prosecutions for wrong parking till July 2015. “There is a general disregard for the law,“ says Muktesh Chander, special commissioner, traffic. He says people are not afraid to break traffic rules as the fines are paltry . “People flout rules and then argue to justify their actions. Flouting traffic norms has become a habit, especially during the peak hours.“
Traffic experts say population growth and lack of a public transit system are also responsible for the increasingly unruly driving on Delhi's roads. Surprisingly, the number of challans issued for jumping signals has come down from 4.78 lakh in the first seven months of 2014 to 2.86 lakh during the same period this year. Challans for wrong parking have also reduced from 4.5 lakh to 3.4 lakh. But police say this is a result of the driver sensitization programme and “dynamic prosecution“ they undertook last year.
In 2015, police have cracked down on drivers jumping lanes and crossing divider lines. The number of challans for these offences has increased from 52,850 in the first seven months of 2014 to 937 this year.
Police say 30% of the offenders drive autos, RTVs and Gramin Sewa vehicles while the rest are private car owners. A police study shows the number of challans issued is roughly the same as the number of licensed drivers in the city . However, many of the drivers have been challaned more than once for the same offence.
Traffic expert K K Kapila from International Road Federations says challaning does not discipline drivers anymore as the fines are paltry. Also, heavy traffic at all times of the day enables people to get away with violations because there aren't enough policemen around. The law needs to be strong to deter drivers from breaking rules, he says.
Once the much-delayed Integrated Traffic Management System is in place, private firms will monitor violations and challans will be sent directly to vehicle owners. “We need a foolproof vehicle registration system for this,“ said a traffic official.
2016: Lesser fines for dangerous driving than 2015
Challans For Speeding, Jumping Signals Lower Than 2015, Feb 14 2017: The Times of India
Fewer people booked for dangerous driving in 2016
Delhi's roads are becoming increasingly unsafe but enforcement and challaning seem to have become less intense of late. In 2016, cops booked lesser number of drivers for offences, which endangered the lives of others, as compared to 2015. They fined 86,771 drivers for speeding compared to 2,35,002 in 2015; 92,037 drivers were challaned for jumping traffic signals in 2016 against 4,01,033 in 2015; 2,05,470 cases were registered under sections of dangerous driving in 2016 as against 2,36,930 cases in 2015.
Traffic police officers claim that an increase in the vehicle numbers from 74.41lakh in 2011 to more than 1 crore in 2016 resulted in more congestion and lesser challans. Drives were conducted to increase challans for drunk driving, triple riding and pillion rider without helmets though.
According to Delhi Police's data, 2,42,250 drivers were booked for not stopping at a “stop line“ in 2016 as compared to 1,43,727 in 2015. Cops also booked 2,621 drivers for wrong overtaking in 2016 as against 6,363 in 2015. However, the challans against drunk driving showed a marginal increase from 25,958 in 2015 to 28,006 in 2016.
Officers said they had booked almost twice the number of people for driving without a licence last year compared to 2015. The police sent 1,78,578 licences for suspension for various violations, which is the highest among all the states in India.
The police data show a dip in the number of fatal accidents compared to 2015. Last year 1,591 people had died in 7,375 accidents compared to 1,622 killed in 8,085 accidents the previous year.
The traffic police launched a drive against the rogue public transport drivers last year in which 25,136 Gramin Sewa drivers, 4,972 DTC drivers and 1,87,991 TSR drivers were booked for plying without proper credentials.
After the registration of erickshaws was made mandatory last year, cops booked 26,472 drivers for unauthorised driving and 2,80,888 for plying on the wrong side of the road.
The traffic police sent 282 proposals to PWD to rectify roads prone to congestions.They also enforced pedestrian discipline on some stretches. They introduced 200 body-worn cameras and 50 variable message as part of the smart traffic management plan last year.
2016: safest year since 2006
Accident deaths: 2016 safest in a decade, Jan 14, 2017: The Times of India
Although the vehicle count increased, 2016 was the safest year in a decade in terms of traffic fatalities. There were 1,548 accident deaths as against 1,582 in 2015. The police claimed strict enforcement of rules, including cancellation of licence, brought about the improvement, but the data shows a 14% decrease in the number of challans.
Delhi recorded 7,375 road accidents during the year, injuring more than 7,000 people, Sanjay Beniwal, special CP (operations), said at a seminar organised by International Road Federation (IRF).
The traffic police is in the process of installing high-definition cameras, optimised real-time signals, variable sign boards and centralised command control centre to assess real-time traffic volume and capture images of even small objects causing obstructions on the arterial roads.
Delhi Police will soon install more high-definition CCTV cameras and traffic monitoring and management technologies at important locations and connect them to the monitoring room at the traffic headquarters. Their high-quality videos will help in detecting violations at the chosen locations.
The e-challan system helped the police identify repeat offenders, and over 19,000 licences were seized. The road-owning agencies were asked to make changes on 137 accidentprone stretches. Common people also reported 5,200 violations through apps and the traffic police's Facebook page.
2015-16: pedestrians and bikers at greater risk
Somreet Bhattacharya, Most Accidents Occur Between 11pm & Midnight, Jan 28, 2017: The Times of India
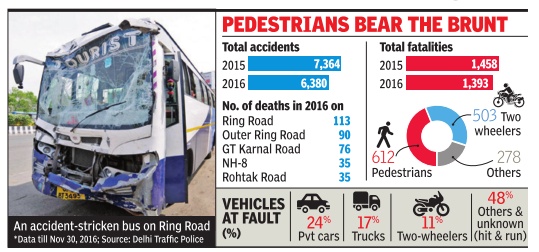
The capital has emerged as a dangerous place for pedestrians and bikers. Four out of every 10 people killed in road accidents here are pedestrians; the other four are two-wheeler riders.
According to a study conducted by the traffic police, almost five people died on an average per day in accidents last year. The two Ring Roads were death traps with 203 people perishing on these arterial stretches that connect almost all parts of the city.
The study , which includes data from January to November last year, shows that 612 pedestrians and 503 people on two-wheelers were killed. Almost 50% of the pedestrian deaths took place while they were walking on the roads, due to lack of designated footpaths in many places, or crossing busy stretches. Eighty per cent of the deaths involving two-wheelers were caused primarily because of two factors: the vehicles toppled and their riders were not wearing helmets.
The maximum number of fatal accidents occurred between 11pm and midnight; the morning peak hours -10am to 11am -were the safest. Cops say that private cars were the biggest killers.
Most of the accidents took place near flyovers and intersections. “We've come up with solutions that require engineering changes at some stretches,“ special commissioner (traffic) Ajay Kashyap said. Though the rate of accidents has reduced since 2015, our aim is to bring it down to zero,“ Kash bring it down to zero,“ Kashyap said.
Apart from the two Ring Roads, the highways passing through the city -GT Karnal Road, Rohtak Road, NH-8 and Grand Trunk Road -accounted for most of the other fatalities. Police officers admitted that speeding on open stretches is the reason behind almost all the accident cases. Careless overtaking, lane changing or stopping suddenly led to most of the accidents, as evident from a speeding BMW car recently ramming into a cab, killing the driver. According to the NCRB, 41% of the accidents were due to speeding while 32.2% due to abrupt changing of lanes. Driving drunk too accounted for 10% of the fatalities.
Cops charged 243 private car drivers for fatal accidents last year. They also registered, 579 cases as hit-and-run incidents in which investigations revealed that almost 51% were caused by private cars.Trucks were found to be the second biggest killers on road.
According to a previous study by the ministry of road transport and highways, 77.1% of the accidents were caused due to the fault of the driver, while the rest were due to the fault of the victim. Moreover, almost 70% of the accidents were caused by head-on collisions.
2017: 1 fatal accident every sq km in Delhi, 4 deaths a day
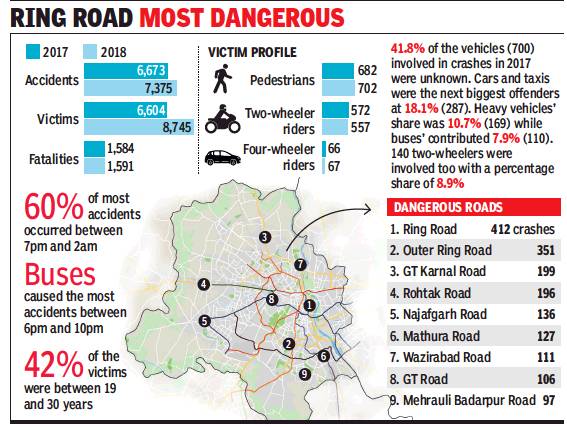
Victim profile;
Dangerous roads
From: Somreet Bhattacharya, 1 fatal accident every sq km in Delhi, 4 deaths a day in ’17, October 27, 2018: The Times of India
Half of the accident cases in Delhi last year were hit-and-run cases and 44% of the victims were pedestrians.
An accident analysis report released by traffic police found that Delhi had one fatal accident per square kilometre of road stretch in 2017 while on an average, four people died every day in accidents. Mukundpur Chowk had the highest number of hit-andrun cases last year.
During the study, police found private cars and taxis to be the biggest killers on the road. Two-wheeler riders were found to be the second most vulnerable lot after pedestrians, comprising over 32% of the total victims. Police also spotted an increase in the number of deaths of cyclists, especially in the morning hours. Africa Avenue and Alipur Road were found to be the two most dangerous roads for pedestrians. Ring Road and Outer Ring Road were found to be the most dangerous stretches overall. Police identified 303 points across the city as accident-prone of which 145 were the most dangerous.
The study also found that there were more fatal accidents in the evening. As many as 845 fatal crashes occurred after dark while 720 happened during the day.
Even though the peripheral expressways reduced the number of goods vehicles in the city, the maximum number of accidents occurred between 7pm and 2am. However, the number of goods vehicles involved in such accidents came down.
It was found that 65% of the accidents took place due to driver’s error of which 24% were caused due to speeding and 14% due to dangerous driving like disobeying traffic rules. Poor lighting on the road led to 56% of accidents last year while 39% were caused by potholes.
Central and east Delhi were found to be more prone to simple accidents where vehicles were damaged, but west and outer Delhi were found to be prone to fatal accidents. Police said open village roads and speeding were the reasons behind the rise in the number of fatal accidents on these stretches.
But what has worried the police is the increase in the number of fatal accidents in Lutyens’ Delhi from 57 in 2016 to 65 in 2017. Most of the accidents took place between October and December. Police said better laid roads and proper signage could reduce the number of fatal accidents.
Areas around Janakpuri, Najafgarh, Tilak Nagar, Mayapuri and Bawana were more prone to accidents involving heavy vehicles and in most cases they were found to be incidents of hit and run. Cars were found to be the biggest offenders in Rohini, Burari and Kalyanpuri areas. Drivers from Delhi were found to be involved in 67% of the accidents while those from Haryana were involved in 20% of cases. Last year, 81 people died after crashing their own vehicles.
The traffic police issued 2,34,422 challans for dangerous driving, 1,39,985 for speeding and 33,342 for drunk driving last year. A record 11.02 lakh challans were issued to two-wheeler riders for not wearing helmets.
2018, road fatalities
Somreet Bhattacharya, Nov 17, 2019: The Times of India
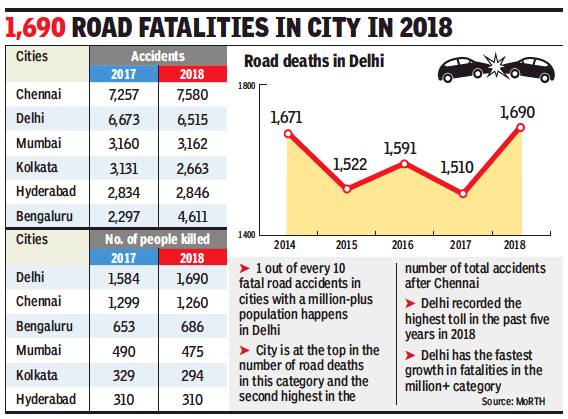
From: Somreet Bhattacharya, Nov 17, 2019: The Times of India
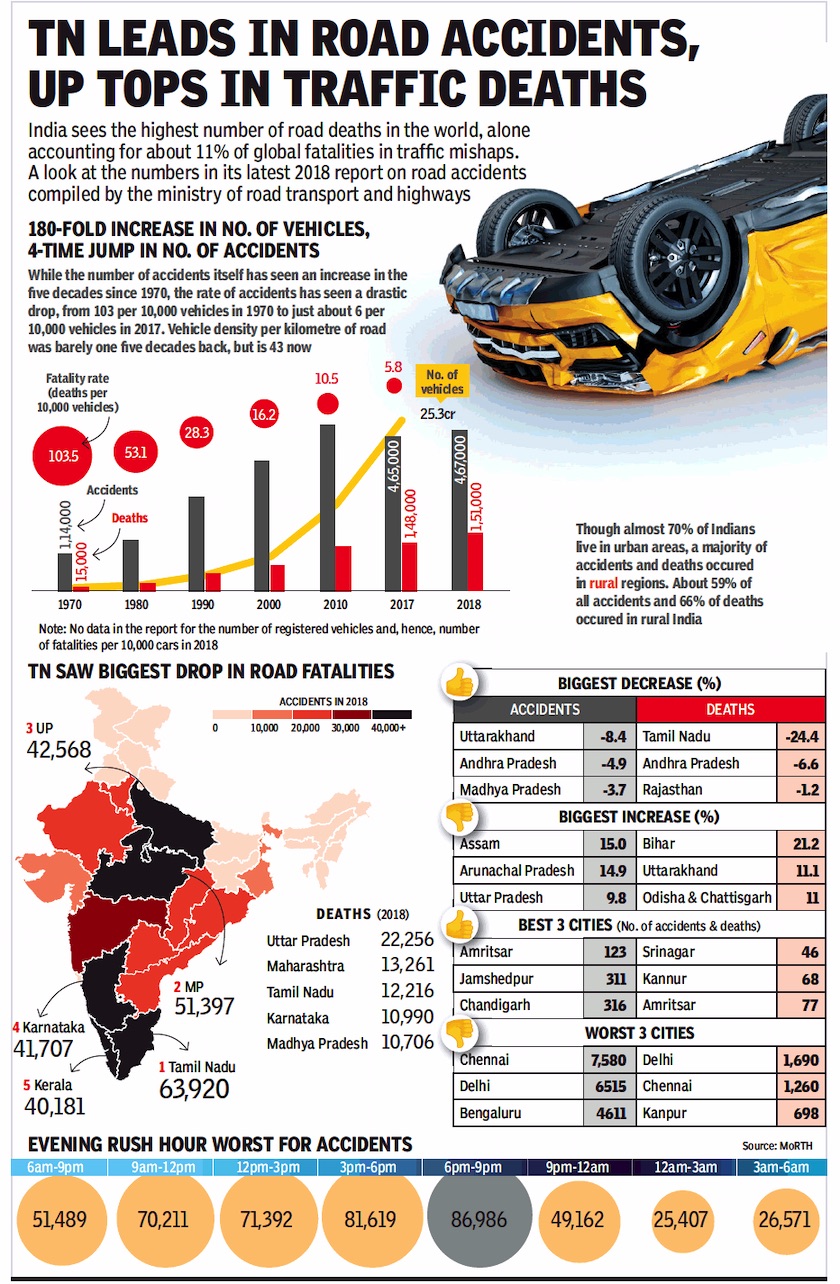
From: Nov 17, 2019: The Times of India
See graphics:
A look at the numbers of road accidents in a report compiled by the Ministry of Road, Transport and Highways, 2018
Road accidents in 2018, city-wise
Of every 10 fatal road accidents in Indian cities with a population of over one million, one is in Delhi. The toll in the city hit the highest mark in the past five years in 2018. According to an accident report brought out by the Union ministry of road transport and highways, Delhi suffered a road death almost every five hours last year.
There were a total of 17,709 road deaths in million-plus cities in 2018. Of this, the toll in Delhi was 1,690, far higher than in Mumbai or Kolkata, where 475 and 294 deaths were recorded, respectively.
Delhi tops in the number of road deaths among such cities and is second after Chennai for number of accidents. Delhi also showed the fastest growth, or fatalities as a ratio of total road accidents. The ministerial report also said that cities with populations of over 50 million, Delhi being one such, accounted for 18.3% of the total number of accidents and 11.7% of fatalities.
Dense population and congested vehicular movement are causes of road accidents in Delhi. Explaining why 2018 had the highest toll of lives in the last five years, S Velmurugan of the Central Road Research Institute said, “Last year a number of road stretches reopened for traffic after the construction activities were completed and the average speed on the road increased. This could have resulted in fatal accidents.”
Piyush Tewari, member of Save Life Foundation who has been campaigning for safer roads, observed that the number of fatalities was directly proportional to the enforcement of traffic rules. “Besides speeding and driving under the influence, we discovered there was a spurt in wrong-side driving, resulting in more accidents. Prosecution against violations has to be increased,” he said.
Tewari also added that Delhi lacked a robust accident trauma care system. “Though an ambulance service exists and good Samaritans helping accident victims are rewarded, the police control room van is still the sole unit that responds within the golden hour. Road fatalities can be reduced if this is properly systemised,” he said.
An earlier Delhi traffic police report had cited human factors and defective and insufficient road designs as reasons for the increase in accidents and fatalities. For instance, defective road designs were deemed to behind 40% of the accidents due to unguarded civic works and 20% attributed to bumpy roads or potholes. Poor illumination was the cause of 33% of the accidents.
P K Sarkar, formerly professor of transport planning at the School of Planning and Architecture, pointed out that apart from stronger enforcement, vehicle management at night should be a priority for the traffic police and civic agencies. “Earlier, steps were taken to reduce the speed of vehicles on highways and emptier stretches after 9pm till 6am, considered the deadliest hours for accidents,” Sarkar said. “If not present physically, police can rely on technology to monitor the speeds of vehicles in this period. We should see changes in the fatality figures after the Intelligent Traffic Management System being installed becomes fully operational.”
2019: January-March worst period
Sakshi Chand & Somreet Bhattacharya, September 3, 2020: The Times of India
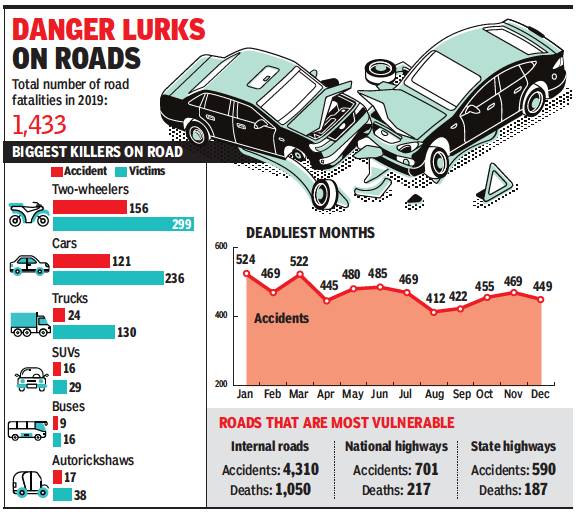
From: Sakshi Chand & Somreet Bhattacharya, September 3, 2020: The Times of India
Accounted For More Than 500 Of Over 1,400 Fatalities In 2019; Jan To March Deadliest Months
Speeding on roads took the most number of lives in Delhi, followed by dangerous driving. Data released by National Crime Records Bureau (NCRB) shows that of the 1,433 fatal accidents that took place in 2019, more than 500 casualties were a result of speeding. The period between January and March was the deadliest.
Two-wheelers were found to be the reason behind most deaths on the roads in the city. In 2019, two-wheelers were involved in 156 accidents in which 455 people were killed. Traffic police officers said in most cases the rider and the pillion both died due to head injuries after falling off the vehicle. About half the accidents were caused due to skidding of two-wheelers.
The NCRB data also revealed that private cars were involved in 121 accidents last year in which 236 people died. Accidents claimed the lives of 551 people, while 2,026 people were injured in 2,202 such incidents caused due to speeding. Dangerous driving or overtaking from the left side took the second highest number of lives. In all, 529 people were killed and 1,700 injured in 1,978 accidents caused by dangerous driving. Apart from this, 29 people were killed and 130 injured in 142 cases of drunk driving.
The NCRB records showed that nearly one-fifth of the accidents occurred between January and March. Traffic police officers said that speeding during foggy winter nights was the reason behind such accidents.
It was found that various stretches within the national capital, including colony roads, were vulnerable spots for accidents. A total of 942 people died on the city’s roads in 4,058 accidents last year compared with 271 and 187 deaths on national highways and state highways, including Ring Road and Barapullah elevated road, respectively.
“Accidents mainly take place on longer stretches where drivers tend to behave erratically. The time period between 3pm and 10pm is particularly worse as more people step out to go to markets for buying essentials,” said a senior police officer.
Almost 80% of the pedestrian deaths in the city took place while people were crossing the road.
The other vulnerable road users who became victims of accidents were two-wheeler riders, who were either hit by other vehicles or fell down after losing balance.
Drunkenness, among drivers: region-wise
South Delhi, drunk drivers
The Times of India, Apr 05 2016
30% of drunk drivers from south Delhi
Somreet Bhattacharya
No amount of penalty seems to have had an impact on drunk driving in the capital. What's more: south Delhi has the dubious record of having the most number of drunk driving cases. A study shows between December 2012 and December 2015, about 30,000 drivers were penalised each year. Most of them were found in Greater Kailash, Hauz Khas and Defence Colony . But only 1% of drivers were sent to jail; most others were let off upon paying a fine of Rs 2,000. Also, over 60% of the violators were private vehicle owners, police said, referring to the study.
Traffic police said 25,958 drivers were found driving drunk in 2015 of whom 70% had a Delhi licence. About 32.74% of these drivers were from south Delhi while 24.32% were from west. The study found that 45.56% of those south Delhi drivers were repeat offenders; the corresponding figure for west Delhi drivers was 23.07%. Central Delhi had the lowest number of repeat offenders at 4.43%. In 2014, of 29,584 such drivers, 39.02% were from south Delhi.
Of those driving drunk in 2015, 58.86% had alcohol content more than 150mg per 100ml blood on an average.
It was found that areas around farmhouses near Mehrauli reported the most number of drunk driving cases, followed by markets around Lajpat Nagar, Defence Colony and Hauz Khas. Mehrauli alone had 1,024 accidents due to drunk driving in 2015.
But the highest number of drunk driving-related accidents were reported from Sadar Bazar--1,227. Seemapuri came third with 857 cases. The most fatal accidents caused due to drunk driving were reported from Outer Ring Road, NH-1 and Mathura Road, police said.
Traffic police sources said dark spots around MehrualiBadarpur Road and Mehrauli-Mahipalpur stretch have the most number of drunk drivers past midnight.“Drunk driving is rampant in the Mehrauli-Badarpur area, which has long, wide roads and has bars and restaurants nearby ,“ said a traffic police officer, quoting the study .
Till December 2015, 62.09% drunk drivers were found to be riding two-wheelers while 19.89% were driving cars; 4.71% were TSR drivers.Police impounded 1,644 licences from areas around the ITO crossing and Delhi Gate during the same period.
The penalty for drunk driving earlier was Rs 1,000. Last December, the option of impounding licences was introduced. Occasionally , drunk drivers are arrested under Section 279 of IPC and their vehicles impounded. But police officers say even these strictures aren't enough and there's need for stricter legal provisions.
Drunk driving
42% of drunk drivers from south Delhi
Somreet Bhattacharya|42% of drunk drivers from south Delhi|Jul 11 2017 : The Times of India (Delhi)
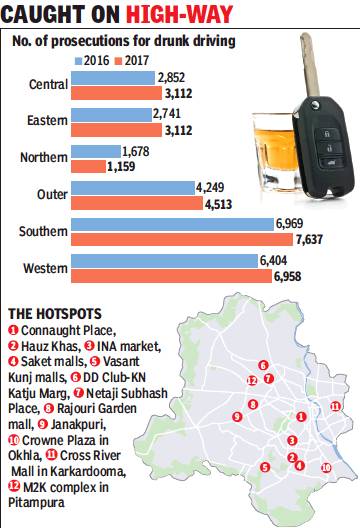
From November 22, 2017: The Times of India
See graphic, Number of prosecutions for drunk driving, 2016, Jan-Oct 2017
There seems to be no impact of a huge penalty and suspension of driving licences on drunk driving in the capital. Also, south Delhi seems to have earned the dubious distinction of having the maximum drunk driving cases.
Data from a special drive conducted by the traffic police over the past three days shows that of the 549 drivers fined, 243 were from south Delhi. Also, over 60% of the violators were private vehicle owners. Around 50% of the cases in south Delhi were from areas around farmhouses near Mehrauli. It was fol lowed by markets around GK, Lajpat Nagar, Defence Colony and Hauz Khas.
Of the total drivers challaned, 70% had a Delhi driving licence. Violators from south Delhi accounted for about 42% of the prosecutions, while 15.8% were from west. North Delhi had the lowest number of offenders with just 1% found driving drunk. Almost 60% of the drunk drivers had alcohol content more than 150mg per 100ml blood on average.
“The drive was conducted at strategic locations, including Nehru Place, Hauz Khas and Greater Kailash.The policemen were asked to wear body-cameras to record the behaviour of the drivers when they were caught,“ said DCP (southern range) Vijay Singh.
This year till date 10,250 drivers have been booked for drunk driving. Drivers continue to violate norms with impunity because only 1% of the violators are sent to jail by courts and the others are let off upon paying a fine of Rs 2,000 and suspension of driving licence for three months, police said. The power of suspending licences was introduced in December last year.
Occasionally , drunk drivers are arrested under IPC Section 279 and their vehicles impounded. But these strictures aren't enough and stricter legal provisions are needed to reduce drunken driving instances, police said.
In 2016, the highest number of drunk driving-related accidents were reported from dark spots on MehrualiBadarpur Road and Mehrauli-Mahipalpur stretch past midnight. Other vulnerable stretches included Outer Ring Road, NH-1 and Mathura Road.
Interstate buses
As in 2018
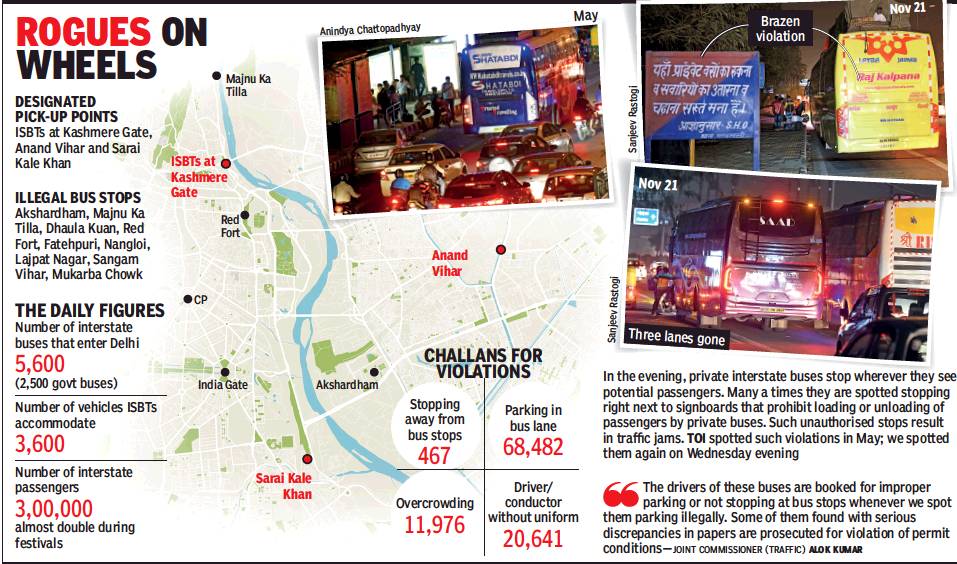
From: Somreet Bhattacharya, Interstate buses run over laws, but enforcers look on, November 22, 2018: The Times of India
All traffic rules seem non-existent for interstate buses running on Delhi roads. They stop anywhere on their route to pick up and deboard passengers or overtake other vehicles from the wrong side of the road. They are a big menace on the streets, but this open flouting of rules seems to have neither angered the traffic police nor alarmed the Delhi government’s transport department.
Under the rules, these buses are allowed to take on passengers only at the designated spots in inter-state bus terminals. In reality, they operate like DTC buses, stopping at places close to bus stops and calling out for passengers. There are some locations in the city, such as Dhaula Kuan, Akshardham Temple, Majnu Ka Tilla, Lajpat Nagar and Ashram, which have become de-facto pick-up points. They avoid being flagged down by not coming to a halt, but slowing enough for the passengers to be able to hop on.
Traffic police officers claim that offending drivers are prosecuted when caught. “We have regular drives against them and often discover the buses parked on the roads or blocking a carriageway,” asserted Alok Kumar, joint commissioner, traffic.
Mostly, the buses operated by private tour managers are the ones at fault, though some run by the state governments are not above trying to make extra money.
At some makeshift stops, TOI found the buses, mostly running under Uttar Pradesh Roadways or registered in western UP, parked almost diagonally to prevent rivals from overtaking them. This ruse leaves only a lane for the use of the remaining traffic. At Akshardham, for instance, on any day, a number of buses parked there cause a traffic snarl going back a kilometre during peak hours. Almost all these buses are also modified to add an extra level called ‘sleeper class’ on the roof to accommodate more passengers. This can make the buses unstable and prone to toppling.
Rajesh Kumar, an engineer who lives in Noida and commutes to Connaught Place for work, told TOI of his narrow escape two weeks ago when a Uttar Pradesh Roadways bus swerved to the left on spotting potential passengers. “My car could have got crushed or I could have hit the vehicles on my left. I managed to apply the brakes in time,” Kumar said.
Dhriti Bardhan, another commuter, grumbled, “After exiting the ISBTs, these buses stop midway at the mouths of flyovers or near metro stations to pick up a few more passengers before leaving the city. At least a dozen of them idle near places like Akshardham Temple and Kashmere Gate. This attempt to earn a few extra bucks is a regular affair."
Parked vehicles hit
2017> 2019
Dipak Dash, November 23, 2020: The Times of India
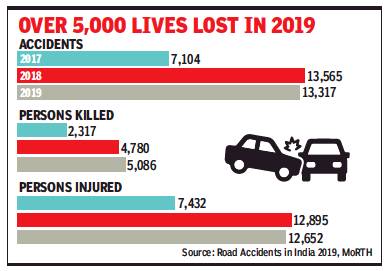
From: Dipak Dash, November 23, 2020: The Times of India
Deaths due to hitting parked vehicles double
New Delhi:
The number of persons killed due to collisions with parked vehicles on roads has more than doubled in the past three years – from 2,317 in 2017 to 5,086 last year. The state police departments started collating this data from 2017 onwards.
The increase in fatalities due to parked vehicles in the middle of a busy road have once again highlighted the dire need for a robust highway patrol or police system. A deadly accident on the national highway connecting Prayagraj and Lucknow in UP last Thursday night claimed 14 lives, including six children, after an SUV rammed a truck parked on the side of the highspeed corridor immobilised by a punctured tyre.
According to the road transport ministry’s Road Accidents in India’ report, UP reported maximum number of such deaths since collection of data under this head started. Last year, 1,223 people were killed in such crashes in UP.
Patrolling highways not on priority list of traffic police: Experts
In 2018, the number of people killed in crashes with parked vehicles stood at 1,299. The data compiled on the basis of reports from state police shows that in 2018, Gujarat reported the second highest such fatalities (478) followed by Haryana (353). During 2019, Punjab reported the second highest number of such deaths (647) followed by Haryana (330). Pratapgarh SP Anurag Arya told TOI that the parked truck did not have retro-reflective tapes to alert approaching vehicles. The driver had also not given any cautionary sign to alert other drivers about the parked vehicle. This even as use of retro-reflective tapes on all commercial and transport vehicles is mandatory as per the Motor Vehicle Rules to obtain fitness certificate.
Road safety experts said such safe practices are mostly missing on highways. “We have all good provisions on paper. But until we have visible enforcement and there is a fear of getting caught for every violation, there won’t be any change in the attitude of violators. The issue of a dedicated highway patrol or police has never got any attention despite this having been a matter of discussions,” said a former secretary of road transport ministry.
Patrolling the highways is hardly a priority of state traffic as they are preoccupied with other tasks. “Presence and patrolling police on highways is important, not just in case of a crash but some commuters may need some urgent help,” said Kerala transport commissioner Rishi Raj Singh.
Pillion riders
Safety features for pillion riders must in two-wheelers: SC
Amit Anand Choudhary, February 27, 2018: The Times of India
Two-wheeler manufacturers will have to provide safety measures for pillion riders like saree guard and hand grip as the Supreme Court upheld an order of the Madhya Pradesh High Court which had banned registration of vehicles without such features.
Although the high court had passed the verdict way back on November 25, 2008, the order was stayed by the Supreme Court on a plea by the Society of Indian Automobile Manufactures challenging the judgment. As there was an interim stay on implementation of HC order, the verdict could not be enforced in the last one decade.
A bench of Justices AK Goel and UU Lalit has now dismissed the appeal saying “We do not find any merit in this appeal”.
The HC verdict was confined to the state of Madhya Pradesh but now it would be enforced across the country with the Supreme Court upholding the Motor Vehicles Rules which makes it mandatory for manufacturers to provide safety measures for pillion drivers.
The Central Motor Vehicles Rules framed by Centre in 1989, says "no motor cycle, which has provision for pillion rider, shall be constructed without provision for a permanent hand grip on the side or behind the driver's seat and a foot rest and a protective device covering not less than half of the rear wheel so as to prevent the clothes of the person sitting on the pillion from being entangled in the wheel."
While upholding the rules, the high court turned down the plea that the hand grip or the hand hold system for the pillion rider had been fitted at the back of the seat of the pillion rider and this is the most convenient place where the hand grip should be fitted. The court had said that the pillion hand hold system should be be so fitted that it was convenient for the pillion rider to make use of it in his normal sitting position irrespective of whether he was sitting side or cross saddled behind the driver.
"We cannot accept the submission because rule 123 is clear that a permanent hand grip for the pillion rider has to be fitted on the side or behind the driver's seat and not behind the seat of the pillion rider," the high court had said.
"Since the pillion rider may sit cross saddled as mentioned, the foot rest and the protective device covering not less than half the rear wheel to prevent the clothes of the persons sitting on the pillion from being entangled in the wheel must be on each side of the rear wheel of the motor cycle. But in the affidavits filed on behalf of the respondents it is stated that in India, which follows left hand drive system, pillion riders mount and dismount on the left side only and not on the right side and also sit facing the left side on the pillion seat and for this reason, the protective device is given on the left side of the rear wheel. But the truth is that pillion riders not only sit facing the left but also sit cross saddled. Hence, a foot rest and a protective device mentioned in rule 123 has to be on each side of the motor cycle," the HC had said.
Railway crossings
Prem Nagar casualties, 2010-17
Mayank Manohar, No underpass, 400 die crossing tracks in 7 yrs, Sep 16, 2017: The Times of India
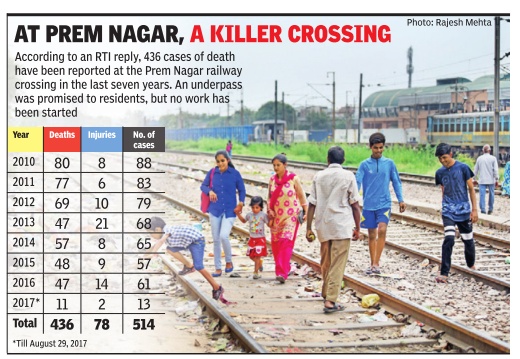
For three years after its foundation was laid, the railway underpass at Prem Nagar in north Delhi has remained a distant dream. In the meantime, the railway crossing there continues to take a toll of lives.The response to an RTI query showed that in the past seven years, 436 people have lost their lives, while 78 have been injured while crossing the railway line.
Conceptualised in 2014, the underpass was meant to enable people to cross the railway track safely while decongesting the area. The North Delhi Municipal Corporation was to have taken up the project. But with no money to spare, it passed the onus to the urban development department of Delhi government.
“People are losing their lives while crossing the rail way line,“ complained Hashish Kumar, a Prem Nagar resident. He explained that people crossed the railway tracks because taking the road to reach the nearest metro station or bus stop would mean a detour of at least half an hour.
A senior north civic body official claimed, “The corporation initially submitted Rs 40 lakh for planning and survey charges in 2015. However, due to financial problems we could not take up the project and requested Delhi government to provide financial aid.However, no funds have been sanctioned till now.“
Aletter dated November 4, 2016, written by the engineerin-chief of the north corporation to principal secretary of the urban development department, said, “There is a constant demand from the residents of the area to construct railway under bridge (RUB)because they often face difficulty crossing the railway line to reach Rama Road.This is dangerous to human safety also.“ The letter said land falling in the alignment of the RUB would need to be acquired, so the cost of the project would be Rs 128 crore plus Rs 58 crore for land acquisition.
The urban development department wrote to PWD, directing it to undertake the project as per directions.However, senior PWD officials maintained that the public works agency could not allocate funds to a municipal corporation.
“The funds for RUBs and ROBs come from the central government. Under one scheme, the central government bears 80% of the project cost, with the rest allocated by the agency involved. We were intimated about the project by Delhi government, but allocation of funds can only be done by the government,“ a senior PWD official pointed out.
An official from Delhi government, however, said that he was unaware of the specific project, but added that as a matter of principle, the urban development department was not involved with land acquisition. He also said there was no compulsion on the department to pay for some other agency's project.
Road rage
2015: road rage cases in Delhi

2015-2018: 244 cases
244 road rage cases in Delhi in 3.5 years, July 26, 2018: The Times of India
As many as 244 road rage cases were reported in the national capital over the past three and a half years, junior home minister Hansraj Gangaram Ahir informed the Rajya Sabha. While 22 cases related to road rage were registered till June 30, 2018, 64 cases were registered in 2017, 66 in 2016 and 92 in 2015. Ahir said 29 people have been injured due to road rage and 29 arrested till June 30, 2018
Rush hour
8am-8pm is new `rush hour'
8am-8pm is new city `rush hour': CSE study|Jul 11 2017 : The Times of India (Delhi)
The traffic `rush hour' extends from 8am to 8pm on arterial roads of Delhi, with average speeds not exceeding 30 kmph 92% of the time, reveals a Centre for Science and Environment study that analysed Google Maps data for last month. Surprisingly , the study also found that traffic congestion was higher during weekends when average peak speed dropped to 25 kmph.
On weekdays, the average speed was 26 kmph, which was 50 to 60% lower than traffic regulator UTTIPEC's street design standard speed, and 35 to 48% lower than the regulated speed of 40-50 kmph. The study, which has implications for pollution control, analysed hourly and daily travel speeds on 13 arterial stretches taken from Google Maps through the month of June. Debunking the `myth' of a sharp dip in vehicle numbers during offpeak hours, particularly between noon to 4pm, the study found there was negligible variation in average speed through the 12-hour period.The average morning and evening peak speeds were 28 and 25 kmph, respectively , while the off-peak speed was found to be 27 kmph.
Even this dropped to 8 kmph on Sri Aurobindo Marg and 9 kmph on Mehrauli-Badarpur road during peak hours. Evening peaks were worse during weekends, when speeds dipped to 21-23 kmph from 25-27 kmph on working days. This could be due to a higher use of personal vehicles over weekends.
The study says average peak-hour speeds in the Lutyens' zone were far higher at 44 kmph. The average off-peak speed in the zone was 52 kmph, almost double compared to other arterial roads.
Several chronically congested stretches were identified in the study . For instance, on the Ambedkar Nagar to Lajpat Nagar stretch on Lal Bahadur Shastri Marg, the average morning and evening peak speeds were 16 and 17 kmph, respectively . The average speed on Sri Aurobindo Marg (from Lado Sarai to Kidwai Nagar West) was found to be only 19 kmph.
“Delhi will run to a standstill. This is an inevitable consequence of explosive and unrestrained vehicle numbers that crossed 10 million in 2017,“ said Anumita Roy Chowdhury , executive director at CSE.
“The traffic numbers are further inflated by daily influx of vehicles from outside Delhi. With a further drop in car prices under GST, the congestion will only grow,“ she said. Currently, congestion on Delhi roads is growing at the rate of 7% annually .“ About 537 cars and 1,158 two-wheelers are added every day . If strategies to curb motorisa tion and reverse this trend aren't implemented, it will become increasingly more difficult to reduce toxic exposure to air pollution,“ Roy Chowdhury said.
Arterial roads to NCR cities are more congested. For example, Sri Aurobindo Marg connecting Gurgaon via NH 8 has an average speed of 24 kmph which often dropped to 7 kmph during evening peak hours. The average speed on Outer Ring RoadGhaziabad via NH9 was 27 kmhr.
CSE researchers said there is a clear link between higher nitrogen dioxide (NO2) levels and dropping traffic speeds. CPCB's real time monitoring data for NO2 from Anand Vihar, R K Puram, Mandir Marg and Punjabi Bagh shows that when the average morning peak speed of 28 kmph drops to 25 in the evening, NO2 levels increase from 68 micrograms per cubic metre to 94 -a rise of 38%.
Causes of accidents
Trucks cause 70% of night accidents
Though over one lakh truck drivers have been booked till date this year, it seems to hardly act as a deterrent for heavy vehicles turning into killer monsters on the city roads after a customary check at the border posts.
A traffic police survey shows that trucks account for shows that trucks account for over 70% of deaths on the roads past midnight. The most vulnerable stretches are Ring Road, Outer Ring Road and Mathura Road. It was found that 57.1% of all deaths by heavy vehicles were pedestrians.Also, 59.2% of heavy vehicles were registered in Haryana.
Only 2% of the vehicles entering the city can be stopped and checked thoroughly for fit ness , that too at selected places due to the shortage of staffers at night.
K K Kapila from International Road Federation said that lack of an integrated checking policy has resulted in untrained drivers being at the wheels of these vehicles.
Traffic experts said the on ly solution to this mess is alternative roads to divert heavy vehicles away from city . “There is no accountability of the drivers, unless the owners or people who hire them are held accountable for their illegal acts,“ said SP Singh, fellow of Indian Foundation of Transport Research and Training.
Burari-Bhalswa
Sidhartha Roy, Burari-Bhalswa to be a zero-fatality corridor, December 4, 2018: The Times of India
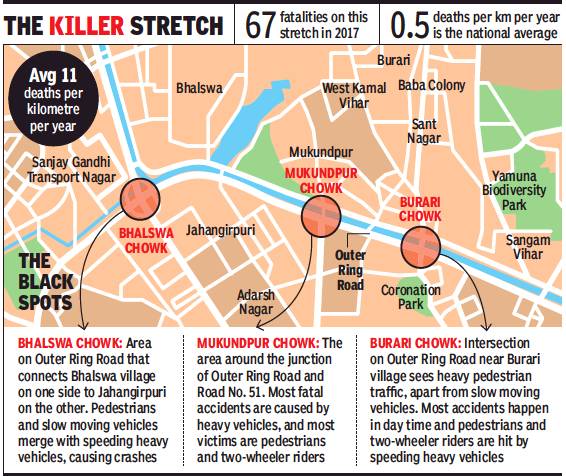
From: Sidhartha Roy, Burari-Bhalswa to be a zero-fatality corridor, December 4, 2018: The Times of India
The stretch of Outer Ring Road between Burari Chowk and Bhalswa Chowk, not more than three kilometres long, is arguably the capital’s deadliest, claiming 67 lives last year. It is this killer stretch that the Delhi government has chosen for a proposed ‘zero fatality corridor’.
“The average national figure of fatalities per kilometre is 0.5 in a year, while the average for this particular stretch is as high as 11 deaths per kilometre per year,” he said.
Tewari said that as part of the initiative, each road crash on this stretch would be investigated to find out the exact causes and also come up with counter measures.
Tewari said that while there are three hospitals in the vicinity, not even a single ambulance is deployed near the stretch to provide timely medical help.
According to Delhi Traffic Police, the major reason behind the high number of crashes on this stretch is due to the mix of heavy vehicles moving at high speed on the Outer Ring Road, along with large number of pedestrians, two wheelers and slow moving vehicles merging with this high-speed traffic after emerging from the narrow roads coming out of the residential areas nearby. The heavily congested areas along this stretch also witnesses heavy pedestrian movements and the highest number of casualties involves pedestrians at this stretch.
2017: worst stretches between 7am and 9pm
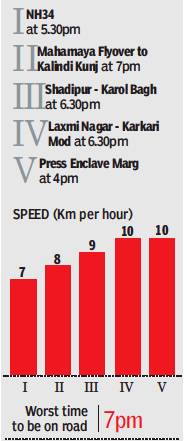
From: December 11, 2017: The Times of India
See graphic:
Traffic stretches, worst, in Delhi
2017: The ‘Chaos corridors’
Somreet Bhattacharya, Chaos corridors identified last year, July 20, 2018: The Times of India
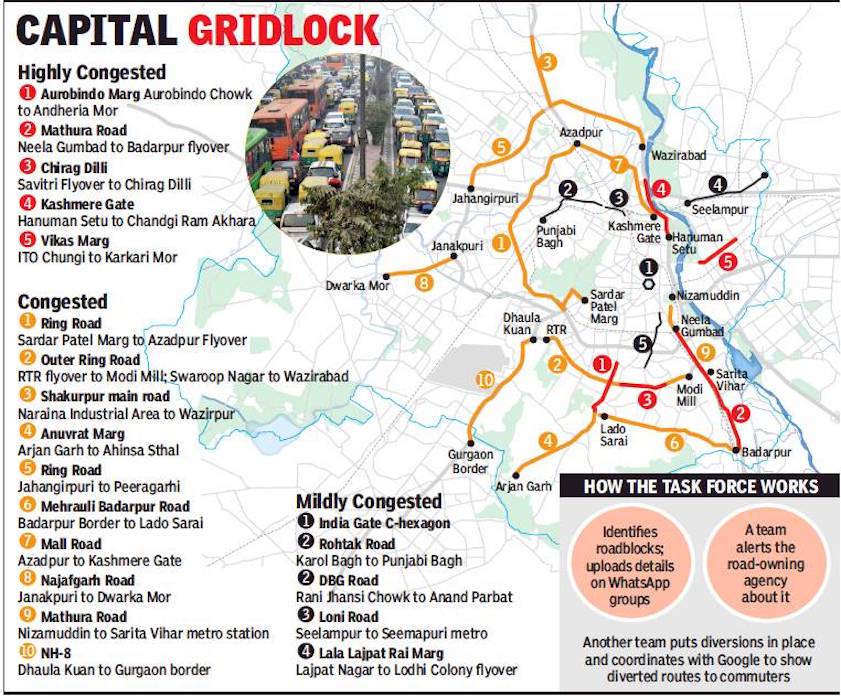
From: Somreet Bhattacharya, Chaos corridors identified last year, July 20, 2018: The Times of India
The 77 stretches that Delhi government plans to decongest were identified by a task force — comprising senior officers from traffic police, PWD, the three municipal corporations, NDMC and UTTIPEC — constituted by LG Anil Baijal last year.
The task force in their study had categorised the most congested stretches under A, B and C categories based on the volume of road users and visibility of corridors. Of these, 28 corridors with a traffic volume of more than 50,000 vehicles per day were put under A category and decongestion measures taken up on priority. Categories B and C were based on traffic volumes of 30,000 and 20,000 vehicles per day, respectively.
At least 40 points on these stretches were identified by the task force where encroachments could be removed to make the roads wider. Illegal parking was responsible for 80% of the snarls. The study also found that most of the selected stretches fall on Ring Road and Outer Ring Road. Bottlenecks under flyovers or near U-turns require decongestion to smoothen the flow of traffic. Potholes were found to be the primary factor for slowing down traffic. The task force had hauled up PWD and the municipal corporations for this and directed them to relay asphalt on the stretches.
The transport commissioner was made the nodal person and advised to fasttrack the parking policy, reroute interstate buses and ensure that buses do not ply without proper permits. All the stakeholders were asked to ensure that there was no reencroachment on the stretches that had been cleared.
Baijal had asked the local police to assume responsibility for maintaining encroachment-free stretches. The three corporations were also asked to revisit their licensing norms for commercial establishments so that they could be linked with availability of adequate parking space.
2018
Dipak Dash, Nov 17, 2019: The Times of India
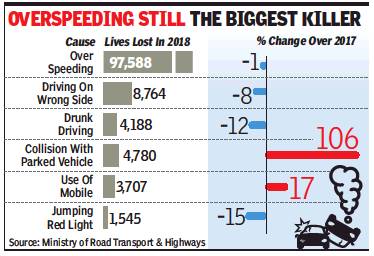
From: Dipak Dash, Nov 17, 2019: The Times of India
Wrong-side driving claimed at least 24 lives daily on Indian roads during 2018 and another 4,800 persons died in accidents caused due to collision with other parked vehicles. While the number of people killed in accidents caused due to driving against the flow of traffic reduced by nearly 9% from 2017, fatalities due to accidents involving parked vehicles nearly doubled last year as compared to those in 2017, according to the latest road accidents report.
Traffic safety experts said these two trends have exposed the failure of enforcement agencies across all roads, including on National Highways, where one can spot people violating the traffic norms and endangering others. The report released by the road transport ministry on Friday also revealed an alarming rise in the number of all road fatalities in 2018, with 3,500 more people losing their lives on roads than in 2017, taking the total toll to over 1.5 lakh.
According to the report, nearly one-fourth of the fatalities caused due to wrong-side driving were reported from UP where 2,253 people were killed in such accidents. Bihar and Punjab also reported higher number of such accidents and fatalities. “First of all, road-owning agencies don’t build service roads and the designs are also faulty. So, you see rampant violation of this norm. Poor enforcement makes the conditions more deadly,” said Harman Singh Sidhu, who moved courts against liquor shops along NHs.
15k passengers flouting seatbelt rule died in ’18
Considering that wrong-side driving can cause fatal accidents, the government has brought this offence under the “dangerous driving” category and the penalty for such violation has been increased significantly in the amended Motor Vehicle Act.
The Centre has notified minimum fine of Rs 1,000 to Rs 5,000 and up to six months’ jail for first offence and has increased the fine for repeat offence to up to Rs 10,000 and jail term of six to 12 months.
In the case of collision with parked vehicles resulting in deaths, Uttar Pradesh reported the maximum of 1,299 fatalities in 2018 followed by Gujarat where 478 people died in such accidents. “We hardly have any highway policing system and patrolling is also insignificant on our roads. In majority cases, drivers simply leave the vehicles parked on the middle of the road without placing the warning signage for other vehicles,” said Hardeep Singh, president of Arrive Safe, a not-for-profit organisation working for road safety.
Report underlines importance of seatbelts
As many as 9,349 drivers died in accidents for not wearing seatbelt last year, the number of passengers killed for the same reason was over 15,000.
However, in the case of non-wearing of helmets, the number of drivers getting killed was far more than pillion riders. According to the report, while 28,250 two-wheeler drivers were killed for not wearing helmets, the number of pillion riders killed were 15,364.
SEE FLAP OPPOSITE In the case of collision with parked vehicles resulting in deaths, UP reported the maximum of 1,299 fatalities in 2018 followed by Gujarat
2018/ Cluster Buses: Violations Far More Than By DTC
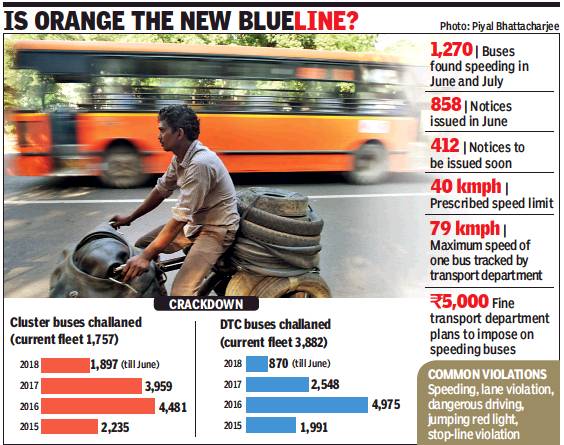
From: Sidhartha Roy & Somreet Bhattacharya, Half the fleet, but twice the havoc, July 25, 2018: The Times of India
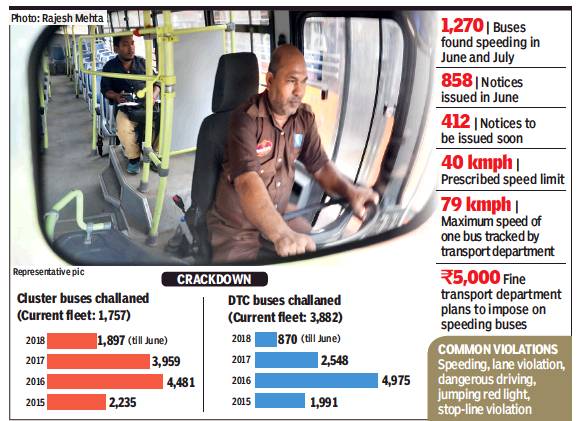
From: Sidhartha Roy, August 18, 2018: The Times of India
Violations By Cluster Buses Far More Than Those By DTC
Is the orange cluster bus service the new Blueline of the capital’s roads? The data from the transport department reveals that the cluster buses, like the Blueline ones, are becoming infamous for accidents, rash driving and speeding. The accident in Nand Nagri on Tuesday, which caused the death of two people, has again highlighted the need to rein in the reckless bus drivers.
In the last two months, Delhi government’s transport department has tracked 1,270 cluster buses for speeding. The figure is alarming because the fleet under the cluster scheme numbers just 1,757. Delhi Transport Corporation, which has a bigger fleet of 3,882 buses, has been involved in fewer violations than their cluster counterparts.
Speeding is a big problem, and in the month of June alone, the transport department issued notices to 858 cluster buses for speeding. Till date in July, 412 buses have been identified as breaking the speed limits. The rationale behind running buses through the cluster scheme was to allow a single concessionaire to run on one cluster of routes and thus avoid competition. The Blueline bus scheme had suffered this drawback, with competition leading to rash driving. However, since the orange concessionaires are being paid per kilometre, the idea seems to have been defeated.
“The drivers tend to cover more kilometres quickly and cover the route in as short a time as possible because they have no incentive in driving carefully or halting properly at the bus stops,” a transport department official said. “This leads to careless driving, putting the lives of other people on the road in danger.”
The official further disclosed, “We were getting complaints about cluster buses being driven rashly and crossing the prescribed speed limit. We started tracking these buses and found that instead of the prescribed 40 kmph, most of them were running at speeds above 60 kmph.” One bus from the Rajghat depot, he disclosed, was determined to be moving at 79 kmph.
The notices for speeding in June and July have been sent to the concessionaire concerned. “The notices were issued for violation of permit condition and they have been given 15 days’ time to give us an explanation. We did receive responses to most of the notices, but not all of them are satisfactory,” the transport official said.
The transport department is waiting for the remaining concessionaires to reply before levying a fine of Rs 5,000 on each bus. “The fine has been deliberately kept hefty in order to deter drivers from contravening the speed limits. Moreover, in case we find some that are repeat offenders, we will take stricter action and may even cancel their permits,” the official said.
Police sources said that most lane violations by buses take place in the peak hours between 9am and noon. Much of this is due to the cluster bus drivers trying to complete the journey in the least time possible. According to the traffic police, last year 4,116 drivers were booked in west Delhi and outer Delhi, followed by 3,652 in south and central Delhi. In east Delhi and adjoining areas, 2,323 drivers were hauled up.
The cops reiterated that the left side of the roads is earmarked for buses and this was being freed on 28 corridors in the capital as part of the anti-encroachment drive. However, police have observed that bus drivers casually break the lane norms during the peak hours to reach their destinations quickly.
The transport department has an Operations Control Centre where all public transport vehicles, including buses, are tracked. All cluster buses, which are run by private concessionaires but operated by the Delhi Integrated Multi-Modal Transit System (DIMTS), have GPS devices installed in them to help the department pinpoint their location and rate their speed. Buses run by Delhi Transport Corporation not all have functional GPS devices.
The DIMTS spokesperson, when contacted, offered no comments on this story.
2015-18
Somreet Bhattacharya, August 21, 2019: The Times of India
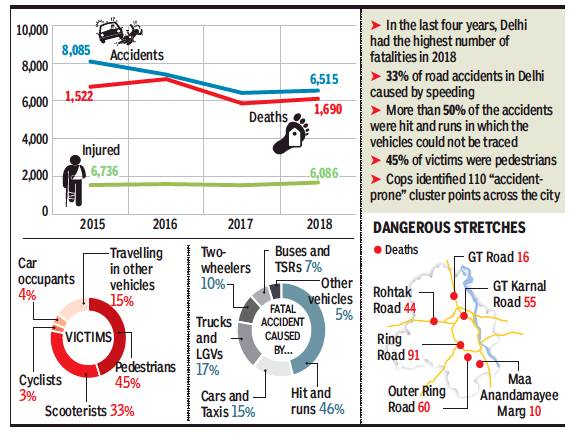
Accidents: vehicle-wise
Accident- prone areas.
From: Somreet Bhattacharya, August 21, 2019: The Times of India
5-yr high: 1 person died on city roads every 5 hours in 2018
New Delhi:
One person died in a road accident in Delhi every five hours on average in 2018 as road fatalities rose to a fiveyear high in the capital and remained the highest for any city in the country.
More worryingly, nearly half of these crashes (46%) were hit-and-run cases in which the killer vehicle could not be identified. As many as 61 spots across the city were found prone to hit-and-run accidents.
According to data released by the traffic police, Delhi recorded 1,690 road deaths in 2018, one-third of which were caused due to speeding while 7-10% were due to dangerous driving (changing lanes, performing stunts, etc).
It was found that apart from human factors, defective and insufficient road designs resulted in the increase in the number of accidents, an issue that city planners need to address urgently. Among accidents caused due to defective road designs, it was found that 40% occurred due to unguarded civic works while 33% were caused by bad light conditions. Alarmingly, 20% of such road deaths were traced to bumpy roads or potholes.
As usual, pedestrians were the major victims, accounting for 65% of road deaths — 1,098 pedestrians lost their lives on city roads last year.
Ring Road was found to be the deadliest stretch, followed by Outer Ring Road and G T Karnal Road. Among the killer vehicles that could be identified, private cars and taxi drivers were found involved in 15% of the road deaths. Trucks and LCVs accounted for 11%.
A large number of pedestrians deaths took place involving cars and cabs took place near multi-intersection hubs like bus stops or metro stations. Cops found the lack of last-mile connectivity resulted in mishaps at such spots.
In 2018, buses caused more fatal accidents than in 2017
Seemapuri, Najafgarh, Mandawali Emerge As Killer Zones
Though buses were responsible for about 5% of the total fatalities, what is worrying is the number is higher than previous years — 91 fatal accidents in 2018 as compared to 78 in 2017. Areas such as Seemapuri, Najafgarh and Mandawali were found to be killer zones for these vehicles.
It was found that the number of accidents tends to increase after 7pm and the trend continues till 2am. Cops attribute this to the lifting of no-entry regulations for commercial vehicles. During the study they found that the concentration of accidents is high in densely populated areas adjoining arterial roads or national highways.
In 2018, cops identified 110 cluster points across the city that were prone to fatal accidents. The points were selected on the basis of three or more accidents happening within an area of 500 metres. Of these, 33 points were found to be accident prone zones for pedestrians, while 15 were found to be accident prone for two-wheelers or cyclists.
In 2018, 108 accident-prone spots showed an increase in the number of accidents. Among them Kashmiri Gate Chowk was found to be the deadliest. Around 25% of fatal accidents were found to have occurred within a road length of 80km in the city.
The study found that most of the accidents involving two-wheelers occurred in areas around north and north-east Delhi, where the density of scooters and motorbikes was found to be high. Cops also found that the stretch through Nirankari Colony, Timarpur and Mukundpur Chowk was the most dangerous for twowheeler riders, who tended to enter the high-speed corridor on the Ring Road from minor roads connecting the colonies. Cops added that the lack of U-turns on this stretch results in riders driving on the wrong side, leading to accidents.
2018, rash driving
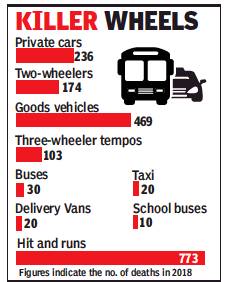
From: Somreet Bhattacharya, Rashly driven private cars killed over 200 people in 2018, January 9, 2019: The Times of India
Rashly-driven private cars are the biggest killers on Delhi roads, killing 236 people in 2018, says data by traffic police. Death by two-wheeler riders and heavy goods vehicles continue to be one of the major causes of death as well. Interestingly, the data shows a dip in the number of deaths by DTC buses while school buses killed 10 people compared to a single death the year before.
Last year, there had been a sharp rise in the number of deaths caused by cluster buses, taxis and tempos. The number of hit and run cases too rose from 704 to 773. Cops had found that 65% of the accidents took place due to an error by the driver, out of which 24% were caused due to speeding and 14% due to dangerous driving like disobeying traffic rules.
What has cops worried is the increase in number of fatal accidents involving public vehicles TSRs and tempos that carry a bulk of commuters. The numbers rose from 95 in 2017 to 135 in 2018. Most accidents took place between July and October.
Poor lighting on roads led to 56% of the road accidents, whereas 39% were caused due to potholes.
Central and east Delhi are more prone to non-fatal accidents whereas roads in west and outer Delhi were found to cause more deaths deaths. Police officers said that speed breaker-free roads and more highways make drivers prone to speeding.
According to earlier studies, areas around Janakpuri, Najafgarh, Tilak Nagar, Mayapuri and Bawana were more prone to accidents involving heavy vehicles, mostly hit and runs.
Cops suggest that unnecessary cuts on median roads to allow vehicles or pedestrians to cross over should be closed. Identification of merging points of minor roads to the arteries (Tpoints) has also been proposed. All major intersections can also be slightly elevated and with less smooth commute to slow down vehicles has been suggested as well.
.
Accident Prone Areas, the 137 worst
In the alphabetical order
|
SNO. |
ACCIDENT PRONE ZONE |
ACCIDENTS |
ROAD NAME |
TRAFFIC CIRCLE |
||
|
SIMPLE |
FATAL |
TOTAL |
||||
|
AGGARWAL MILLENIUM TOWER |
12 |
4 |
16 |
SHAHEED JAGAT NARAIN |
RHN |
|
|
AIIMS |
11 |
1 |
12 |
RING ROAD |
DFC |
|
|
AKSHARDHAM MANDIR |
6 |
4 |
10 |
NH-24 |
KPC |
|
|
ALI VILLAGE |
11 |
3 |
14 |
MATHURA ROAD |
SVC |
|
|
ANAND VIHAR ISBT |
14 |
6 |
20 |
ROAD NO.56 |
VKC |
|
|
APOLO HOSPITAL |
15 |
4 |
19 |
MATHURA ROAD |
SDV |
|
|
ASHRAM CHOWK |
18 |
3 |
21 |
RING ROAD |
LNC |
|
|
AZADPUR CHOWK |
7 |
4 |
11 |
GTK ROAD |
MTC |
|
|
AZADPUR SABZI MANDI |
5 |
5 |
10 |
GTK ROAD |
MTC |
|
|
BAKOLI BUS STAND |
5 |
3 |
8 |
GTK ROAD |
ALP |
|
|
BARAPULLA RING ROAD |
8 |
6 |
14 |
RING ROAD |
LNC |
|
|
BHAJANPURA CHOWK |
23 |
1 |
24 |
WAZIRABAD ROAD |
SLC |
|
|
BHALSWA CHOWK |
8 |
4 |
12 |
OUTER RING ROAD |
NRL |
|
|
BIRLA INST OF MANAGEMENT TECH |
21 |
4 |
25 |
LAL BAHADUR SHASTRI |
SGV |
|
|
BRITANNIA CHOWK |
20 |
4 |
24 |
RING ROAD |
AVC |
|
|
BUDHPUR GANDA NALA/HANUMAN MANDIR BUDHPUR |
11 |
0 |
11 |
GTK ROAD |
NRL |
|
|
BURARI CHOWK |
15 |
2 |
17 |
OUTER RING ROAD |
NRL |
|
|
CHIRAG DELHI FLYOVER |
13 |
2 |
15 |
JOSEF BRIJ TITO MARG |
GKC |
|
|
CNG PUMP SANJAY GANDHI T-POINT |
3 |
7 |
10 |
GTK ROAD |
NRL |
|
|
DABRI FLYOVER |
15 |
2 |
17 |
PANKHA ROAD |
JPC |
|
|
DC OFFICE |
11 |
0 |
11 |
MEHRAULI BADARPUR RD |
SKT |
|
|
DELHI GATE |
10 |
4 |
14 |
N. SUBHASH MARG |
DGC |
|
|
DELHI PUBLIC LIB/SRINIWAS PURI |
17 |
1 |
18 |
MATHURA ROAD |
LNC |
|
|
DHARAMPURA RED LIGHT |
12 |
1 |
13 |
G.T.ROAD |
SHD |
|
|
DHAULA KUAN |
12 |
2 |
14 |
RING ROAD |
DCC |
|
|
DND FLYOVER |
10 |
2 |
12 |
RING ROAD |
LNC |
|
|
DR BHABHA MARG CROSSING |
17 |
8 |
25 |
56 NO ROAD |
VKC |
|
|
DTC BUS DEPOT NAND NAGARI |
14 |
5 |
19 |
WAZIRABAD ROAD |
SPC |
|
|
EAST VINOD NAGAR/MV II RED LIGHT |
11 |
3 |
14 |
NH-24 |
KPC |
|
|
EMPLOYEMENT EXCHANGE |
6 |
3 |
9 |
KARIYAPPA MARG |
DCC |
|
|
ESI HOSPITAL, ANAND MAI MARG |
11 |
1 |
12 |
ANAND MAI MARG |
KKC |
|
|
FAIZ ROAD CROSSING/IDGAH |
11 |
2 |
13 |
FAIZ ROAD |
KBC |
|
|
FIRE STATION NAJAFGARH |
11 |
3 |
14 |
DHANSA ROAD |
NJC |
|
|
GAGAN CINEMA |
13 |
4 |
17 |
WAZIRABAD ROAD |
SPC |
|
|
GAJIPUR DAIRY FARM |
5 |
5 |
10 |
|
KPC |
|
|
GEETA COLONY FLYOVER |
10 |
1 |
11 |
YAMUNA PUSTA ROAD |
GNC |
|
|
GOKAL PURI |
14 |
3 |
17 |
WAZIRABAD ROAD |
SLC |
|
|
HAIDER PUR |
15 |
2 |
17 |
OUTER RING ROAD |
RHN |
|
|
HAMDARD NGR RED LIGHT |
25 |
3 |
28 |
MEHRAULI BADARPUR RD |
KKC |
|
|
HAYAAT HOTEL |
15 |
4 |
19 |
RING ROAD |
RKP |
|
|
HIRAN KUDNA |
1 |
3 |
4 |
ROHTAK ROAD |
NLC |
|
|
INDIRA PARK |
15 |
6 |
21 |
SHANI BAZAR ROAD |
MGP |
|
|
ISBT K. GATE |
22 |
7 |
29 |
RING ROAD |
CLC |
|
|
ITO/I P FLYOVER |
12 |
6 |
18 |
RING ROAD |
DGC |
|
|
JAITPUR MORE |
27 |
5 |
32 |
MATHURA ROAD |
SVC |
|
|
JANAKPURI EAST |
15 |
4 |
19 |
NAJAFGARH ROAD |
TNC |
|
|
JANGPURA EXTN |
19 |
2 |
21 |
MATHURA ROAD |
LNC |
|
|
KALKAJI MANDIR |
12 |
1 |
13 |
OUTER RING ROAD |
KKC |
|
|
KANHIYA NAGAR METRO STN |
16 |
3 |
19 |
|
AVC |
|
|
KARAN VATIKA NIHAL VIHAR |
7 |
3 |
10 |
NANGLOI NAJAFGARH RD |
NLC |
|
|
KARKARI MORE |
8 |
2 |
10 |
57 NO ROAD |
VKC |
|
|
KASHMIRI GATE CHOWK |
16 |
9 |
25 |
BOULEVARD ROAD |
CLC |
|
|
KAYA MAYA HOSPITAL |
4 |
4 |
8 |
MEHRAULI BADARPUR RD |
KKC |
|
|
KHAJOORI CHOWK |
15 |
6 |
21 |
WAZIRABAD ROAD |
SLC |
|
|
KHANPUR T-POINT |
16 |
2 |
18 |
MEHRAULI BADARPUR |
SGV |
|
|
KHEL GAON |
10 |
2 |
12 |
NH-24 |
KPC |
|
|
KHICHADI PUR |
12 |
4 |
16 |
NH-24 |
KPC |
|
|
KIRARI MORE |
12 |
3 |
15 |
ROHTAK ROAD |
NLC |
|
|
LADO SARAI |
11 |
3 |
14 |
MEHRAULI GURGAON RD |
MRC |
|
|
LAJPAT NAGAR |
8 |
5 |
13 |
LALA LAJPAT RAI PATH |
DFC |
|
|
LAJPAT RAI MRKT (LAL QILA) |
8 |
4 |
12 |
N. SUBHASH MARG |
KOT |
|
|
LAJWANTI CHOWK |
8 |
4 |
12 |
JAIL ROAD |
JPC |
|
|
LIBASPUR BUS STAND |
3 |
7 |
10 |
GTK ROAD |
ALP |
|
|
LONI ROAD CROSSING |
15 |
2 |
17 |
WAZIRABAD ROAD |
SPC |
|
|
MAHIPALPUR FLYOVER |
20 |
7 |
27 |
NH-8 |
VVC |
|
|
MAJNU KA TILA |
8 |
2 |
10 |
OUTER RING ROAD |
CLC |
|
|
MANGOL PURI FLYOVER |
15 |
4 |
19 |
OUTER RING ROAD |
MGP |
|
|
MAYA PURI CHOWK |
13 |
4 |
17 |
RING ROAD |
MPC |
|
|
MAYUR VIHAR EXTENSION |
12 |
3 |
15 |
NOIDA LINK ROAD |
KPC |
|
|
METRO STATION MADI PUR |
7 |
3 |
10 |
ROHTAK ROAD |
PBC |
|
|
METRO STATION PASCHIM VIHAR |
11 |
3 |
14 |
ROHTAK ROAD |
PBC |
|
|
MODI MILL FLYOVER |
13 |
3 |
16 |
OUTER RING ROAD |
KKC |
|
|
MONESTRY RING ROAD |
9 |
4 |
13 |
RING ROAD |
CLC |
|
|
MOOLCHAND |
16 |
3 |
19 |
RING ROAD |
DFC |
|
|
MOTI BAGH FLYOVER |
16 |
2 |
18 |
RING ROAD |
RKP |
|
|
MOTI NAGAR FLYOVER |
13 |
2 |
15 |
PATEL ROAD |
PNC |
|
|
MUKHAND PUR CHOWK |
9 |
9 |
18 |
OUTER RING ROAD |
NRL |
|
|
MUKHARBA CHOWK |
9 |
6 |
15 |
GTK ROAD |
NRL |
|
|
MUNIRKA |
13 |
3 |
16 |
OUTER RING ROAD |
VVC |
|
|
NANAKSHAH GURUDWARA BUS STAND |
12 |
3 |
15 |
WAZIRABAD ROAD |
SLC |
|
|
NANGLOI DTC DEPOT |
14 |
5 |
19 |
Indpaedia team: Do NOT put any text below this point
|||
