Marriage statistics: India
(→2011: Durability of marriages) |
(→Widows: 2011) |
||
| Line 110: | Line 110: | ||
MARRIAGE STATISTICS: INDIA]] | MARRIAGE STATISTICS: INDIA]] | ||
| − | + | =Widows= | |
| + | == 2011== | ||
[http://epaperbeta.timesofindia.com//Article.aspx?eid=31808&articlexml=Massive-spike-in-number-of-widows-03032015013017 ''The Times of India''] | [http://epaperbeta.timesofindia.com//Article.aspx?eid=31808&articlexml=Massive-spike-in-number-of-widows-03032015013017 ''The Times of India''] | ||
| Line 125: | Line 126: | ||
Among states, Kerala has 6.7% and TN 6.4% of the widowed population. Obviously , states with significant elderly population will have more widows. Arokiasamy said, “Definitely, TN and Kerala, and to an extent AP and Karnataka, have reached the last stage of the transition with low fertility and low mortality.” | Among states, Kerala has 6.7% and TN 6.4% of the widowed population. Obviously , states with significant elderly population will have more widows. Arokiasamy said, “Definitely, TN and Kerala, and to an extent AP and Karnataka, have reached the last stage of the transition with low fertility and low mortality.” | ||
| + | |||
| + | [[Category:India|M MARRIAGE STATISTICS: INDIAMARRIAGE STATISTICS: INDIAMARRIAGE STATISTICS: INDIAMARRIAGE STATISTICS: INDIA | ||
| + | MARRIAGE STATISTICS: INDIA]] | ||
| + | [[Category:Pages with broken file links|MARRIAGE STATISTICS: INDIAMARRIAGE STATISTICS: INDIAMARRIAGE STATISTICS: INDIA | ||
| + | MARRIAGE STATISTICS: INDIA]] | ||
| + | [[Category:Society|M MARRIAGE STATISTICS: INDIAMARRIAGE STATISTICS: INDIAMARRIAGE STATISTICS: INDIAMARRIAGE STATISTICS: INDIA | ||
| + | MARRIAGE STATISTICS: INDIA]] | ||
| + | |||
==Women more likely to be married than men: 2011== | ==Women more likely to be married than men: 2011== | ||
[http://epaperbeta.timesofindia.com//Article.aspx?eid=31808&articlexml=293cr-wives-287cr-hubbies-Census-bares-polygamy-truth-03032015013005 ''The Times of India''] | [http://epaperbeta.timesofindia.com//Article.aspx?eid=31808&articlexml=293cr-wives-287cr-hubbies-Census-bares-polygamy-truth-03032015013005 ''The Times of India''] | ||
Revision as of 07:05, 19 March 2022

This is a collection of articles archived for the excellence of their content. |
Contents |
The issues
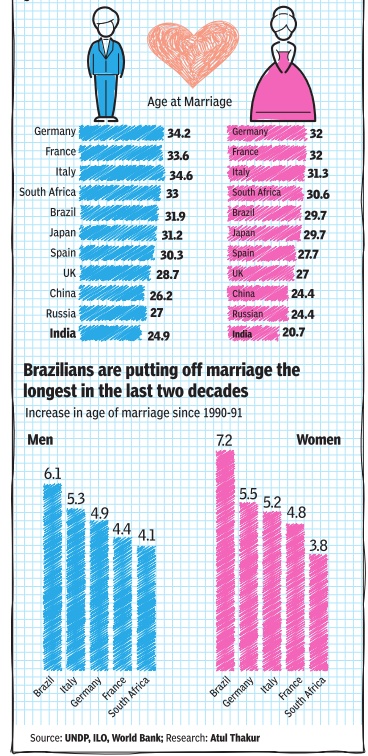
Age at marriage: 2011

See graphic: Age at marriage in India, China and other major countries, 2011
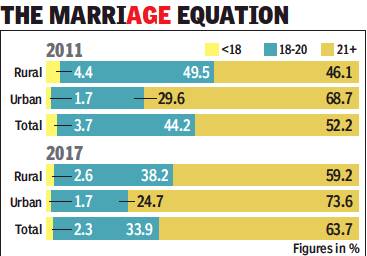
2011-17: the decline continues
Bharti Jain, July 17, 2019: The Times of India

From: Bharti Jain, July 17, 2019: The Times of India
In a development that has positive implications for women’s health, the Sample Registration System survey 2017 has put the all-India percentage of women married at less than 18 years of age at 2.3%, way below the 2011 census figure of 3.7%. In rural areas, this percentage is down to 2.6% from 4.4% recorded during 2011 census. The percentage of women in urban areas who married short of adulthood, however, remains unchanged at 1.7%.
As per the latest survey to be released, the national mean age at effective marriage for females in 2017 was 22.1 years and varied from 21.7 years in rural areas to 23.1 years in urban areas. Census 2011 had returned the mean age of marriage of women at 21.2 years.
Talking of individual states, the mean average age of women at the time of marriage in Bengal was 21.2 years, while in J&K it was 25.1 years in 2017. The SRS survey found that 63.7% of India’s women got married at above 21 years of age, a figure that Census 2011returned as 52.2%. What’s more, the percentage of women in rural India beyond 21 years of age at the time of marriage was recorded at 59.2% in SRS 2017, up from 46.1% during census 2011. In urban areas, percentage of women aged over 21 at effective marriage grew to 73.6% in SRS 2017 from 68.7% recorded in the last decennial exercise. Around 33.9% women across India — 38.2% in rural India and 24.7% in urban India — got married between 18 and 20 years of age, as per the 2017 SRS survey. The corresponding all-India figure for Census 2011 was 44.2%, with rural and urban percentages at 49.5% and 29.6%, respectively.
Among the states, Jharkhand recorded an all-India high of 4.2% of women who were non-adults at the time of marriage in SRS 2017, followed by Bengal at 3.6%, Rajasthan at 3.5% and Bihar at 3.3%. Significantly, in rural Bengal, the percentage of females who were not adults at the time of marriage fell to 3.9% in 2017 from a high of 9.9% reported by Census 2011.
The state with the lowest percentage of sub-adult women at effective marriage, as per SRS 2017, was Delhi (0.4%), followed by Kerala (1.3%).
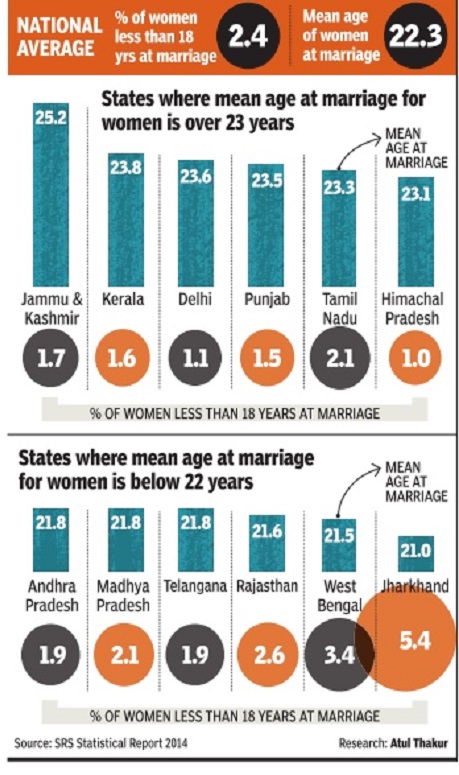
Age at marriage: 2014
Released data from Sample Registration System (SRS) lists the average age at which women across the country's major states marry. It is the highest in Kashmir at a little over 25 years on average. In contrast, women in Jharkhand are around four years younger when they get married. The data seems to suggest that low average age of marriage might be linked to a relatively higher percentage of underage (less than 18 yrs) marriages
See graphic
Child marriage
Sharp decline: 2001
The Times of India, May 28 2016
Subodh Varma

Underage brides down from 44% to 30% in 10 yrs: Census There has been a drama tic decline in child mar riage in India, across various religious communities and even among less educated sections, Census 2011 data reveals. The share of girls getting married before reaching the legal marriage age of 18 years fell steeply from 44% in 2001 to 30% in 2011, a proportion still unconscionably high.
Hindus and Muslims have almost the same proportion of below-legal age marriages of girls at about 31%, down from 43-45% a decade ago. Sikhs and Christians have the lowest share of underage girls getting married, at 11-12%, with the Jain community only slightly more at 16%. While Buddhists continue to be more in line with Hindus and Muslims, with 28% underage girls getting married, among com munities of other religious persuasions -including Parsis and all ancient tribal faiths -the proportion is about 24%, down from 36%.
This round of Census data yet again shows that in all important matters of marriage, children and such, there are similar trends across religious communities. As other data has shown, declining fertility rates, increasing age of marriage, gaps and order of children etc are following similar trends.In fact, in a somewhat muted form, some of the social evils such as preferring a son and dowry too are spreading evenly . All this is probably a result of the culturally intertwined lives of all peoples across faiths. Data from Census 2011 re leased on Friday reaffir med that the more educated the girl, the later she gets married. Thus, among illiterate girls, 38% were married off before 18 years but among graduates or above, just 5% got married below the legal age. But another surprising t emerges. There is a sharp fact emerges. There is a sharp decline in the share of girls getting married before 18 even among the illiterate or those with below-secondary level education. Among illite rates, in 2001, a whopping 51% of married women had tied the knot before reaching 18.That share had plunged to 38% in 2011, still high but considerably lower than a decade ago. Similarly , among girls who could study till middle school but dropped out before class 10, the share of those getting married before 18 years fell from 34% to 25%.
However, 91% of all married women were married by the time they reached 25 years of age in 2011, indicating that too much delay is not yet acceptable socially . In 2001, this proportion was 94%.
Durability of marriages
2011
The Times of India, Jan 18 2016

Subodh Varma
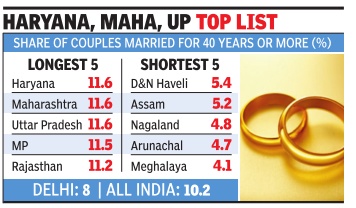
Marriages last the longest in N India, Maha; least in NE
Most north Indian states, from Punjab to Bihar, and Maharashtra in the west, have a high share of couples married for 40 years or more -they make up 1112% of all couples, latest data from the 2011 Census shows.At the other extreme, the entire northeastern belt has less than 7% of such marriages. In Meghalaya, just 4.1% of all couples have been married for 40 years or more, one-third of Haryana or Maharashtra. Across the country , couples married for 40-plus years account for 10% of all couples. Sociologists say this dra matic variation in duration of marriage across India has less to do with fidelity and love, and more with customs and health. Two key factors deter mine the duration of marriage -the couple's age when they get married and how long they live. Since life spans are increasing all over, married life too is getting longer.
In most parts of the northern belt, traditionally , the average age of marriage is less. This is changing, but slowly.So, early marriage and longer life means many more longlasting marriages. Of course, the divorce rate too is still quite low in India -just 1.1% of all marriages.
Professor Bimal Kar of Gauhati University told TOI that the low share of 40-plus marriages was mainly due to higher age of marriage and lower life spans.
The Census data bears this out: in Haryana, 21% of married men tied the knot before reaching 21 years (the legal minimum for marriage) compared to just 11% in Meghalaya. Similarly, 31% of married Haryanvi women were married before reaching the legally allowed 18 years, compared to 15% in Meghalaya.
Widows
2011
Massive spike in number of widows
Mar 03 2015
B Sivakumar
There has been a huge in crease in the number of widows in India since 2001, according to just-released Census 2011 data. India's population in 2011 was 121 crore and, of this, 4.6% or 5.6 crore are widowed, with women outnumbering men by a long way .In 2001, only 18.5 lakh or 0.7% of the then population of 102 crore was widowed. While Census officials are surprised by the magnitude of the spike, they say there has been no change in Census parameters for 2011. “The only change was with regard to separation and divorcees.While in 2001, both were clubbed together, in 2011, it was collected as two separate entities,“ said Census commissioner C Chandramouli.
Experts feel the increase in life expectancy , particularly of women, is the main reason for the jump. “It is a global phenomenon that women live longer and in India, too, it is catching up since the 1990s,“ international population ex pert P Arokiasamy told TOI.Apart from this, there is most often an age gap between men and women during marriage.As life expectancy for women increases, they live as widows for longer, he said.
Among states, Kerala has 6.7% and TN 6.4% of the widowed population. Obviously , states with significant elderly population will have more widows. Arokiasamy said, “Definitely, TN and Kerala, and to an extent AP and Karnataka, have reached the last stage of the transition with low fertility and low mortality.”
Women more likely to be married than men: 2011
The Times of India Mar 03 2015
Atul Thakur
29.3cr wives, 28.7cr hubbies: Census bares polygamy truth
15 Lakh Under-15 Girls Married: 2011 Survey
Just-released Census data shows there are about 66 lakh more women who are “currently married“ than men. While part of this might be accounted for by married men who have migrated abroad for work leaving their wives behind, the data also indicates that there are a very large number of women in polygamous marriages.
The data also shows that in 2011, the Census year, more than 18 lakh girls under the age of 15 were married.
Of the total 120 crore population about 58 crore were married at the time of the Census. This number does not include those divorced, wi dowed or separated. Among these 58 crore married persons, 29.3 crore were women while 28.7 crore were men. A state-wise comparison of married women and men shows the migration effect.For instance, Kerala has the highest skew with 1.13 married women for every married man. It is followed by Uttarak hand, Himachal, UP and Bihar, where this ratio ranges from 1.04 to 1.07. These are all states with high outflows of migrant workers. On the flip side, Maharashtra, Gujarat and Delhi, states known for a high influx of migrant labour, have more married men than women.
Another male-female skew is in proportions of the two genders married in dfferent age groups. In the 20-24 age group, about 69% of women were married while just over 30% of men were married.The difference between proportion of married men and women to the total population of an age group gradually decreases after 24 years of age.
Woman-headed households, state-wise: 2011
Sources: The Times of India, Apr 29 2015; Rema Nagarajan
The Times of India, Jun 06 2015


Married women head 4% of families
Female-headed households form 34th of those led by a widowed person: Census
According to census 2011, a little over 13% of households in the country are headed by women.With about four in every ten houses headed by a women, Lakshadweep has the highest proportion of such households. It is followed by Kerala, Goa, Meghalaya and Himachal Pradesh. Apart from the matrilineal tradition, there are other social and economic reasons behind the presence of femaleheaded households. These include widowhood, divorce, separation, migration of male members for long periods and loss of economic ability of males because of disability
Among those currently married, barely 4% of all households are headed by women. In sharp contrast, women-headed households constitute nearly three-fourths of those headed by a widowed person, about two-thirds of those headed by people separated and about 60% among those who are divorced. Given the fact that women vastly outnumber men in each of these three categories, that's not surprising. Among the larger states, the proportion of womenheaded households in those who are currently married is the highest in Kerala (9.7%) followed by Himachal and Uttarakhand with 8% and 8.4%, respectively. This proportion is lowest in Gujarat, just 2%, followed by Delhi (2.3%) and West Bengal (2.5%). This was revealed in the latest census data on marital status, sex and age of household heads released. Over 70% of currently married men are household heads, compared to barely 3% of the married women the data showed.
Even among the women headed households, a significant chunk could be because the male members have migrated out for work, which would explain why a state like Uttarakhand has such a high proportion, though cultural factors could also be playing a role in states like Kerala and Meghalaya.
When households comprising married couples were grouped according to the age of the household head, the data showed an interesting pattern -women-headed households formed a larger proportion among households where the head was below 20 years of age. This proportion was 10.6% at the national level. The proportion of womenheaded households kept falling as the age of household heads increased till it touched 3.3% in the 50-59 age group.Beyond 59 years, the proportion of women-headed households rose slowly , till it touched 7% in the 80+ age group.
The pattern is repeated in almost every state, though the exact age group at which the declining trend reverses varies from state to state.
If smaller states are also counted, Meghalaya had the highest proportion of women-headed households (9.8%), marginally higher than Kerala, among those currently married. Kerala has the highest proportion of womenheaded households in the lower age groups. About 24% of households headed by people aged below 20 years are women-headed. This rises to 35% of households with heads aged 20-29, falls to 22% in the 30-39 age group and then keeps falling as the age of the household head increases.
Though the number of widowed men is much lower than widowed women, 70% of widowed men headed their households against only 51.7% of widowed women.This could mean that almost half the 43.3 million widowed women live as dependents.

