National Capital Region (India): Economic Scenario
This article has been sourced from an authoritative, official readers who wish to update or add further details can do so on a ‘Part II’ of this article. |
Contents |
The source of this article
Draft Revised Regional Plan 2021: National Capital Region
July, 2013
National Capital Region Planning Board, Ministry of Urban Development, Govt. of India, Core-4B, First Floor, India Habitat Centre, Lodhi Road, New Delhi-110003
National Capital Region Planning Board
National Capital Region (India): Economic Scenario
BACKGROUND
The size and nature of economic activities in NCR have changed over the years. Improvement of urban infrastructure especially in terms of connectivity after the completion of Phase II of Delhi Metro and its extensions to the CNCR and construction of expressways have had a profound effect on the nature of economic activities within NCR. Other proposed projects like the DMIC Corridor and Dedicated Freight Corridor are expected to have a further significant impact on the economic activities in NCR.
5.1.1 Gross Domestic Product
During the period 2004-05 to 2009-10, the Gross Domestic Product (GDP) of India increased by 52 percent whereas the GDP of NCR increased by 67 percent Table 5.1.
NCR contributed 7.1 percent to India’s GDP
in 2009-10, whereas its share in the
population was 3.8 percent and its land area
even lesser at 1 percent (Figure 5.1).
5.1.2 Growth Rate of GDP
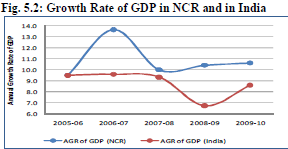
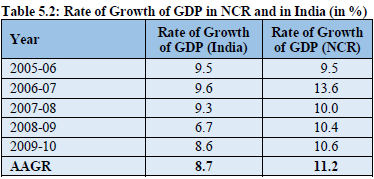
During the period 2004-05 to 2009-10, NCR’s GDP growth rate has consistently been higher than the all India growth rate except for the year 2007-08 when the growth rate of GDP of NCR and India were almost equal (Table 5.2 and Fig. 5.2).
Box 5.1 The contribution of the NCR in India’s GDP is almost twice its share of population.
Source: CSO (National Account Statistics); Economic Survey of Delhi, 2012-13; Department of Economic and Statistical Analysis, Haryana;
Directorate of Economics and Statistics, Rajasthan; updes.up.nic.in Note: Analysis has been done from 2004-05 onwards because data for the previous periods uses a different base price.
5.1.3 Per Capita Income
During the period 2004-05 to 2009-10, the per capita income of NCR went up from Rs. 38,758 to Rs. 59,264 whereas the all India figures for the same period were Rs. 24,143 and Rs. 33,901 respectively (Table 5.3).
Directorate of Economics and Statistics, Rajasthan; updes.up.nic.in
Source: CSO (National Account Statistics); Economic Survey of Delhi. 2012-13; Department of Economic and Statistical Analysis, Haryana; Directorate of Economics and Statistics, Rajasthan; updes.up.nic.in
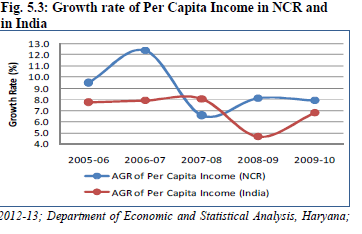
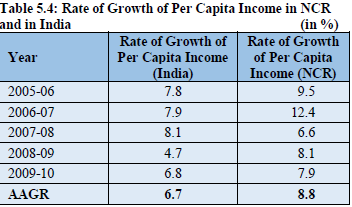
Table 5.4 shows the temporal change in per capita income growth rates during the period of analysis. The rate of growth of per capita income of NCR had been higher than the rate of growth of per capita income of India except in the period 2007-08 when the rate of growth of per capita income of NCR was 6.6 percent and that of India was 8.1 percent.
SUB-REGION WISE ANALYSIS
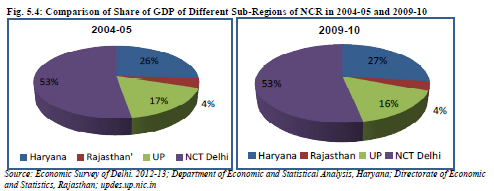
Among the various sub regions of NCR, Delhi had the highest share of GDP in NCR followed by Haryana, Uttar Pradesh and Rajasthan Sub-Regions in 2009-10 (Table 5.5).
Box 5.2 The Per Capita Income of the NCR had consistently been higher than the India’s Per Capita Income during the period 2004-05 to 2009-10.
The share of Delhi and Rajasthan sub regions in the GDP of NCR had remained constant during the
period 2004-05 and 2009-10, whereas there had been slight change in the share of Haryana and Uttar
Pradesh sub regions. While the share of Haryana sub region in NCR’s GDP had gone up by 1 percent, the
share of Uttar Pradesh sub region had gone down by 1 percent over the same period (Fig. 5.4).
During the period 2005-06 to 2009-10, Haryana sub region recorded the highest average annual growth
rate of GDP in the NCR followed by NCT Delhi while Uttar Pradesh sub-region had the lowest annual
average growth rate (Table 5.6 and Fig. 5.5).
During the period 2005-06 to 2009-10, Haryana sub region recorded the highest average annual growth rate of GDP in the NCR followed by NCT Delhi while Uttar Pradesh sub-region had the lowest annual average growth rate (Table 5.7).
NCT Delhi consistently recorded the highest per capita income, whereas Rajasthan sub region reported the lowest per capita income in the NCR (Table 5.8).
During the period 2005-06 to 2009-10, Haryana subregion
had the highest average annual rate of growth of
per capita income followed by NCT Delhi while Uttar
Pradesh sub-region had the lowest average annual growth
rate of per capita income (Fig. 5.6).
5.2.1 NCT Delhi
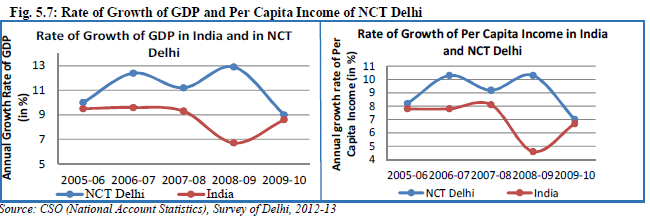
NCT Delhi shows a consistent increase in both GDP and per capita income during the period 2004-05 to 2009-10. But the rate of growth of both these indicators declined in 2009-10 from 12.9 percent to 9.0 percent in case of GDP and from 10.3 percent to 7.0 percent in case of per capita income (Table 5.9 and Fig. 5.7).
Box 5.3 The Average Annual Rate of Growth of GDP in all sub regions had been higher than the Average Annual Rate of Growth of Per Capita Income during 2004-05 to 2009-10.
5.2.2 Haryana Sub-Region
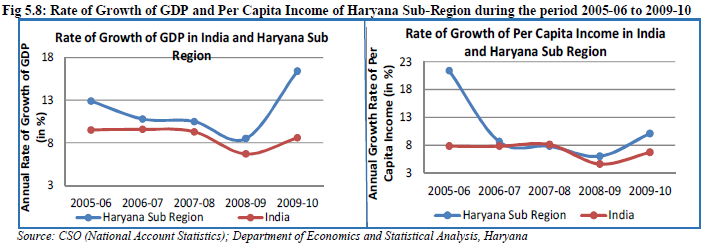
The Haryana sub region had shown a consistent increase in both its GDP and per capita income from 2004-05 to 2009-10. Table 5.10 shows the absolute values of GDP and per capita income over the same time period.
Rate of growth of Gross Sub Region Domestic Product (GSDP) increased from 12.9 percent to 16.4 percent in the period 2004-05 to 2009-10 with a fall in growth rate of GSDP in 2008-09 (Table 5.6). The rate of growth of per capita income was significantly higher in 2005-06 and consequently declined in the following years. It was 21.4 percent in 2005-06 and 10.1 percent in 2009-10 (Table 5.8). This might be due to the huge increase in per capita income of Gurgaon (by 103%) from 2004 to 2005. Fig. 5.8 shows the change in the rate of growth of GDP and per capita income of Haryana Sub-Region.
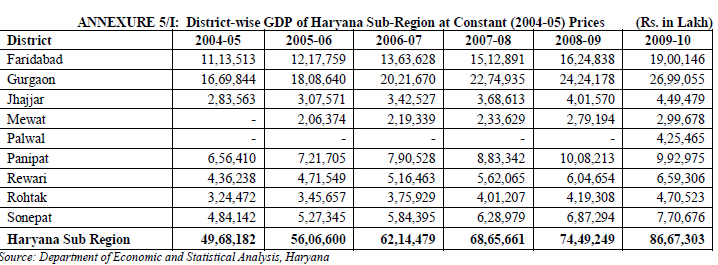
Gurgaon recorded the highest GDP in the year 2009-10
followed by Faridabad district. Mewat had the lowest
GDP (Annexure 5/I).
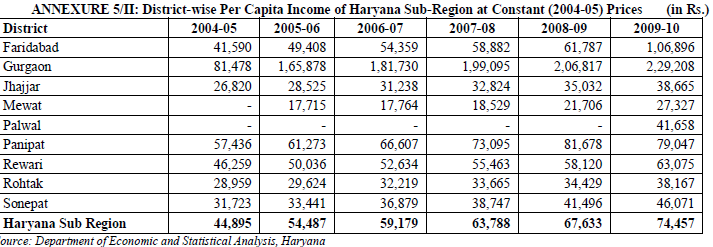
Again Gurgaon district had recorded the highest per capita income which was significantly higher than the per capita income of other districts of Haryana subregion during the period 2004-05 to 2009-10. All other districts except Gurgaon and Faridabad with per capita income of Rs.2,29,208 and Rs.1,06,896 respectively, had per capita income below Rs. 80,000 during 2009-10 (Annexure 5/II). Mewat’s per capita income was even lower than the country’s per capita income.
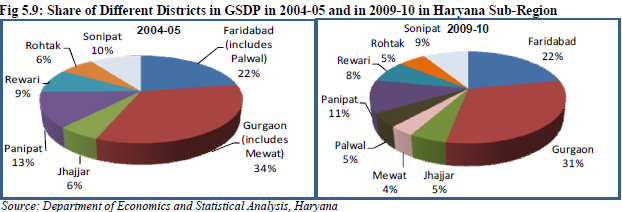
Fig. 5.9 shows the share of GDP of different districts of Haryana sub region in 2004-05 and 2009-10. The
share of GDP of Gurgaon (+Mewat) and Faridabad (+Palwal) districts showed an increase in 2009-10.
While the share of Sonepat, Rohtak, Rewari, Panipat, Jhajjar fell by 1 percent each.
5.2.3 Rajasthan Sub Region
Alwar district showed a consistent increase in GDP and per capita income during 2004-05 to 2009-10 but the rate of growth of GDP and per capita income had been quite irregular. It had recorded per capita income of Rs. 29,300 in the year 2009-10, which was lower than almost all districts of Haryana sub region (except Mewat) but higher than almost all districts of Uttar Pradesh Sub-Region except Gautam Budh Nagar (Fig. 5.10 and Table 5.11).
Since 2004-05, the Per Capita Income of Gurgaon was higher than NCT Delhi and by 2009-10, Faridabad’s per capita income had surpassed Delhi’s per capita income.
5.2.4 Uttar Pradesh Sub-Region
The temporal change in GSDP and the per capita income showed a consistent increase during the period 2004-05 to 2009-10 (Table 5.12).
The rate of growth of GSDP showed a sharp increase from 5.1 percent to 21.4 percent in 2006-07 and then again showed a decline in 2007-08 with marginal increase in the later period. The same trend was seen in the rate of growth of per capita income (from 0.6 percent in 2005-06 to 23.6 percent in 2006-07) and then declined (Fig. 5.11).
The highest GDP in the UP sub region was recorded in Gautam Budh Nagar, which was 3.5 times that of Baghpat in 2009-10. In comparison to other districts, Ghaziabad (+Hapur) had displayed highest GDP till 2006-07, while GDP of Gautam Budh Nagar saw a spurt during the period 2006-07 and thereafter both Gautam Budh Nagar and Ghaziabad showed almost similar growth of GDP till 2008-09. The lowest GDP was that of Baghpat in 2004-05 and its rate of growth was also low (Annexure 5/III).
Fig. 5.12: Share of GDP in 2004-05 and 2009-10 in Uttar Pradesh Sub-Region
Per capita income of Gautam Budh Nagar had been significantly higher than the per capita income of other districts of Uttar Pradesh sub region. In 2009-10, Gautambudh Nagar recorded the highest per capita income, almost double of any other district of the sub region, while Bulandshahar had lowest per capita income during the same period. All other districts except Gautambudh Nagar (with per capita income of Rs.71,960.92) had per capita income below Rs.30,000 (Annexure 5/IV)
Box 5.5 Since 2004-05, there has been a difference between the Per Capita Income of Gautam Budh Nagar and Ghaziabad districts and the gap widened even further from 2006-07 onwards.
WORK FORCE PARTICIPATION RATE (WPR)
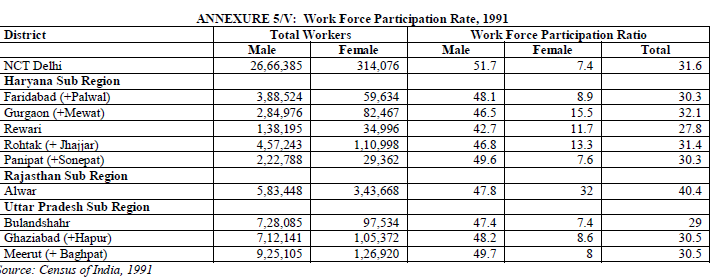
As per 1991 Census, Alwar district of Rajasthan sub-region had the highest WPR of 40.4 in the NCR, followed by Gurgaon district of Haryana sub-region with WPR of 32.1, while Rewari district of Haryana sub region has the lowest WPR of 27.8. On the other hand, the highest male WPR was 51.7 in NCT Delhi followed by Meerut district (includes Baghpat) of Uttar Pradesh sub region and Panipat district (includes Sonepat) of Haryana sub region with 49.7 while Rewari district of Haryana sub-region had the lowest WPR of 42.7 (male). The highest and lowest WPR for female was 32 in Alwar district and 7.4 in NCT Delhi and Bulandshahr respectively (Annexure 5/V).
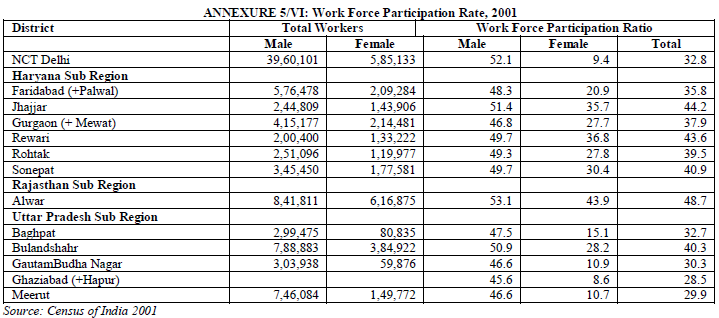
In 2001 Census, Alwar District (Rajasthan) had the highest WPR of 48.7 in the NCR, followed by Rewari district (Haryana) with WPR of 43.6, while the least WPR of 28.5 was observed in Ghaziabad district of Uttar Pradesh. The highest WPR for male was 53.1 in Alwar and the lowest was 45.6 in Ghaziabad, whereas the highest and lowest WPR for female were 43.9 in Alwar and 8.6 in Ghaziabad. Though NCT Delhi had the second highest WPR for male (52.1), it also had the second lowest WPR for female (9.4) (Annexure 5/VI).
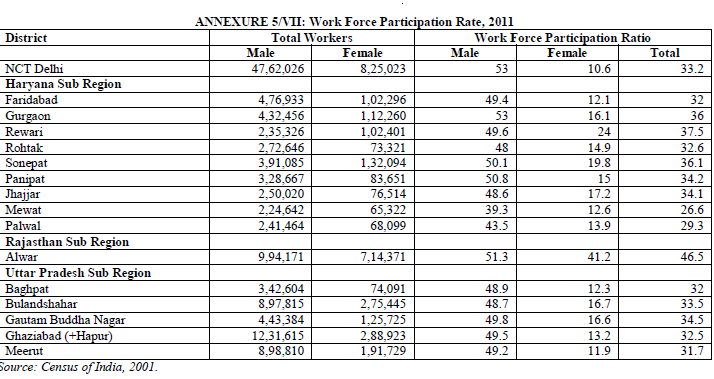
As per 2011 Census, Alwar district of Rajasthan sub region recorded the highest WPR of 46.5 in NCR, followed by Rewari district of Haryana sub region with 37.5 while Mewat district recorded the lowest WPR of 26.6. On the other hand, the highest WPR for male was 53.0 in both NCT Delhi and Gurgaon (district of Haryana sub region) followed by Alwar district with 51.3 while Mewat district of Haryana sub region recorded the lowest WPR for male (39.3). The highest and lowest WPR for female was 41.2 in Alwar and 10.6 in NCT Delhi respectively (Annexure 5/VII).
STRUCTURAL COMPOSITION OF WORK FORCE
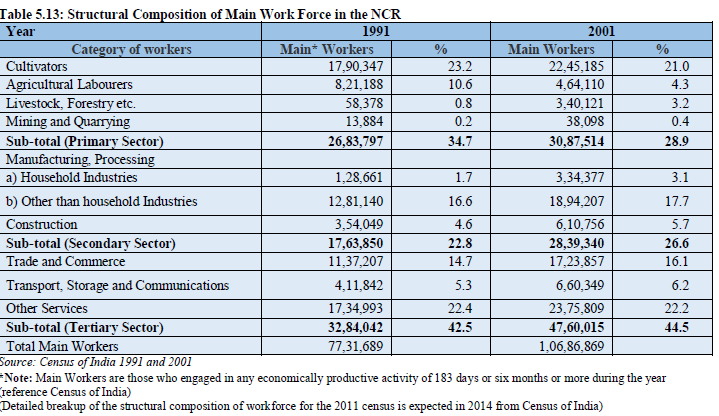
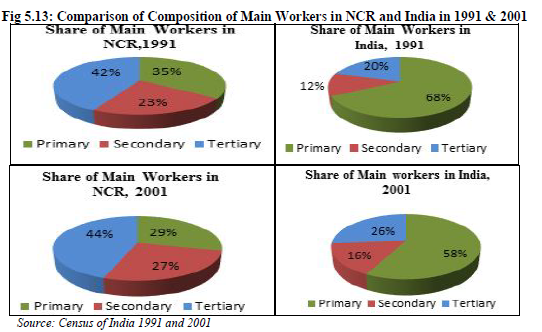
(Detailed breakup of the structural composition of workforce for the 2011 census is expected in 2014 from Census of India) In NCR, the percentage of main workforce engaged in the primary sector showed a decline from 35 percent in 1991 to 29 percent in 2001, while the percentage of main workforce had increased for secondary and tertiary sector. For secondary sector it increased from 23 percent in 1991 to 27 percent in 2001 and for tertiary sector it increased from 42 percent in 1991 to 44 percent in 2001.
Box 5.6 The female WPR of NCT Delhi was the lowest in NCR. The difference between male and female WPR was highest in NCT Delhi over the last 3 decades.
Fig 5.13: Comparison of Composition of Main Workers in NCR and India in 1991 & 2001
In 1991, the primary sector dominated the work force in India, while in the NCR the tertiary sector dominated the work force. This trend continued in 2001 as well. The share of primary sector declined both in India and in NCR but still it dominated the work force of India as a whole (Fig 5.13).
5.4.1 Sub Region-Wise Structural Composition of Work Force
NCT Delhi had the highest number of work force employed in the NCR while the lowest numbers of
workers were employed in Rajasthan sub region both during 1991 and 2001 (Table 5.14 and Fig 5.14).
NCT Delhi had the maximum share of workers employed in the NCR. The share of workers employed in NCT Delhi went up from 38 percent to 41 percent and that of Rajasthan sub region had gone up from 5percent to 9 percent. The share of Haryana sub region and Uttar Pradesh sub region had gone down from 25 percent to 23 percent and 32 percent to 23 percent respectively.
A. NCT Delhi
According to Census data 1991 and 2001, the number of workers employed in all three sectors of NCT Delhi had gone up, but the share of workers employed in primary sector had gone down. The share of
workers employed in tertiary sector had remained constant while that employed in secondary sector had increased by 1 percent (Fig 5.15).
B. Haryana Sub-Region
According to the Census data 1991 and 2001, although the number of workers employed in all three sectors of Haryana sub region had gone up, but the share of work force employed in primary sector had decreased and the share of work force employed in secondary and tertiary sector had increased (Fig. 5.16).
C. Rajasthan Sub-Region
Majority of the population in this sub region was employed in primary sector which was more than five
times than that of workers employed in secondary sector. The number of workers employed in all three
sectors had gone up, but the share of workers employed in tertiary sector had gone down from 23 percent
in 1991 to 18 percent in 2001 (Fig. 5.17).
D. Uttar Pradesh Sub-Region
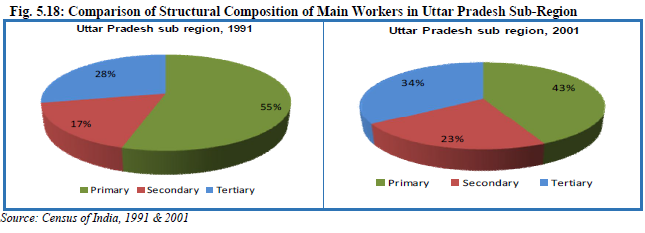
In the Uttar Pradesh sub region, the share of workers employed in primary sector decreased from 55 percent in 1991
to 43 percent in 2001. The number of workers employed in the secondary and tertiary sector increased. The share of
secondary sector workers increased from 17 percent in 1991 to 23 percent in 2001 and that of tertiary
sector workers increased from 28 percent in 1991 to 34 percent in 2001 (Fig. 5.18).
FINANCIAL INCLUSION
The objective of financial inclusion is to extend financial services to the unserved population which is an important tool to unlock a region’s growth potential. According to 2011 Census of India, 71.5 percent of households avail banking services in NCR, while the all India figure is 58.7 percent (Table 5.15).
Among the NCR sub region, NCT Delhi had the highest percentage of households availing banking facilities, followed by Haryana, while the least was shown by Rajasthan Sub-Region.
5.5.1 Sub Region-Wise Analysis
A. NCT Delhi
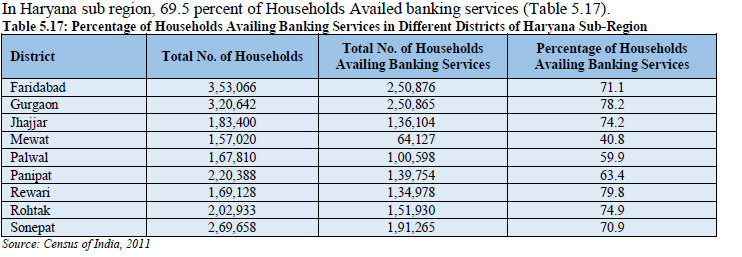
In NCT Delhi, 77.7 percent of households availed banking services. B. Haryana Sub-Region In Haryana sub region, 69.5 percent of Households Availed banking services (Table 5.17).
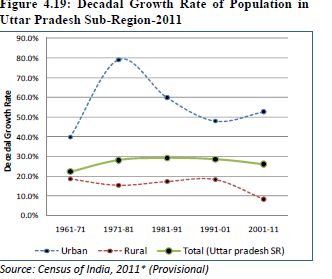
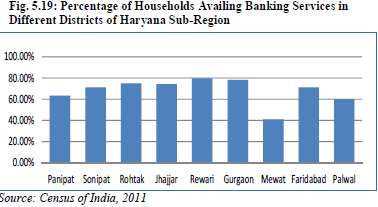
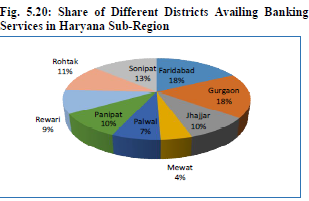
The percentage of households availing banking services in Rewari district was almost twice in comparison to Mewat district. The highest percentage of households availing banking services in Haryana sub region was in Rewari district followed by Gurgaon district (Fig. 5.19 and Fig. 5.20).
The maximum number of households availing banking services was in Faridabad district which was 3.9 times more than that in Mewat district. The maximum percentage of households availing banking services was in Rewari. C. Rajasthan Sub-Region In Rajasthan Sub-Region, 59.5 percent households availed the banking services. B. Uttar Pradesh Sub-Region
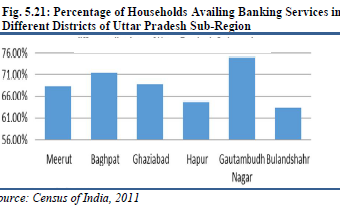
In the Uttar Pradesh Sub-Region, Gautam Budh Nagar district showed the highest percent (74.9%) of households availing banking facilities. On the other hand, Bulandshahr district showed the lowest percentage of households availing banking facilities (Table 5.18 and Fig. 5.21).
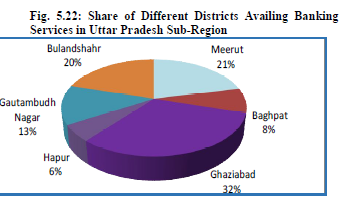
Figure 5.22 shows the share of households availing banking service in different districts of Uttar Pradesh
sub region. Ghaziabad had the highest share of 32 percent, while Hapur showed the least share at 6
percent.
FOREIGN DIRECT INVESTMENT
According to RBI data, the RBI Office in Delhi which collates information pertaining to FDI has reported that Delhi (which includes New Delhi and part of Haryana and Uttar Pradesh) had been the second highest recipient of FDI inflows (21.9 percent) after Maharashtra (26.2 percent) in 2011-12. Since district wise data for FDI was not available, district-wise analysis could not be undertaken.
POLICY AND PROPOSALS
The key rationale behind the formation of NCR was to promote balanced growth and harmonized development of the region and focus should be on making the metros and regional centres have their own influence region.
i) Comparison of per capita income of different districts of NCR excluding Delhi reveals that Bulandshahr, Meerut and Ghaziabad in Uttar Pradesh sub region, followed by Mewat in Haryana sub region are among the districts having lower per capita income, while Gurgaon and Faridabad’s per capita income is higher than Delhi. NCR Planning Board has been lending on an average of Rs 240 crore per year to participating states for physical infrastructure development. As analysed in chapter 19, funding has been largely in favour of Haryana sub region. In view of lower per capita income and low levels of work force in secondary sector, there is a case for increased funding in Bulandshahr and Mewat. Baghpat’s contribution to NCR’s GDP is the lowest and hence physical and social infrastructure needs a boost in this district. Baghpat has remained the only district in the NCR which has not received NCRPB’s funding.
ii) Employment in the secondary and tertiary sectors in NCR is constrained by the issues of skill development of the work force. Therefore, there is a need for new projects with focus on skill development and vocational training.
iii) Connectivity within NCR has been the driving force for the change in both the size and nature of economic activities in NCR. RRTS project has the potential to improve the growth prospects and income in the entire region especially of the towns not part of CNCR. iv) The analysis of banking facilities in NCR clearly brings out that districts with low per capita income are also the districts where the banking facilities are either not available or not availed of. Provision of banking services such as soft loans and micro financing can help in improving the economic base of an area provided the potential beneficiaries are aware of these services. The banking sector therefore, should not only focus on expanding its network but also emphasise on creating awareness, regarding the spectrum of services available. Mewat in Haryana sub region and Bulandshahr in Uttar Pradesh sub region are two districts as a case in point where greater financial inclusion can bring out huge difference. It is pertinent to correlate that as per 2001 Census Bulandshahr district of Uttar Pradesh sub region had contributed the maximum in-migration to Delhi during the decade of 1991 to 2001.
v) The three investment regions under the proposed DMIC project namely Manesar-Bawal Investment Region (MBIR), Khushkhera-Bhiwadi-Neemrana Investment Region (KBNIR) and Dadri-Noida- Ghaziabad Investment Region (DNGIR) and the DFC project have the potential to boost the manufacturing sector both in terms of output and employment. These projects emphasise on expanding the manufacturing and services base and develop the corridor stretches as “Global Manufacturing and Trading Hubs”.
Box 5.7
It is interesting to note that districts having low per capita income also have a lower percentage of households availing banking services. In Haryana sub region, Mewat district had the lowest per capita income and the least percentage of households availing banking services. In Uttar Pradesh sub region, Bulandshahr district had the lowest per capita income and also the lowest percentage of households availing banking services.


