Rainfall: India
(→2015: 302 of 614 districts drought affected, highest since 2009) |
(→1910-2022: the wettest Octobers) |
||
| (81 intermediate revisions by 3 users not shown) | |||
| Line 6: | Line 6: | ||
|} | |} | ||
| − | |||
| − | |||
| − | |||
| − | |||
| − | |||
| − | |||
| − | == | + | =Definitions = |
| + | |||
| + | Rainfall is classified as | ||
| − | + | Very light rain: Rainfall up to 2.4mm | |
| − | + | ‘light’ when it is between 2.5 and 15.5mm, | |
| − | + | ‘moderate’ when it is between 15.6 and 64.4mm, and | |
| − | + | ‘heavy’ when it is above 64.5mm | |
| − | + | ''' in a single day. ''' | |
| − | + | [[Category:Climate/Meteorology|R RAINFALL: INDIARAINFALL: INDIARAINFALL: INDIA | |
| + | RAINFALL: INDIA]] | ||
| + | [[Category:India|R RAINFALL: INDIARAINFALL: INDIARAINFALL: INDIA | ||
| + | RAINFALL: INDIA]] | ||
| + | [[Category:Pages with broken file links|RAINFALL: INDIA | ||
| + | RAINFALL: INDIA]] | ||
| − | While the rain | + | =Rainfall over the years= |
| + | [[File: Decadal means of all-India southwest monsoon rainfall, 1901- 2020.jpg|Decadal means of all-India southwest monsoon rainfall, 1901- 2020 <br/> From: [https://timesofindia.indiatimes.com/india/why-a-drier-monsoon-will-be-a-normal-monsoon/articleshow/90874445.cms April 17, 2022: ''The Times of India'']|frame|500px]] | ||
| + | |||
| + | ==Annual mean rainfall in India== | ||
| + | ===1961-2020=== | ||
| + | [[File: Annual mean rainfall in India, 1961-2020; Monsoon period Mean rainfall, 1961- 2020.jpg|Annual mean rainfall in India, 1961-2020 <br/> Monsoon period Mean rainfall, 1961- 2020 <br/> From: [https://epaper.timesgroup.com/article-share?article=15_04_2022_012_019_cap_TOI Vishwa Mohan, April 15, 2022: ''The Times of India'']|frame|500px]] | ||
| + | |||
| + | |||
| + | '''See graphic''': | ||
| + | |||
| + | '' Annual mean rainfall in India, 1961-2020 <br/> Monsoon period Mean rainfall, 1961- 2020 '' | ||
| + | |||
| + | |||
| + | ===1971-2022=== | ||
| + | [https://epaper.timesgroup.com/article-share?article=06_09_2022_011_009_cap_TOI Priyangi Agarwal, September 7, 2022: ''The Times of India''] | ||
| + | |||
| + | [[File: The Normal range for rainfall in India, January to December, being the long period average from 1971 to 2022.jpg| The Normal range for rainfall in India, January to December, being the long period average from 1971 to 2022 <br/> From: [https://epaper.timesgroup.com/article-share?article=06_09_2022_011_009_cap_TOI Priyangi Agarwal, September 7, 2022: ''The Times of India'']|frame|500px]] | ||
| + | |||
| + | New Delhi : The India Meteorological Department (IMD) has revised its ‘normal’ rainfall mark this year, which will be based on the long-period average of the past 50 years (1971-2020). The previous normal was based on the long-period average of 1961-2010. | ||
| + | |||
| + |
While the period between July and January saw a decrease in the normal mark for rainfall, the period between February and June witnessed a slight rise. The major difference in normal rainfall was of nearly 15mm in August. | ||
| + | |||
| + |
IMD calculates ‘excess’ or ‘deficit’ rainfall on the basis of ‘normal’. For instance, Safdarjung, the city’s base station, logged 286. 3mm rainfall in July this year as against the revised normal of 209. 7mm and hence, the month ended with an excess of 67%. The previous normal for July was 210. 6mm. | ||
| + | |||
| + |
“Long-period average is revised once in a decade. The revised normal came into force at Safdarjung this June and it will continue for this decade,” said a Met official said. | ||
| + | |||
| + |
The official added, “The months which received more rainfall in 2011-2020 saw an increase in normal range. However, months which recorded less rainfall during the same period witnessed a drop in the normal mark. ” | ||
| + | |||
| + |
According to IMD, August saw the highest difference in the previous and current normal benchmark. As the normal onset of monsoon date is June 27 and the monsoon usually arrives in the capital in July and withdraws in September, August, on an average, reports the highest number of rainy days. Safdarjung was able to surpass the average mark only twice in the past 10 years. It recorded excess rainfall of 321. 4 and 378. 8mm rainfall in 2013 and 2012, respectively. The city has been recording a rain deficit in August since 2014. | ||
| + | |||
| + |
However, as the month failed to meet its normal rangeeight times between 2011 and 2020, the normal in August decreased from 247. 7mm to 233. 2mm. “Earlier, August used to witness rainy day after every second day,” said a Met official. | ||
| + |
In contrast, May saw a rise in normal range of 11mm. While the previous normal was 19. 7mm, the current normal is 30. 7mm. IMD data shows that May has been mostly recording excess rainfall. The city saw excess rainfall of 142% and 636% in May in 2022 and 2021, respectively.
October’s normal range has a difference of 12. 9mm while July witnessed little change in the normal mark of about 1mm. | ||
| + | |||
| + | [[Category:Climate/Meteorology|R RAINFALL: INDIARAINFALL: INDIARAINFALL: INDIARAINFALL: INDIA | ||
| + | RAINFALL: INDIA]] | ||
| + | [[Category:India|R RAINFALL: INDIARAINFALL: INDIARAINFALL: INDIARAINFALL: INDIA | ||
| + | RAINFALL: INDIA]] | ||
| + | [[Category:Pages with broken file links|RAINFALL: INDIARAINFALL: INDIARAINFALL: INDIARAINFALL: INDIARAINFALL: INDIA | ||
| + | RAINFALL: INDIA]] | ||
| + | |||
| + | ==Records== | ||
| + | ===24 hour rainfall, 1876-2005=== | ||
| + | [[File: All-time records of the highest 24 hour rainfall in India and the world, till 2005.png| All-time records of the highest 24 hour rainfall in India and the world, till 2005. Courtesy: [https://www.researchgate.net/publication/257343190_Observational_forecasting_aspects_of_the_meteorological_event_that_caused_a_record_highest_rainfall_in_Mumbai/figures?lo=1 SC Bhan, Observational/ forecasting aspects of the meteorological event that caused a record highest rainfall in Mumbai] |frame|500px]] | ||
| + | See graphic, All-time records of the highest 24 hour rainfall in India and the world, till 2005 | ||
| + | ====Updated to 2022==== | ||
| + | ''' Single day ''' | ||
| + | |||
| + | 1563.3mm of rainfall Cherrapunjee’s wettest day June 16, 1995 ([https://epaper.timesgroup.com/article-share?article=18_06_2022_009_010_cap_TOI ''The Times of India'' ]) | ||
| + | |||
| + | 1003.6mm of rain in 24 hours: Mawsynram/ 2022, 16-17 June (from 8. 30am on 16th to 8. 30am 17th) ([https://epaper.timesgroup.com/article-share?article=18_06_2022_009_010_cap_TOI ''The Times of India'' ]) | ||
| + | |||
| + | 945.4mm Mawsynram’s previous highest 24-hour rainfall on June 7, 1966 ([https://epaper.timesgroup.com/article-share?article=18_06_2022_009_010_cap_TOI ''The Times of India'' ]) | ||
| + | |||
| + | 972mm Cherrapunjee, its third highest single-day rainfall / 2022, 16-17 June (from 8. 30am on 16th to 8. 30am 17th) ([https://epaper.timesgroup.com/article-share?article=18_06_2022_009_010_cap_TOI ''The Times of India'' ]) | ||
| + | |||
| + | ''' Two-day (48-hour) rainfall ''' | ||
| + | |||
| + | 2,493mm at Cherrapunjee recorded on June 15-16m, 1995 ([https://epaper.timesgroup.com/article-share?article=18_06_2022_009_010_cap_TOI ''The Times of India'' ]) | ||
| + | |||
| + | [[Category:Climate/Meteorology|R RAINFALL: INDIARAINFALL: INDIARAINFALL: INDIARAINFALL: INDIA | ||
| + | RAINFALL: INDIA]] | ||
| + | [[Category:India|R RAINFALL: INDIARAINFALL: INDIARAINFALL: INDIARAINFALL: INDIA | ||
| + | RAINFALL: INDIA]] | ||
| + | [[Category:Pages with broken file links|RAINFALL: INDIARAINFALL: INDIARAINFALL: INDIARAINFALL: INDIARAINFALL: INDIA | ||
| + | RAINFALL: INDIA]] | ||
| + | |||
| + | ===Highest annual rainfall === | ||
| + | [[File: Highest annual rainfall.png| Highest annual rainfall <br/> The period for which this data holds good has not been mentioned . Therefore, we assume that it pertains to the years 1875 1982 <br/> From: Rakhecha, PR, and Pisharoty, PR, Heavy rainfall during monsoon season: Point and spatial distribution, Current Science, Volume 71, No. 3, 10 August 1996 |frame|500px]] | ||
| + | See graphic, Highest annual rainfall | ||
| + | |||
| + | ===Highest amount of rainfall in one hour=== | ||
| + | [[File: Highest amount of rainfall in one hour.png| Highest amount of rainfall in one hour <br/> The period for which this data holds good has not been mentioned . Therefore, we assume that it pertains to the years 1875 1982 <br/> From: Rakhecha, PR, and Pisharoty, PR, Heavy rainfall during monsoon season: Point and spatial distribution, Current Science, Volume 71, No. 3, 10 August 1996 |frame|500px]] | ||
| + | See graphic, Highest amount of rainfall in one hour | ||
| + | ===Highest rainfall in 1 day, 2 days, 3 days=== | ||
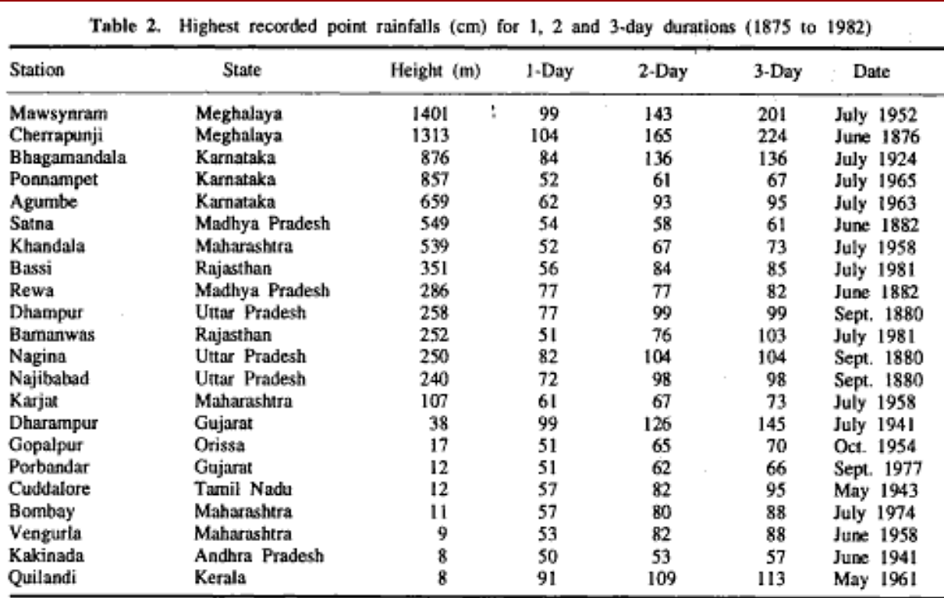
| + | [[File: Highest recorded rainfall in a single day, over two days and over three days, 1875 -1982.png| Highest recorded rainfall in a single day, over two days and over three days, 1875 -1982 <br/> From: Rakhecha, PR, and Pisharoty, PR, Heavy rainfall during monsoon season: Point and spatial distribution, Current Science, Volume 71, No. 3, 10 August 1996 |frame|500px]] | ||
| + | See graphic, Highest recorded rainfall in a single day, over two days and over three days, 1875 -1982. | ||
| + | |||
| + | ===2019: Mahabaleshwar tops=== | ||
| + | In individual years different places sometimes hold the all-India and world records. | ||
| + | |||
| + | From [https://timesofindia.indiatimes.com/toireporter/author-Neha-Madaan-479214644.cms) TNN/ Neha Madaan, Mahabaleshwar gets 7,000mm rain, is wettest spot on earth/ Sep 6, 2019] | ||
| + | |||
| + | |||
| + | ''' June 1 to September 4 ''' 2019: | ||
| + | |||
| + | Mahabaleshwar received 7,175.4mm rain | ||
| + | |||
| + | Patharpunj in Patan taluka in Satara also recorded 7,000mm rainfall during the 2019 monsoon | ||
| + | |||
| + | Mawsynram 6,218.4mm [Its normal June-August rainfall is over 8,233.5mm] | ||
| + | |||
| + | Cherrapunji 6,082.7mm | ||
| + | |||
| + | |||
| + | June 1 to September 5, 2019: Mahabaleshwar received 7,369.4mm. | ||
| + | |||
| + | [[File: Mawsynram and Cherrapunji vis-à-vis Mahabaleshwar.png| Mawsynram and Cherrapunji vis-à-vis Mahabaleshwar <br/> From [https://timesofindia.indiatimes.com/toireporter/author-Neha-Madaan-479214644.cms) / TNN/ Neha Madaan, Mahabaleshwar gets 7,000mm rain, is wettest spot on earth/ Sep 6, 2019]|frame|500px]] | ||
| + | |||
| + | Pulak Guhathakurta, head of the climate application and user interface, Climate Research and Services, IMD Pune, said, “Mahabaleshwar is the only station in Madhya Maharashtra that normally receives very high rain during the monsoon because of its orography. It has a unique geographical location in the rain-battered region of the Western Ghats.” | ||
| + | |||
| + | Torrential rains in Mawsynram and Cherrapunji are common. Both are located in a funnelshaped region formed by the Khasi, Garo and Jaintia hills. | ||
| + | |||
| + | The two locations, 81km apart, receive rain from the Bay of Bengal branch. The clouds travel over the plains of Bangladesh for hundreds of kilometres and collide with the Khasi hills. | ||
| + | |||
| + | “The hills have numerous deep valleys and channels. Strong winds push these clouds through the deep valleys and lift them up. The upward motion helps water vapour condense, increasing the moisture content in the winds. When these winds saturated with moisture collide with the Khasi hills, extremely heavy rain occurs over the windward side, where Mawsynram and Cherrapunji are located,” Guhathakurta said. | ||
| + | |||
| + | [[Category:Climate/Meteorology|R RAINFALL: INDIARAINFALL: INDIARAINFALL: INDIARAINFALL: INDIA | ||
| + | RAINFALL: INDIA]] | ||
| + | [[Category:India|R RAINFALL: INDIARAINFALL: INDIARAINFALL: INDIARAINFALL: INDIA | ||
| + | RAINFALL: INDIA]] | ||
| + | [[Category:Pages with broken file links|RAINFALL: INDIARAINFALL: INDIARAINFALL: INDIARAINFALL: INDIARAINFALL: INDIA | ||
| + | RAINFALL: INDIA]] | ||
| + | |||
| + | == State-wise, season-wise== | ||
| + | === 1951-2000=== | ||
| + | [[File: The normal rainfall in the states, 1951-2000 - winter.jpg|The normal rainfall in the states, 1951-2000 : winter <br/> From: [https://timesofindia.indiatimes.com/india/how-kerala-keeps-its-date-with-the-monsoon/articleshow/82699010.cms Sudha Nambudiri, May 18, 2021: ''The Times of India'']|frame|500px]] | ||
| + | |||
| + | [[File: The normal rainfall in the states, 1951-2000 - pre-monsoon.jpg|The normal rainfall in the states, 1951-2000 : pre-monsoon <br/> From: [https://timesofindia.indiatimes.com/india/how-kerala-keeps-its-date-with-the-monsoon/articleshow/82699010.cms Sudha Nambudiri, May 18, 2021: ''The Times of India'']|frame|500px]] | ||
| + | |||
| + | [[File: The normal rainfall in the states, 1951-2000 - monsoon.jpg|The normal rainfall in the states, 1951-2000 : monsoon <br/> From: [https://timesofindia.indiatimes.com/india/how-kerala-keeps-its-date-with-the-monsoon/articleshow/82699010.cms Sudha Nambudiri, May 18, 2021: ''The Times of India'']|frame|500px]] | ||
| + | |||
| + | [[File: The normal rainfall in the states, 1951-2000 - post- monsoon.jpg|The normal rainfall in the states, 1951-2000 : post- monsoon <br/> From: [https://timesofindia.indiatimes.com/india/how-kerala-keeps-its-date-with-the-monsoon/articleshow/82699010.cms Sudha Nambudiri, May 18, 2021: ''The Times of India'']|frame|500px]] | ||
| + | |||
| + | '''See graphics''': | ||
| + | |||
| + | '' The normal rainfall in the states, 1951-2000 : winter '' | ||
| + | |||
| + | '' The normal rainfall in the states, 1951-2000 : pre-monsoon '' | ||
| + | |||
| + | '' The normal rainfall in the states, 1951-2000 : monsoon '' | ||
| + | |||
| + | '' The normal rainfall in the states, 1951-2000 : post- monsoon '' | ||
| + | |||
| + | |||
| + | |||
| + | |||
| + | |||
| + | [[Category:Climate/Meteorology|R RAINFALL: INDIARAINFALL: INDIARAINFALL: INDIA | ||
| + | RAINFALL: INDIA]] | ||
| + | [[Category:India|R RAINFALL: INDIARAINFALL: INDIARAINFALL: INDIA | ||
| + | RAINFALL: INDIA]] | ||
| + | [[Category:Pages with broken file links|RAINFALL: INDIARAINFALL: INDIA | ||
| + | RAINFALL: INDIA]] | ||
| + | |||
| + | [[Category:Climate/Meteorology|R RAINFALL: INDIARAINFALL: INDIARAINFALL: INDIARAINFALL: INDIA | ||
| + | RAINFALL: INDIA]] | ||
| + | [[Category:India|R RAINFALL: INDIARAINFALL: INDIARAINFALL: INDIARAINFALL: INDIA | ||
| + | RAINFALL: INDIA]] | ||
| + | [[Category:Pages with broken file links|RAINFALL: INDIARAINFALL: INDIARAINFALL: INDIARAINFALL: INDIARAINFALL: INDIA | ||
| + | RAINFALL: INDIA]] | ||
| + | |||
| + | == La Nina years== | ||
| + | |||
| + | [[Category:Climate/Meteorology|R RAINFALL: INDIARAINFALL: INDIARAINFALL: INDIA | ||
| + | RAINFALL: INDIA]] | ||
| + | [[Category:India|R RAINFALL: INDIARAINFALL: INDIARAINFALL: INDIA | ||
| + | RAINFALL: INDIA]] | ||
| + | [[Category:Pages with broken file links|RAINFALL: INDIARAINFALL: INDIA | ||
| + | RAINFALL: INDIA]] | ||
| + | |||
| + | === 1971-2010=== | ||
| + | See graphic, ' Rainfall % of average, September and June July during La Nina years: 1971-2010 ' | ||
| + | [[File: Rainfall % of average, September and June July, 1971-2010.jpg|Rainfall % of average, September and June July during La Nina years: 1971-2010; Graphic courtesy: [http://epaperbeta.timesofindia.com/Gallery.aspx?id=03_06_2016_018_033_012&type=P&artUrl=Zero-chance-of-deficient-rains-IMD-03062016018033&eid=31808 ''The Times of India''], June 3, 2016|frame|500px]] | ||
| + | |||
| + | [[Category:Climate/Meteorology|R RAINFALL: INDIARAINFALL: INDIARAINFALL: INDIA | ||
| + | RAINFALL: INDIA]] | ||
| + | [[Category:India|R RAINFALL: INDIARAINFALL: INDIARAINFALL: INDIA | ||
| + | RAINFALL: INDIA]] | ||
| + | [[Category:Pages with broken file links|RAINFALL: INDIARAINFALL: INDIA | ||
| + | RAINFALL: INDIA]] | ||
| + | |||
| + | == Drop in rainfall == | ||
| + | ===1989-2019: 7 states saw a drop=== | ||
| + | [https://epaper.timesgroup.com/Olive/ODN/TimesOfIndia/shared/ShowArticle.aspx?doc=TOIDEL%2F2020%2F03%2F09&entity=Ar01112&sk=C00C6731&mode=text 7 states saw drop in rainfall in last 30 yrs, March 9, 2020: ''The Times of India''] | ||
| + | |||
| + | '' India Also Saw More ‘Dry Days’: Govt Report '' | ||
| + | |||
| + | |||
| + | Seven states — Uttar Pradesh, Bihar, West Bengal, Himachal Pradesh, Arunachal Pradesh, Meghalaya and Nagaland — have shown “significant decreasing trends” in annual rainfall in the last 30 years and many parts of the country witnessed increase in number of “dry days” during the monsoon season which adversely affected groundwater recharges in these regions. | ||
| + | |||
| + | These are some of the key findings of a report, ‘Observed Rainfall Variability and Changes’, which was shared by the ministry of earth sciences (MoES) with a parliamentary panel in response to the latter’s queries on changing rainfall patterns in the context of its impact on agriculture. The ministry analysed rainfall pattern over 28 states and the Union Territory of J&K based on data of the last 30 years. | ||
| + | |||
| + | The report said the situation for agriculture or water recharge in certain states in the Ganga river basin (UP, Bihar and West Bengal), Delhi and some southern states was “alarming”, as the number of dry days (daily rainfall of 2.5 mm or less) during the south-west monsoon was “significantly increasing”. | ||
| + | |||
| + | MoES secretary Madhavan Rajeevan said, “It could be attributed to climate change. Global warming is happening and it has impacted the climate in India as well. As a result, many parts of the country have seen decreasing trends while others witnessed increasing trends.” | ||
| + | |||
| + | “Such a study may help farmers plan their agricultural activities and conserve/utilise available water resources,” Rajeevan said. The parliamentary standing committee on science & technology and environment, headed by Congress’s Jairam Ramesh, submitted its report to Parliament. | ||
| − | + | “Five states, viz Bihar, Meghalaya, Nagaland, West Bengal and Uttar Pradesh, have shown statistically significant decreasing trends in south-west monsoon rainfall. These five states, along with two more states — Arunachal Pradesh and Himachal Pradesh — have also shown statistically significant decreasing trends in annual rainfall,” the report said. The report said the frequency of rainfall of lower intensity, favourable for soil and ground water recharge, was decreasing in these regions. Overall, there was significant changes in the frequency of dry days, rainy days and heavy rainfall events in different parts of the country. | |
| − | + | ||
| − | + | ||
| − | + | ||
| − | == | + | == Low rainfall years== |
| + | ===2015, 2009=== | ||
[http://epaperbeta.timesofindia.com/Article.aspx?eid=31808&articlexml=Monsoon-ends-with-lowest-rainfall-in-6-yrs-01102015010046 ''The Times of India''], Oct 01 2015 | [http://epaperbeta.timesofindia.com/Article.aspx?eid=31808&articlexml=Monsoon-ends-with-lowest-rainfall-in-6-yrs-01102015010046 ''The Times of India''], Oct 01 2015 | ||
| Line 48: | Line 268: | ||
In September, despite a few late spells of rain in several parts of the country including deficit regions such as central Maharashtra, Marathwada, south peninsula and northwest India, the total rainfall was the lowest since 2005. The country received 131.4mm rainfall in September this year, 24% less than the normal and the lowest in the past 11 September months. In 2002 and 2009, the two worst drought years the country experienced in recent decades, the rainfall deficiency stood at 19.2% and 21.8%, respectively . The India Meteorological Department has, however, discontinued using the term “drought“ because it believes an entire country never faces a drought. | In September, despite a few late spells of rain in several parts of the country including deficit regions such as central Maharashtra, Marathwada, south peninsula and northwest India, the total rainfall was the lowest since 2005. The country received 131.4mm rainfall in September this year, 24% less than the normal and the lowest in the past 11 September months. In 2002 and 2009, the two worst drought years the country experienced in recent decades, the rainfall deficiency stood at 19.2% and 21.8%, respectively . The India Meteorological Department has, however, discontinued using the term “drought“ because it believes an entire country never faces a drought. | ||
| − | == | + | |
| − | + | == Drought years == | |
| + | ===2002-15=== | ||
| + | See graphic, '2002-15: years when India was affected by drought ' | ||
[[File: 2002-15, years when India was affected by drought.jpg|2002-15: years when India was affected by drought; Graphic courtesy: [http://epaperbeta.timesofindia.com/Article.aspx?eid=31808&articlexml=302-of-614-districts-reeling-under-drought-highest-03102015017048 ''The Times of India''], Oct 03 2015|frame|500px]] | [[File: 2002-15, years when India was affected by drought.jpg|2002-15: years when India was affected by drought; Graphic courtesy: [http://epaperbeta.timesofindia.com/Article.aspx?eid=31808&articlexml=302-of-614-districts-reeling-under-drought-highest-03102015017048 ''The Times of India''], Oct 03 2015|frame|500px]] | ||
| + | ===2015: 302 of 614 districts drought affected, highest since 2009=== | ||
| + | [http://epaperbeta.timesofindia.com/Article.aspx?eid=31808&articlexml=302-of-614-districts-reeling-under-drought-highest-03102015017048 ''The Times of India''], Oct 03 2015 | ||
Subodh Varma | Subodh Varma | ||
| − | + | ||
'''302 of 614 districts reeling under drought, highest since 2009''' | '''302 of 614 districts reeling under drought, highest since 2009''' | ||
| Line 71: | Line 295: | ||
In June this year, rainfall was 16% higher than the long period average. This led to hopes of a good monsoon.So, sowing was done vigorously.But then the rainfall plummeted. | In June this year, rainfall was 16% higher than the long period average. This led to hopes of a good monsoon.So, sowing was done vigorously.But then the rainfall plummeted. | ||
| + | |||
| + | [[Category:Climate/Meteorology|R RAINFALL: INDIARAINFALL: INDIARAINFALL: INDIARAINFALL: INDIA | ||
| + | RAINFALL: INDIA]] | ||
| + | [[Category:India|R RAINFALL: INDIARAINFALL: INDIARAINFALL: INDIARAINFALL: INDIA | ||
| + | RAINFALL: INDIA]] | ||
| + | [[Category:Pages with broken file links|RAINFALL: INDIARAINFALL: INDIARAINFALL: INDIARAINFALL: INDIARAINFALL: INDIA | ||
| + | RAINFALL: INDIA]] | ||
| + | |||
| + | =MONTH-WISE= | ||
| + | |||
| + | [[Category:Climate/Meteorology|R RAINFALL: INDIARAINFALL: INDIARAINFALL: INDIARAINFALL: INDIA | ||
| + | RAINFALL: INDIA]] | ||
| + | [[Category:India|R RAINFALL: INDIARAINFALL: INDIARAINFALL: INDIARAINFALL: INDIA | ||
| + | RAINFALL: INDIA]] | ||
| + | [[Category:Pages with broken file links|RAINFALL: INDIARAINFALL: INDIARAINFALL: INDIARAINFALL: INDIARAINFALL: INDIA | ||
| + | RAINFALL: INDIA]] | ||
| + | |||
| + | ==March to mid- May== | ||
| + | ===Delhi=== | ||
| + | ====2011-22==== | ||
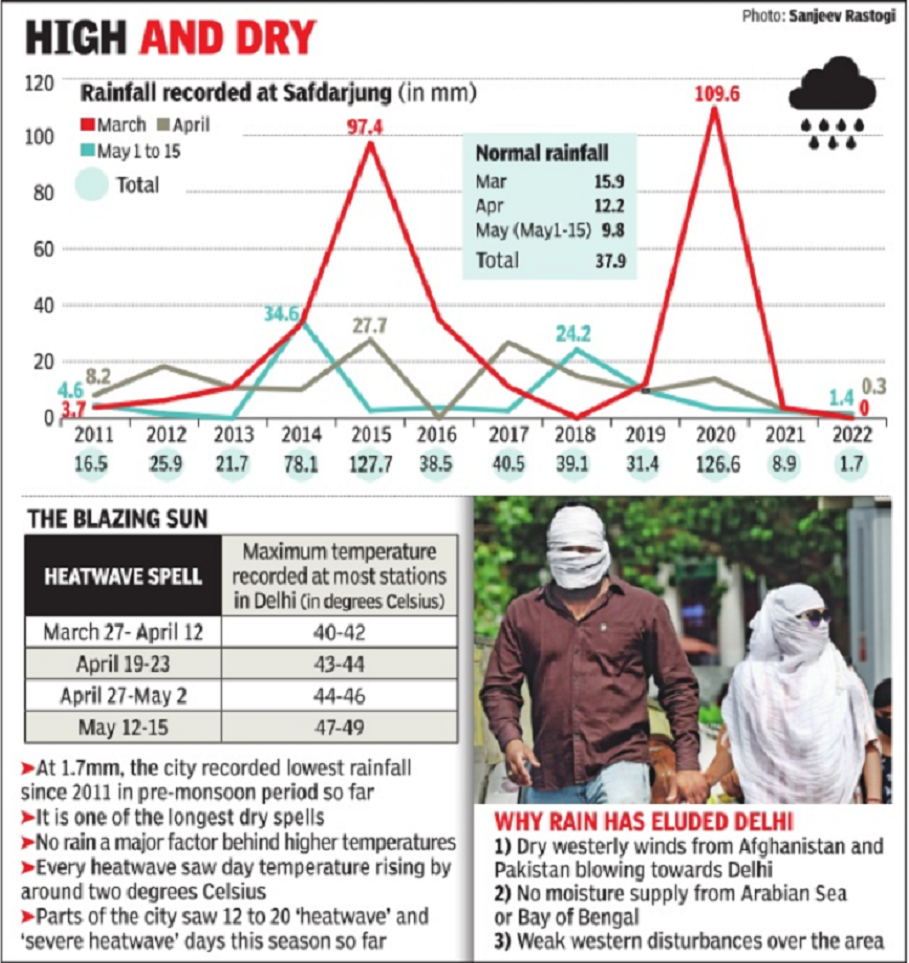
| + | [[File: Rainfall in Delhi, March to mid- May, 2011-22.png| Rainfall in Delhi, March to mid- May, 2011-22 <br/> Graphic courtesy: [ ''The Times of India'']|frame|500px]] | ||
| + | See graphic, Rainfall in Delhi, March to mid- May, 2011-22 | ||
| + | == June-July== | ||
| + | ===2013: wettest in country in 19 years=== | ||
| + | [http://epaper.timesofindia.com/Default/Scripting/ArticleWin.asp?From=Archive&Source=Page&Skin=TOINEW&BaseHref=CAP/2013/08/02&PageLabel=14&EntityId=Ar01400&ViewMode=HTML The Times of India] 2013/08/02 | ||
| + | |||
| + | The June- July 2013 rainfall, which has been 117 % of the long period average [LPA] is the highest the country has seen since 1994. The last time there was more rain during this two-month period was in 1994, when the monsoon was 123% of the average. The 528.1mm rain bounty that the country got in the first half of the monsoon season is the third highest in 50 years. The wettest June-July spell during this period was in 1994 (564.7mm) while the second wettest was 1964 (538.1mm). Another interesting feature of this year’s rains has been the absence of a break in the monsoon ever since it covered the entire country in June 16. | ||
| + | |||
| + | ====Jun-Jul 2013: With 460mm rain, Delhi’s wettest in 10 years==== | ||
| + | |||
| + | Amit Bhattacharya TNN | ||
| + | |||
| + | [http://epaper.timesofindia.com/Default/Scripting/ArticleWin.asp?From=Archive&Source=Page&Skin=TOINEW&BaseHref=CAP/2013/08/04&PageLabel=4&EntityId=Ar00403&ViewMode=HTML The Times of India] 2013/08/04 | ||
| + | |||
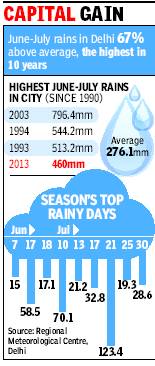
| + | [[File: monsoonsdelhi.jpg|Monsoons in Delhi, 1994-2013 |frame|500px]] | ||
| + | |||
| + | New Delhi: The first two months of the monsoon season have been wettest in the capital in the past 10 years. Delhi’s June-July rain tally stood at 460mm, 67% above normal, which is the second highest of this century after 2003. | ||
| + | |||
| + | The city’s rain aggregate got a huge boost in the second half of July. According to figures provided by the Regional Meteorological Centre, the capital got 238.9mm of rain during July 16-31, which is more than the average for the entire month. | ||
| + | |||
| + | There were 10 rainy days during this period, including the season’s wettest day (July 21), when 123.4mm came down on the city. This late surge lifted July’s rain tally to 340.5mm, 62% higher than the month’s average rainfall of 210.6mm. Since 1990, there have been only three years when the city has got more rain in June-July than this year. Apart from 2003, the other bountiful years were 1994 and 1993. | ||
| + | |||
| + | While the rain gods have been kind to Delhi, in neighbouring Haryana it’s been a different story. The meteorological district comprising Haryana, Delhi and Chandigarh is the only one in north India where rains have been deficient so far. That’s mainly because of poor rainfall in Haryana. | ||
| + | |||
| + | [[Category:Climate/Meteorology|R RAINFALL: INDIARAINFALL: INDIARAINFALL: INDIARAINFALL: INDIA | ||
| + | RAINFALL: INDIA]] | ||
| + | [[Category:India|R RAINFALL: INDIARAINFALL: INDIARAINFALL: INDIARAINFALL: INDIA | ||
| + | RAINFALL: INDIA]] | ||
| + | [[Category:Pages with broken file links|RAINFALL: INDIARAINFALL: INDIARAINFALL: INDIARAINFALL: INDIARAINFALL: INDIA | ||
| + | RAINFALL: INDIA]] | ||
| + | |||
| + | ==June- August rainfall== | ||
| + | ===2014-18=== | ||
| + | [https://epaper.timesgroup.com/Olive/ODN/TimesOfIndia/shared/ShowArticle.aspx?doc=TOIDEL%2F2018%2F09%2F02&entity=Ar01208&sk=C4175A80&mode=text Neha Madaan, For India, it’s the rainiest August in five years, September 2, 2018: ''The Times of India''] | ||
| + | |||
| + | [[File: 2014-18- Monsoon performance, June- August.jpg|2014-18- Monsoon performance, June- August <br/> From: [https://epaper.timesgroup.com/Olive/ODN/TimesOfIndia/shared/ShowArticle.aspx?doc=TOIDEL%2F2018%2F09%2F02&entity=Ar01208&sk=C4175A80&mode=text Neha Madaan, For India, it’s the rainiest August in five years, September 2, 2018: ''The Times of India'']|frame|500px]] | ||
| + | |||
| + | This August, India recorded the best monsoon for the month in last five years despite a 6.4% shortfall in showers in comparsion to the normal range. | ||
| + | |||
| + | The -6.4% departure is the least deficit recorded in August since 2014 – a drought year. Since 2014, the country saw departures from -8% to -21%. This year, however, all the subdivisions, except south peninsula, ended up with less than average rain in August 2018, but India fared better than all the years since 2014. | ||
| + | |||
| + | An IMD official said August had no break-like conditions this year, unlike last year and 2016. In 2017, breaklike conditions prevailed during the first week of July and on several days during the first fortnight of August. In 2017, August 3 and 4, and August 11 to 13 depicted typical monsoon-break conditions. This made August 2017 end up at a -12.1% departure from normal. | ||
| + | |||
| + | In 2016, rainfall activity was very less in June, second part of July and August, as well as in the beginning of September. Though rainfall activity was good in the beginning of July and August, the monthly rainfall in August 2016 ended with a -8.3% departure from normal. | ||
| + | |||
| + | In 2015 rainfall activity over India in August was very subdued. Except for some meteorological subdivisions of central, peninsular and extreme northeastern region, most of the subdivisions received deficient or scanty rainfall. | ||
| + | |||
| + | A K Srivastava, head of climate monitoring at IMD, Pune, said 2014 and 2015 were El Nino years, resulting in below-normal rain. “Typically, August experiences a break situation in the second or third week in most years. This year, monsoon was very active during August, so much so that it caused a deluge in Kerala. An upper air anti-cyclone in August over NE ensured westward movement of monsoon systems, causing good rainfall,” he said. | ||
| + | |||
| + | [[Category:Climate/Meteorology|R RAINFALL: INDIARAINFALL: INDIARAINFALL: INDIA | ||
| + | RAINFALL: INDIA]] | ||
| + | [[Category:India|R RAINFALL: INDIARAINFALL: INDIARAINFALL: INDIA | ||
| + | RAINFALL: INDIA]] | ||
| + | [[Category:Pages with broken file links|RAINFALL: INDIARAINFALL: INDIA | ||
| + | RAINFALL: INDIA]] | ||
| + | |||
| + | ==July== | ||
| + | ===The driest Julys=== | ||
| + | ==== 1980-2015 ==== | ||
| + | [[File: Total sown area under kharif crops 2014-15 and driest months of July, 1980-2015.jpg| i) Total sown area under kharif crops 2014 and 2015 <br/> ii) The driest Julys between 1980-2015; Graphic courtesy: [http://epaperbeta.timesofindia.com/Article.aspx?eid=31808&articlexml=Dry-days-17-rain-deficit-in-July-02082015018030 ''The Times of India''], Aug 02 2015|frame|500px]] | ||
| + | |||
| + | '''See graphic''': | ||
| + | |||
| + | ''Total sown area under kharif crops 2014 and 2015…'' | ||
| + | |||
| + | |||
| + | ===2015: July=== | ||
| + | [[File: July rains.jpg|Rains in July 2015; Graphic courtesy: [http://epaperbeta.timesofindia.com/Gallery.aspx?id=12_07_2015_001_034_012&type=P&artUrl=Dehluged-Wettest-July-11-in-5-years-cripples-12072015001034&eid=31808 ''The Times of India''], 11 July 2015|frame|500px]] | ||
| + | |||
| + | See graphic, ' Rains in July 2015 ' | ||
| + | |||
| + | ==August== | ||
| + | ===2009, 2021: low rainfall=== | ||
| + | [https://epaper.timesgroup.com/Olive/ODN/TimesOfIndia/shared/ShowArticle.aspx?doc=TOIDEL/2021/09/02&entity=Ar01812&sk=8F92C423&mode=text Neha Madaan, Sep 2, 2021: ''The Times of India''] | ||
| + | |||
| + | The 196.2mm rain in August was the lowest recorded in India after the deficient monsoon in 2009 in a 12-year period, reports Neha Madaan. The rainfall, with a deficit of 24.1%, was below the 258mm mark that is normal for this month. August rains over the past decade have been over 200mm. | ||
| + | |||
| + | IMD data from 2010 for August show that the country received over 300mm rain, the highest, in 2020 and 192.5mm, the lowest, in 2009. IMD director general Mrutyunjay Mohapatra told TOIthat the negative Indian Ocean Dipole (IOD) was among the reasons for the below normal rain for August this year. “A negative IOD is unfavourable for the Indian monsoon. Monsoon depressions were absent,” he said. Weather activity over northwest Pacific, where the maximum number of depressions and cyclones form in August, also affected rainfall in this month in India. | ||
| + | |||
| + | [[Category:Climate/Meteorology|R RAINFALL: INDIARAINFALL: INDIARAINFALL: INDIARAINFALL: INDIA | ||
| + | RAINFALL: INDIA]] | ||
| + | [[Category:India|R RAINFALL: INDIARAINFALL: INDIARAINFALL: INDIARAINFALL: INDIA | ||
| + | RAINFALL: INDIA]] | ||
| + | [[Category:Pages with broken file links|RAINFALL: INDIARAINFALL: INDIARAINFALL: INDIARAINFALL: INDIARAINFALL: INDIA | ||
| + | RAINFALL: INDIA]] | ||
| + | |||
| + | =‘Heavy rainfall;’ extremely- and very- = | ||
| + | ==2017 >2019 == | ||
| + | [https://epaper.timesgroup.com/Olive/ODN/TimesOfIndia/shared/ShowArticle.aspx?doc=TOIDEL/2020/09/17&entity=Ar00208&sk=8A500F65&mode=text Vishwa Mohan, September 17, 2020: ''The Times of India''] | ||
| + | |||
| + | [[File: Extremely- and very heavy rainfall in India, 2017-2019.jpg|Extremely- and very heavy rainfall in India, 2017 >2019 <br/> From: [https://epaper.timesgroup.com/Olive/ODN/TimesOfIndia/shared/ShowArticle.aspx?doc=TOIDEL/2020/09/17&entity=Ar00208&sk=8A500F65&mode=text Vishwa Mohan, September 17, 2020: ''The Times of India'']|frame|500px]] | ||
| + | |||
| + | |||
| + | The number of rain gauge stations recording ‘extremely heavy rainfall’ in the country has increased by more than 100% in the past three years — from 261 in 2017 to 554 in 2019 – while the ones which recorded ‘very heavy rainfall’ increased by over 67% during the same period. | ||
| + | |||
| + | The IMD’s data for the past three years, shared by Union minister of earth sciences Harsh Vardhan in Rajya Sabha on Tuesday, shows a similar trend for number of cyclones in Arabian Sea and Bay of Bengal. Collectively, the number of cyclones increased from three in 2017 to eight in 2019. | ||
| + | |||
| + | Though it’s not a longterm trend as there are many years in the past that have recorded a decrease in the number of extreme weather events, the three years’ events could lead to “unexpected increase in natural disasters” during the 2017-19 period. Attributing the reasons to climate change, IMD chief Mrutyunjay Mohapatra told TOI on Wednesday that it’s an established fact that ‘extremely heavy rainfall’ has been increasing in tropical regions, including India. | ||
| + | |||
| + | “This trend is, however, not meant for the entire country. If you look at our analysis of rainfall patterns based on the data of the last 30 years, you will find that there are states which have witnessed significant decreasing trends of annual rainfall,” he said. On Wednesday, the minister pitched for a robust climate risk management framework for India to determine the impact of various climate change risks over the country. | ||
| + | |||
| + | ==2017> 21== | ||
| + | [https://epaper.timesgroup.com/Olive/ODN/TimesOfIndia/shared/ShowArticle.aspx?doc=TOIDEL/2021/09/02&entity=Ar01813&sk=51B9012B&mode=text Vishwa Mohan, Sep 2, 2021: ''The Times of India''] | ||
| + | |||
| + | The overall quantitative rainfall in India might not have increased but the number of stations recording ‘very heavy’ and ‘extremely heavy’ rainfall within limited period is increasing, said IMD chief M Mohapatra on Wednesday while underlining why this changing aspect of the monsoon makes it all the more important to go for rainwater conservation in a big way. | ||
| + | |||
| + | He noted that the skewed distribution may affect farming operations unless there are enough efforts to save rainwater to support agriculture in the deficit period or break phase of the monsoon. | ||
| + | |||
| + | The data show the number of stations recording very heavy (115.6 to 204.5 mm) rainfall in August increased from 401 in 2017 to 510 in 2018, 987 in 2019 and 1008 in 2020. Similarly, the number of stations recording extremely heavy (over 204.5 mm) rainfall, also in the month of August, increased from 90 in 2017 to 165 last year without actually affecting the overall quantity of rainfall during the entire monsoon period. It means the remaining months of the monsoon season had seen much less rainfall. | ||
| + | |||
| + | Though the year 2021 has not seen this trend in August, spatial distribution of the rainfall was highly skewed during the first three months of the monsoon season with northwest India, Gujarat and parts of Odisha facing limited rainfall. | ||
| + | |||
| + | The depressed rainfall in northwest India may, however, marginally affect the ongoing sowing operation as the region, having good irrigation facilities, doesn’t depend on rainfed agriculture. Overall, the acreage in the country as a whole will be above normal due to good distribution of rainfall, at least, over rainfed areas of Maharashtra, UP and MP. | ||
| + | |||
| + | The overall acreage of Kharif crops (paddy, sugarcane, cotton, oilseeds and coarse cereals) may not cross the last year’s figure of record acreage, but it’ll certainly be above ‘normal’ sown area (average of last five years) of 1073 lakh hectares (LH). | ||
| + | Records show that overall acreage as on last Friday had already reached 1064 LH which was 34 LH more than the ‘normal’ acreage (1030 LH) of corresponding period. | ||
| + | |||
| + | [[Category:Climate/Meteorology|R RAINFALL: INDIARAINFALL: INDIARAINFALL: INDIARAINFALL: INDIA | ||
| + | RAINFALL: INDIA]] | ||
| + | [[Category:India|R RAINFALL: INDIARAINFALL: INDIARAINFALL: INDIARAINFALL: INDIA | ||
| + | RAINFALL: INDIA]] | ||
| + | [[Category:Pages with broken file links|RAINFALL: INDIARAINFALL: INDIARAINFALL: INDIARAINFALL: INDIARAINFALL: INDIA | ||
| + | RAINFALL: INDIA]] | ||
| + | |||
| + | =Rainfall and the kharif crop= | ||
| + | ==2003-11== | ||
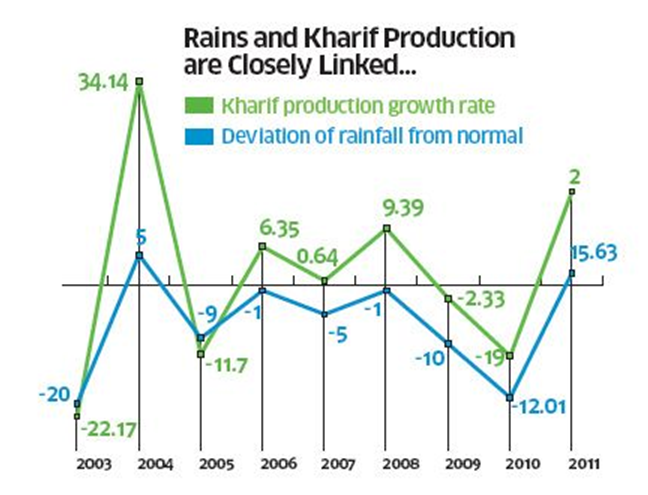
| + | [[File: rainfall.png|The linkage between rainfall and the kharif crop, 2003-11 <br/> The Times of India |frame|500px]] | ||
| + | |||
| + | '''See graphic''': | ||
| + | |||
| + | ''The linkage between rainfall and the kharif crop, 2003-11'' | ||
| + | |||
| + | [[Category:Climate/Meteorology|R | ||
| + | RAINFALL: INDIA]] | ||
| + | [[Category:India|R | ||
| + | RAINFALL: INDIA]] | ||
| + | |||
| + | =REGIONAL VARIATIONS= | ||
| + | == Some of India's rainiest places== | ||
| + | See graphic, ' Some of India's rainiest places ' | ||
| + | [[File: Some of India's rainiest places.jpg|Some of India's rainiest places; Graphic courtesy: [http://epaperbeta.timesofindia.com/Article.aspx?eid=31808&articlexml=WHY-THE-WORLDS-WETTEST-PLACE-GETS-THIRSTY-19062016017011 ''The Times of India''], Jun 19 2016|frame|500px]] | ||
| + | |||
| + | [[Category:Climate/Meteorology|R RAINFALL: INDIARAINFALL: INDIARAINFALL: INDIARAINFALL: INDIA | ||
| + | RAINFALL: INDIA]] | ||
| + | [[Category:India|R RAINFALL: INDIARAINFALL: INDIARAINFALL: INDIARAINFALL: INDIA | ||
| + | RAINFALL: INDIA]] | ||
| + | [[Category:Pages with broken file links|RAINFALL: INDIARAINFALL: INDIARAINFALL: INDIARAINFALL: INDIARAINFALL: INDIA | ||
| + | RAINFALL: INDIA]] | ||
| + | |||
| + | =Delhi= | ||
| + | ==1910-2022: the wettest Octobers== | ||
| + | [[File: Delhi, the wettest Octobers, 1910-2022.jpg|Delhi, the wettest Octobers, 1910-2022 <br/> From: [https://timesofindia.indiatimes.com/city/delhi/as-rain-spell-abates-delhi-records-wettest-october-in-66-years/articleshow/94797316.cms Kushagra Dixit, Oct 12, 2022: ''The Times of India'']|frame|500px]] | ||
| + | |||
| + | '''See graphic''': | ||
| + | |||
| + | '' Delhi, the wettest Octobers, 1910-2022 '' | ||
| + | |||
| + | ==2011 - 20: Rainfall recorded at Safdarjung== | ||
| + | Regular rain prevented any big rise in mercury, making it the coolest July since 2016. The mean maximum temperature recorded this July was 34.7 degrees Celsius against the normal average of 35.6 degrees Celsius. The last time the city recorded a lower maxi mum temperature in July was in 2016 at 34.5 degrees Celsius. | ||
| + | |||
| + | [[Category:Climate/Meteorology|R RAINFALL: INDIARAINFALL: INDIARAINFALL: INDIARAINFALL: INDIARAINFALL: INDIA | ||
| + | RAINFALL: INDIA]] | ||
| + | [[Category:India|R RAINFALL: INDIARAINFALL: INDIARAINFALL: INDIARAINFALL: INDIARAINFALL: INDIA | ||
| + | RAINFALL: INDIA]] | ||
| + | [[Category:Pages with broken file links|RAINFALL: INDIARAINFALL: INDIARAINFALL: INDIARAINFALL: INDIARAINFALL: INDIARAINFALL: INDIA | ||
| + | RAINFALL: INDIA]] | ||
| + | |||
| + | ==June to September== | ||
| + | ===2011-23=== | ||
| + | [[File: Rainfall in Delhi June to September, 2011 – 23.jpg| Rainfall in Delhi June to September, 2011 – 23 <br/> From: [https://epaper.timesgroup.com/article-share?article=30_06_2023_007_014_cap_TOI Priyangi Agarwal, June 30, 2023: ''The Times of India'']|frame|500px]] | ||
| + | |||
| + | '''See graphic''': | ||
| + | |||
| + | '' Rainfall in Delhi June to September, 2011 – 23 '' | ||
| + | |||
| + | ==Annual average normal rainfall== | ||
| + | The annual average normal rainfall mark for Safdarjung from January to December is 779 mm | ||
| + | |||
| + | The normal rainfall during July is 210.6 mm at Safdarjung Observatory. | ||
| + | ===2018-2021=== | ||
| + | 2018: the city had crossed the annual average normal mark with 816.mm rainfall. | ||
| + | |||
| + | 2019, 2020 According to IMD, the annual average rainfall recorded was below the normal mark. Safdarjung station received 613 mm rainfall in 2019 and 765.4 mm rainfall in 2020 against the normal mark of 779 mm. | ||
| + | |||
| + | 2021: The city received 780.7 mm rainfall till 1 August morning while, according to India Meteorological Department (IMD). Of the total rain, 507.1 mm rainfall was recorded solely in July. | ||
| + | |||
| + | Kuldeep Srivastava, scientist at IMD and head of Regional Weather Forecasting Centre, said, “Delhi’s base station Safdarjung crossed the annual average normal rainfall mark on August 1, with five months still left to the year. After the onset of the monsoon, the city has been receiving rain on most days. July recorded 16 rainy days, including three heavy rain days. As August usually witnesses heavy rain days too, the annual rainfall recorded this year is expected to be higher.” | ||
| + | |||
| + | The actual rainfall was nearly 141% above normal than the long-period average. Apart from July, May also recorded excess rain than the average mark. The city received 144.8 mm rainfall in May, while January, February, March, April and June recorded deficit rainfall. | ||
| + | |||
| + | |||
| + | ====June- Aug (average); 2018 (actual)==== | ||
| + | [https://epaper.timesgroup.com/Olive/ODN/TimesOfIndia/shared/ShowArticle.aspx?doc=TOIDEL%2F2018%2F09%2F04&entity=Ar00612&sk=9246DAD6&mode=text Jasjeev Gandhiok, Hat-trick of rainy days in Sept helps erase deficit of 2 months, September 4, 2018: ''The Times of India''] | ||
| + | |||
| + | [[File: Rainfall in Delhi, June- August- average; 2018- actual.jpg|Rainfall in Delhi <br/> June- Aug (average); 2018 (actual) <br/> From: [https://epaper.timesgroup.com/Olive/ODN/TimesOfIndia/shared/ShowArticle.aspx?doc=TOIDEL%2F2018%2F09%2F04&entity=Ar00612&sk=9246DAD6&mode=text Jasjeev Gandhiok, Hat-trick of rainy days in Sept helps erase deficit of 2 months, September 4, 2018: ''The Times of India'']|frame|500px]] | ||
| + | |||
| + | The capital saw two rainfall deficit months during this monsoon, but the first three days of September seem to be making up for it — Delhi now has a 13% rainfall ‘surplus’. | ||
| + | |||
| + | A Met official said that after recording a deficit of 39% in June and 17% in August, Delhi, as per the measurements by the Safdarjung observatory, has now received 618.8mm of rain in the monsoon season so far as compared to the usual average of 545.5mm. | ||
| + | |||
| + | Although the Safdarjung observatory is considered the base both in terms of rainfall and temperatures, the Met office said the overall rainfall distribution across all districts in Delhi still showed a deficit of 8% at 505.1mm as compared with the average of 548.1mm. “Central, northwest and northeast Delhi are all in the deficient zone right now, while northern Delhi has recorded a large excess. The other parts like south and southwest Delhi are close to the average,” said a Met official. | ||
| + | |||
| + | According to the India Meteorological Department (IMD), with moderate showers, September is on track to cross its monthly average of 125.1mm in this first week itself, recording around 86mm of rainfall till 8.30am on Monday. “The average for Delhi in September is around 125mm. With more rain forecast for this week, the capital could record a good surplus during this period,” said the Met official. | ||
| + | |||
| + | According to IMD data, Delhi’s Safdarjung observatory recorded just 40.1mm rain in June as compared to a monthly average of 65.5mm. However, July saw a surplus of 36% with 286.2mm rain. The monthly average for July is 210.6mm. | ||
| + | |||
| + | “But August once again had a rainfall deficit of around 17% with just 206.5mm rain recorded as compared to a normal of 247.7mm for Safdarjung. Late rainfall activities in the last week of August improved this figure. However, September so far has been extremely good for Delhi,” said an official. | ||
| + | |||
| + | On August 28, Gurgaon received the heaviest rainfall in eight years, and Delhi has seen moderate showers over the past three days. The forecast for this week shows that light-to-moderate showers are likely to continue over the entire national capital region (NCR). Rainfall is largely considered ‘deficient’ if it is under 19% of the normal, while ‘excess’ rainfall is recorded if it’s above 19%. | ||
| + | |||
| + | “Conditions right now are ideal for more rain not just over Delhi but adjoining places, too. We expect this activity to continue for at least the next three to four days,” said an official. | ||
| + | |||
| + | ===2018, Sept 1-10: longest wet spell since 1988=== | ||
| + | [https://epaper.timesgroup.com/Olive/ODN/TimesOfIndia/shared/ShowArticle.aspx?doc=TOIDEL%2F2018%2F09%2F11&entity=Ar00301&sk=587823CF&mode=text Amit Bhattacharya, September 11, 2018: ''The Times of India''] | ||
| + | |||
| + | [[File: Rainfall in Delhi, 1-10 Sept 2018- the longest wet spell since 1988.jpg|Rainfall in Delhi, 1-10 Sept 2018- the longest wet spell since 1988 <br/> From: [https://epaper.timesgroup.com/Olive/ODN/TimesOfIndia/shared/ShowArticle.aspx?doc=TOIDEL%2F2018%2F09%2F11&entity=Ar00301&sk=587823CF&mode=text Amit Bhattacharya, September 11, 2018: ''The Times of India'']|frame|500px]] | ||
| + | |||
| + | The capital witnessed its longest wet spell in the month of September in 22 years, with rain being recorded in nine consecutive days from the first till the ninth of the month. Safdarjung, Delhi’s main weather station, registered 179mm of rain during these nine days, nearly 40% more than the normal for the entire month. | ||
| + | |||
| + | This was also the wettest start to September — counting the first 10 days of the month — in seven years and the second wettest in the last 22 years, according to rainfall data from IMD and the TuTiempo website. | ||
| + | |||
| + | In fact, it rained continuously in the capital from August 27 till September 9, as per Safdarjung weather station records, barring just a single day — August 31. | ||
| + | |||
| + | The next few days, however, are expected to be relatively dry in the city. | ||
| + | |||
| + | |||
| + | '''9 days of continuous rain in Sept unusual for Delhi''' | ||
| + | |||
| + | Safdarjung recorded as much as 259mm of rain in this 14-day period, more than what the city normally receives during the entire period of its wettest month of August. Normal August rainfall in Delhi is 247.7 mm. | ||
| + | |||
| + | “It is highly unusual for the city to record nine straight days of rainfall, particularly in September. The spell was caused by steady incursion of moisture into the region because of a persisting cyclonic circulation over Uttar Pradesh and Haryana that led to the monsoon trough staying close to the capital,” said B P Yadav, head of IMD’s regional meteorological centre. | ||
| + | |||
| + | This peculiar atmospheric condition led to long spells of rain in a relatively small area adjoining south Haryana and UP, the official said. | ||
| + | |||
| + | The monsoon trough, a typical feature of the monsoon season, is an east-west line of atmospheric low pressure that divides two regions of differing air flows. It usually moves in a northsouth direction, shuttling between the Himalayan foothills and the central Indian plateau. But during this period, officials said, the trough stayed mostly just north or south of the national capital, creating perfect conditions for rainfall over the area. | ||
| + | |||
| + | It was in 2011 that the capital last saw a wetter start to September. Then, the cumulative rainfall in the first 10 days of the month was just marginally more than this year, at 181.8mm. Going back further, such heavy rainfall in the beginning of September was last seen in the capital way back in 1995, when 179.3mm was recorded in the first 10 days of the month. | ||
| + | |||
| + | As for most consecutive rainy days in September, 2011 too saw a nine-day wet spell like this year. A longer spell was last witnessed in 1995, when 11 straight days of rain took place from September 3 to 13, as per the weather archives website, TuTiempo.net. | ||
| + | |||
| + | [[Category:Climate/Meteorology|R RAINFALL: INDIARAINFALL: INDIARAINFALL: INDIA | ||
| + | RAINFALL: INDIA]] | ||
| + | [[Category:India|R RAINFALL: INDIARAINFALL: INDIARAINFALL: INDIA | ||
| + | RAINFALL: INDIA]] | ||
| + | [[Category:Pages with broken file links|RAINFALL: INDIA | ||
| + | RAINFALL: INDIA]] | ||
| + | |||
| + | [[Category:Climate/Meteorology|R RAINFALL: INDIARAINFALL: INDIARAINFALL: INDIARAINFALL: INDIA | ||
| + | RAINFALL: INDIA]] | ||
| + | [[Category:India|R RAINFALL: INDIARAINFALL: INDIARAINFALL: INDIARAINFALL: INDIA | ||
| + | RAINFALL: INDIA]] | ||
| + | [[Category:Pages with broken file links|RAINFALL: INDIARAINFALL: INDIARAINFALL: INDIARAINFALL: INDIARAINFALL: INDIA | ||
| + | RAINFALL: INDIA]] | ||
| + | |||
| + | [[Category:Climate/Meteorology|R RAINFALL: INDIARAINFALL: INDIARAINFALL: INDIARAINFALL: INDIARAINFALL: INDIA | ||
| + | RAINFALL: INDIA]] | ||
| + | [[Category:India|R RAINFALL: INDIARAINFALL: INDIARAINFALL: INDIARAINFALL: INDIARAINFALL: INDIA | ||
| + | RAINFALL: INDIA]] | ||
| + | [[Category:Pages with broken file links|RAINFALL: INDIARAINFALL: INDIARAINFALL: INDIARAINFALL: INDIARAINFALL: INDIARAINFALL: INDIA | ||
| + | RAINFALL: INDIA]] | ||
| + | |||
| + | = Gurgaon/ Gurugram= | ||
| + | ==Rainfall records, 2008- 2018== | ||
| + | [[File: Gurgaon rainfall 2008 2018.jpg| Gurgaon’s rainfall records, 2008- 2018 [https://epaper.thehindu.com/Home/ShareArticle?OrgId=GV34JLIQ9.1&imageview=1 ''The Hindu''] |frame|500px]] | ||
| + | See graphic, ' Gurgaon’s rainfall records, 2008- 2018 ' | ||
| + | |||
| + | |||
| + | = Karnataka= | ||
| + | ==2000-18: 11 drought years, 2 flood years== | ||
| + | [https://timesofindia.indiatimes.com/city/bengaluru/drought-floods-are-new-normal-in-karnataka/articleshow/69191638.cms May 6, 2019: ''The Times of India''] | ||
| + | |||
| + | Drought, floods new normal as Karnataka rain pattern changes | ||
| + | |||
| + | BENGALURU: Karnataka has been witnessing a drastic change in rainfall pattern and distribution over the past two decades, resulting in frequent drought, floods and untimely rain. | ||
| + | |||
| + | According to a study by the Karnataka State Natural Disaster Monitoring Centre (KSNDMC), north Karnataka and coastal areas have been g a declining trend in rainfall, besides a very high fluctuation in rain distribution. | ||
| + | The state has reeled under 11 years of drought and two years of floods since 2000. | ||
| + | |||
| + | A good example of this was 2018 when the state had to deal with floods and drought. “Karnataka is perhaps the only state in the country to be declared both drought- and flood-hit in the same year. It’s mainly because of drastic change in rainfall distribution,” said GS Srinivas Reddy, director, KSNDMC. | ||
| + | |||
| + | While most districts of north Karnataka and south- interior Karnataka faced drought in 2018, Kodagu, Chikkamagaluru, Dakshina Kannada and Udupi districts and parts of Shivamogga were hit by floods and incessant rain. In fact, Kodagu and parts of Chikkamagaluru bore the brunt of rain fury. | ||
| + | |||
| + | Reddy said drought and floods were occurring not because there’s a drastic decline or increase in rainfall. As per analysis of data since 1991, there’s been an average decline of just 2.5mm of rain during the southwest monsoon and 4.2mm in the northeast monsoon. A 4mm decrease in rain is equal to loss of 1 tmcft of water, which is insignificant compared to the state’s annual rain yield. | ||
| + | |||
| + | In a year, Karnataka receives 1,135mm of rain and the south-west monsoon accounts for 73% of it. Since 2011, the state has received an average rainfall of 1,033 mm, that’s 10% less than normal. | ||
| + | |||
| + | Even north-interior Karnataka received good rainfall with an average of 593mm against the annual rainfall of 712mm. | ||
| + | |||
| + | It shows that distribution of rainfall, not quantity, is the problem. In 2015, the state received good rainfall in April and early May facilitating good sowing. But rain stayed away in July and August when it was needed the most. It’s been happening for the past few days too, Reddy added. | ||
| + | |||
| + | =Mumbai= | ||
| + | '''2,000 mm of rainfall was received in the rainy season ''' | ||
| + | |||
| + | …in 52 days: By July 22, 2021 | ||
| + | |||
| + | …in 56 days: By July 26, 2023: Mumbai reached the first 1,000 mm rainfall milestone on July 21 2023, and the next 1,000 mm mark was reached in five days. | ||
| + | |||
| + | [[Category:Climate/Meteorology|R RAINFALL: INDIARAINFALL: INDIARAINFALL: INDIARAINFALL: INDIARAINFALL: INDIA | ||
| + | RAINFALL: INDIA]] | ||
| + | [[Category:India|R RAINFALL: INDIARAINFALL: INDIARAINFALL: INDIARAINFALL: INDIARAINFALL: INDIA | ||
| + | RAINFALL: INDIA]] | ||
| + | [[Category:Pages with broken file links|RAINFALL: INDIARAINFALL: INDIARAINFALL: INDIARAINFALL: INDIARAINFALL: INDIARAINFALL: INDIA | ||
| + | RAINFALL: INDIA]] | ||
| + | |||
| + | = North India= | ||
| + | == Falling rainfall trend/ 1961-2013== | ||
| + | [http://epaperbeta.timesofindia.com/Article.aspx?eid=31808&articlexml=IMD-analysis-reveals-falling-rainfall-trend-in-north-30072017010055 Neha Madaan & Amit Bhattacharya|IMD analysis reveals falling rainfall trend in north India|Jul 30 2017 : The Times of India (Delhi)] | ||
| + | |||
| + | North India may have enjoyed a bountiful monsoon so far this year but long-term rainfall data points to a worrying trend. An India Meteorological Department (IMD) analysis reveals several parts of the region have been witnessing decreasing annual rainfall over the past five decades. | ||
| + | |||
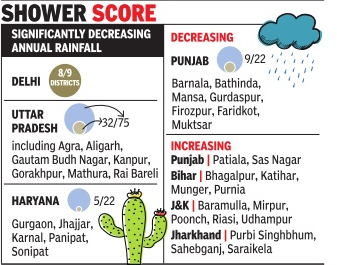
| + | Delhi and NCR cities such as Gurgaon and Noida such as Gurgaon and Noida are among 85 districts across the country , constituting 8% of India's area, where a “significantly decreasing“ rainfall trend has been observed since 1961. | ||
| + | |||
| + | The decreasing trend was most pronounced in north India, which has more than 50 of these districts, many in agriculturally important belts. | ||
| + | |||
| + | The IMD study ana lysed annual and seasonal rainfall trends in 632 districts and 34 meteorological sub-divisions, barring Ladakh, Andaman & Nicobar and Lakshadweep islands, using rainfall data from 1901 to 2013. Uttar Pradesh finds it self with more than 40% (32 out of 75) of its districts showing a significant drop in rainfall. In Delhi, eight of the nine (old) districts showed the trend. | ||
| + | |||
| + | An IMD scientist involved in the analysis told TOI that while researchers found no trend in countrywide rainfall during the periods studied, subdivision and district-wise trends were apparent. “The aim of the study was to implement suitable measures and en sure proper management of water resources in districts that have shown decreasing rainfall,“ the scientist said. | ||
| + | |||
| + | More recent data outside the study, too, reveals a weakening of the monsoon in several parts of north India. The trend is sharpest since 1999. Of the 18 rainy seasons during this period, Haryana received at least 10% below normal monsoon in 13 years. For Punjab, the corresponding figure was 12. Decreasing rainfall has obvious impacts on levels of groundwater, which is increasingly being used in agricul ture as well as cities in the region. Satellite studies have revealed alarming levels of over exploitation of ground water in north India. | ||
| + | [[File:rain.png||frame|500px]] | ||
| + | The IMD study also revealed an increasing rainfall trend in several districts, including many in Jammu & Kash mir and Bihar, and a few in Jharkhand, Punjab and Chhattisgarh. | ||
| + | |||
| + | Scientists involved in the study said it was difficult to pinpoint reasons for the increasing or decreasing trends. An expert at the Indian Institute of Tropical Meteorology reasoned that monsoon circulation had been showing a weakening trend since the 1950s, possibly due to anthropogenic influences like pollution aerosols. “Indo-Gangetic plains are a core monsoon area, where the monsoon trough is located. The weakening of the monsoon circulation may have had its impact on this region too,“ he said. | ||
| + | |||
| + | [[Category:Climate/Meteorology|R RAINFALL: INDIARAINFALL: INDIARAINFALL: INDIA | ||
| + | RAINFALL: INDIA]] | ||
| + | [[Category:India|R RAINFALL: INDIARAINFALL: INDIARAINFALL: INDIA | ||
| + | RAINFALL: INDIA]] | ||
| + | [[Category:Pages with broken file links|RAINFALL: INDIARAINFALL: INDIARAINFALL: INDIARAINFALL: INDIA | ||
| + | RAINFALL: INDIA]] | ||
| + | |||
| + | [[Category:Climate/Meteorology|R RAINFALL: INDIARAINFALL: INDIARAINFALL: INDIARAINFALL: INDIARAINFALL: INDIA | ||
| + | RAINFALL: INDIA]] | ||
| + | [[Category:India|R RAINFALL: INDIARAINFALL: INDIARAINFALL: INDIARAINFALL: INDIARAINFALL: INDIA | ||
| + | RAINFALL: INDIA]] | ||
| + | [[Category:Pages with broken file links|RAINFALL: INDIARAINFALL: INDIARAINFALL: INDIARAINFALL: INDIARAINFALL: INDIARAINFALL: INDIA | ||
| + | RAINFALL: INDIA]] | ||
| + | |||
| + | = Pune= | ||
| + | == 1961-2013: bucks trend of 85 districts == | ||
| + | |||
| + | [http://epaperbeta.timesofindia.com/Article.aspx?eid=31804&articlexml=Rainfall-decreased-in-85-districts-since-1961-Pune-25072017010038 Neha Madaan|Rainfall decreased in 85 districts since 1961, Pune bucked trend: IMD|Jul 25 2017 : The Times of India (Mumbai)] | ||
| + | |||
| + | Despite being a rain shadow region, Pune is the only district in Maharashtra where yearly rainfall has increased significantly since 1961 though close to 85 districts in the country, including in Delhi, Haryana, Uttar Pradesh and Madhya Pradesh, among others, have witnessed decreasing annual rainfall during the last five decades, a recent analysis by India Meteorological Department (IMD) has found. | ||
| + | |||
| + | The IMD study analysed long-term trend of annual and seasonal rainfall over 632 districts and 34 meteorological sub-divisions using rainfall data from 1901 to 2013. The analysis was done barring Andaman and Nicobar and Laksh adweep islands. The analysis found that while monsoon and annual rainfall has decreased significantly in Pune from 1901 to 2013, the district's annual rainfall has increased over the recent decades -from 1961-2013. | ||
| + | |||
| + | Annual and monsoon rainfall for Mumbai suburban and Raigad, too, has decreased during the 113-year period, the study found. Conversely , from 1961 to 2013, the annual rainfall for the two coastal districts has increased, but not significantly. An IMD scientist involved in the analysis told TOI that while researchers found no trend in the country-wide rainfall during the periods studied, subdivision-wise and districtwise trends were apparent. | ||
| + | |||
| + | The analysis found that over the last five decades, subdivisions like Marathwada in Maharashtra, Punjab, Himachal Pradesh, Harayana, Delhi, Uttarakhand, west and east UP have seen a reduction in both, annual and monsoon rainfall, while Konkan-Goa has seen a significant increasing trend, followed by Madhya Maharashtra, Vidarbha, among others in the country . | ||
=Punjab and Haryana= | =Punjab and Haryana= | ||
| − | ==Rain woes in Punjab | + | ==1999-2014: Rain woes in Punjab, Haryana== |
[http://epaperbeta.timesofindia.com//Article.aspx?eid=31808&articlexml=SHOWER-SHORTAGE-For-2-grain-bowl-states-below-03062015023054 ''The Times of India''], Jun 03 2015 | [http://epaperbeta.timesofindia.com//Article.aspx?eid=31808&articlexml=SHOWER-SHORTAGE-For-2-grain-bowl-states-below-03062015023054 ''The Times of India''], Jun 03 2015 | ||
[[File: Rain woes in Punjab and Haryana, 1999-2014.jpg| Rain woes in Punjab and Haryana, 1999-2014; Graphic courtesy: [http://epaperbeta.timesofindia.com//Article.aspx?eid=31808&articlexml=SHOWER-SHORTAGE-For-2-grain-bowl-states-below-03062015023054 ''The Times of India'']|frame|500px]] | [[File: Rain woes in Punjab and Haryana, 1999-2014.jpg| Rain woes in Punjab and Haryana, 1999-2014; Graphic courtesy: [http://epaperbeta.timesofindia.com//Article.aspx?eid=31808&articlexml=SHOWER-SHORTAGE-For-2-grain-bowl-states-below-03062015023054 ''The Times of India'']|frame|500px]] | ||
| Line 105: | Line 727: | ||
Many studies, including those using satellite data to map the groundwater situation, have shown that such drawals were unsustainable and the region was fast reaching the limits of such overexploitation. | Many studies, including those using satellite data to map the groundwater situation, have shown that such drawals were unsustainable and the region was fast reaching the limits of such overexploitation. | ||
| − | == | + | [[Category:Climate/Meteorology|R RAINFALL: INDIARAINFALL: INDIARAINFALL: INDIA |
| − | [[ | + | RAINFALL: INDIA]] |
| − | [ | + | [[Category:India|R RAINFALL: INDIARAINFALL: INDIARAINFALL: INDIA |
| + | RAINFALL: INDIA]] | ||
| + | [[Category:Pages with broken file links|RAINFALL: INDIARAINFALL: INDIA | ||
| + | RAINFALL: INDIA]] | ||
| + | |||
| + | |||
| + | |||
| + | [[Category:Climate/Meteorology|R RAINFALL: INDIARAINFALL: INDIARAINFALL: INDIA | ||
| + | RAINFALL: INDIA]] | ||
| + | [[Category:India|R RAINFALL: INDIARAINFALL: INDIARAINFALL: INDIA | ||
| + | RAINFALL: INDIA]] | ||
| + | [[Category:Pages with broken file links|RAINFALL: INDIARAINFALL: INDIARAINFALL: INDIA | ||
| + | RAINFALL: INDIA]] | ||
| + | |||
| + | =South/ peninsular India= | ||
| + | ==2021== | ||
| + | [https://epaper.timesgroup.com/olive/odn/timesofindia/shared/ShowArticle.aspx?doc=TOIDEL%2F2021%2F12%2F02&entity=Ar00202&sk=65455990&mode=text ‘S India saw highest rainfall in Nov since 1901’/ ''The Times of India'' / 2 December 2021] | ||
| + | |||
| + | |||
| + | ''' 2021, Nov ''' Peninsular India recorded the highest ever rainfall in November since 1901, said the India Meteorological Department (IMD) on Wednesday while noting that even the ‘heavy’, ‘very heavy’ and ‘extremely heavy’ rainfall events last month were the highest over the last five years. | ||
| + | |||
| + | Andhra Pradesh, Tamil Nadu, Puducherry, Kerala and south interior Karnataka received169% excess rainfall while the country witnessed 645 ‘heavy’ (64.5 to 115.5 mm), 168 ‘ve heavy’ (115.6 to 204.5 mm) and 11 ‘extremely heavy’ (over 204.5 mm) rainfall events in November. | ||
| + | |||
| + | The Met department attributed such rainfall events to the active phase of northeast monsoon and also to five lowpressure systems over the Andaman Sea in November which was nearly double the average number of low-pressure systems in the month. | ||
| + | |||
| + | [[Category:Climate/Meteorology|R RAINFALL: INDIARAINFALL: INDIARAINFALL: INDIARAINFALL: INDIA | ||
| + | RAINFALL: INDIA]] | ||
| + | [[Category:India|R RAINFALL: INDIARAINFALL: INDIARAINFALL: INDIARAINFALL: INDIA | ||
| + | RAINFALL: INDIA]] | ||
| + | [[Category:Pages with broken file links|RAINFALL: INDIARAINFALL: INDIARAINFALL: INDIARAINFALL: INDIARAINFALL: INDIA | ||
| + | RAINFALL: INDIA]] | ||
| + | |||
| + | =YEAR-WISE= | ||
| + | |||
| + | [[Category:Climate/Meteorology|R RAINFALL: INDIARAINFALL: INDIARAINFALL: INDIARAINFALL: INDIA | ||
| + | RAINFALL: INDIA]] | ||
| + | [[Category:India|R RAINFALL: INDIARAINFALL: INDIARAINFALL: INDIARAINFALL: INDIA | ||
| + | RAINFALL: INDIA]] | ||
| + | [[Category:Pages with broken file links|RAINFALL: INDIARAINFALL: INDIARAINFALL: INDIARAINFALL: INDIARAINFALL: INDIA | ||
| + | RAINFALL: INDIA]] | ||
| + | |||
| + | =2018= | ||
| + | == Dry dams in west, north; overflow in south== | ||
| + | [https://epaper.timesgroup.com/Olive/ODN/TimesOfIndia/shared/ShowArticle.aspx?doc=TOIDEL%2F2018%2F09%2F16&entity=Ar00201&sk=E678C1CF&mode=text September 16, 2018: ''The Times of India''] | ||
| + | |||
| + | [[File: Level of water in Indian reservoirs, 2017 and 2018.jpg|Level of water in Indian reservoirs, 2017 and 2018 <br/> From: [https://epaper.timesgroup.com/Olive/ODN/TimesOfIndia/shared/ShowArticle.aspx?doc=TOIDEL%2F2018%2F09%2F16&entity=Ar00201&sk=E678C1CF&mode=text September 16, 2018: ''The Times of India'']|frame|500px]] | ||
| + | |||
| + | June was a good month: monsoon hit Kerala on time and most of the country, barring four states, got decent rain. By mid-June, rainfall was actually 20% in excess. Things got choppy after that – heavy rain in parts, deficit in others. So, by August 8, there was a 10% deficit. This shrunk to 6% by end of the month, but by September 11, deficit was up to 8%. | ||
| + | |||
| + | All this, coupled with how it has rained in the previous years, led to some reservoirs running dry while some are overflowing. Gujarat has been among the worst hit, with reservoirs linked to river Sabarmati 74% drier than last year. | ||
| + | |||
| + | It’s exactly the opposite down south. There, the reservoirs are overflowing. Tamil Nadu’s reservoirs now have 67% more water than in 2017. | ||
| + | |||
| + | == Civil Lines very wet, Mayur Vihar dry== | ||
| + | [https://epaper.timesgroup.com/Olive/ODN/TimesOfIndia/shared/ShowArticle.aspx?doc=TOIDEL%2F2018%2F09%2F21&entity=Ar00112&sk=0B17A168&mode=text Amit Bhattacharya, Delhi’s monsoon: Civil Lines very wet, Mayur Vihar dry, September 21, 2018: ''The Times of India''] | ||
| + | |||
| + | [[File: Rainfall between June 1 and Sept 19, 2018 in Delhi NCR areas.jpg|Rainfall between June 1 and Sept 19, 2018 in Delhi NCR areas <br/> From: [https://epaper.timesgroup.com/Olive/ODN/TimesOfIndia/shared/ShowArticle.aspx?doc=TOIDEL%2F2018%2F09%2F21&entity=Ar00112&sk=0B17A168&mode=text Amit Bhattacharya, Delhi’s monsoon: Civil Lines very wet, Mayur Vihar dry, September 21, 2018: ''The Times of India'']|frame|500px]] | ||
| + | |||
| + | The monsoon was normal in the capital in 2018, but how much rain did your locality get? The answer will depend on where you stay. If you are a Mayur Vihar resident, for instance, the monsoon was poor for you — 450mm since June 1, 27% below normal. But just 15km away, a Civil Lines resident had good reason to think the rains this year were excessive. The area has got 741mm of rain, 20% above normal. | ||
| + | |||
| + | Welcome to the vagaries of rainfall distribution. Even in a relatively small area like Delhi and its satellite cities, rains have been far from even. IMD’s district-wise rainfall data reveals a highly variable picture, ranging from 20% excess monsoon in north Delhi to a 45% shortfall in Ghaziabad. | ||
| + | |||
| + | Consider Gurgaon and its adjoining areas. While the Millennium City can feel shortchanged this monsoon, having got just 337mm of rain with a deficit of 26%, neighbouring Vasant Kunj and Dwarka have received more than double that amount of rainfall — 684mm, 11% above normal. | ||
| + | |||
| + | |||
| + | '''Met explains why your area got rain, your friend’s didn’t''' | ||
| + | |||
| + | Met officials said such high differences in rainfall weren’t out of line. “These differences aren’t abnormal. Rainfall is the most variable weather parameter. The smaller the area under study, the larger is the variation likely to be,” said B P Yadav, head of IMD’s Regional Meteorological Centre. | ||
| + | |||
| + | This year, several close by areas got vastly different amounts of rain over the season. For instance, the New Delhi district housing places such as Jor Bagh, Lodhi Colony and the Lutyens’ Bungalow Zone had a fairly wet monsoon (589mm, deficit of -4%) but the central district, including areas like Daryaganj, Paharganj and Karol Bagh, was considerably drier. The district has a 24% deficit, having received 472mm of rain. | ||
| + | |||
| + | Explaining such high divergence, Met officials said rainfall is rarely evenly distributed, even during spells of widespread rain. “In the beginning of this month, the Ridge observatory in north Delhi recorded heavy rainfall for twothree days while several other stations in the city hardly had any rain,” the official said. | ||
| + | |||
| + | For the record, the north Delhi district — IMD goes by the old demarcation of districts in which north includes places such as Rajpur Road, Shamnath Marg, Civil Lines and DU’s north campus — was the wettest this season in the city. The driest district was east (Mayur Vihar, Preet Vihar, Patparganj etc). Among Delhi’s neighbouring cities, Ghaziabad was the driest having received just 337mm of rain through the season. Overall, Delhi has an 8% monsoon deficit, well within the normal range (+20 to -20%). | ||
| + | |||
| + | However, questions could be asked on the quality of the district-wise data, particularly since the Met department does not have working rain gauges in all districts. An official said weather stations at Akshardham and DU were not working. | ||
| + | |||
| + | “Many of the automatic weather stations in the city were set up during the Commonwealth Games. These came up close to spots associated with the Games. These locations are not always ideal for capturing district-wise rain data,” an official said, not wishing to be named. | ||
| + | |||
| + | The north Delhi district was the wettest this season in the city. The driest district was east. Overall, Delhi has an 8% monsoon deficit, well within the normal range (+20 to -20%) | ||
| + | |||
| + | =2019= | ||
| + | ==27% decline in pre-monsoon rainfall== | ||
| + | [https://timesofindia.indiatimes.com/india/as-temperatures-rise-pre-monsoon-rainfall-records-27-per-cent-dip-imd/articleshow/69081733.cms April 28, 2019: ''The Times of India''] | ||
| + | |||
| + | As temperatures rise, pre-monsoon rainfall records 27 per cent dip: IMD | ||
| + | |||
| + | NEW DELHI: Pre-monsoon rainfall from March to April, a phenomenon critical to agriculture in some parts of the country, has recorded 27 per cent deficiency, according to the India meteorological department (IMD). | ||
| + | |||
| + | The IMD recorded 43.3 millimetres of rainfall across the country from March 1 to April 24 as against the normal precipitation of 59.6 millimetres. This was 27 per cent less of the long period average (LPA). | ||
| + | |||
| + | The highest deficiency of 38 per cent was recorded in the northwest India division of the IMD, which comprises states of Uttar Pradesh, Delhi, Punjab, Haryana, Jammu and Kashmir, Uttarakhand, Himachal Pradesh. | ||
| + | |||
| + | This was followed by the Southern peninsula division comprising all five states of the South India and the Union Territory of Puducherry, Goa and coastal Maharashtra, where the deficiency recorded was 31 per cent, the IMD said. | ||
| + | |||
| + | East and northeast India division recorded 23 per cent deficiency. | ||
| + | |||
| + | The Central India division is the only one to have recorded more than five per cent rainfall than the normal. | ||
| + | |||
| + | Pre-monsoon showers, thunderstorms and lightening have killed more than 50 people in Madhya Pradesh, Maharashtra, Gujarat and Rajasthan this month. | ||
| + | |||
| + | Several parts of India receive pre-monsoon rainfall which is critical for those regions. The phenomenon, which is usually from March to May end, is vital as it helps in bringing the temperatures down. | ||
| + | |||
| + | The situation also appears to be grim as large parts of the country have been witnessing heating and there has not been any major relief since April 17, said Mahesh Palawat, vice president (Meteorology and Climate Change), Skymet. | ||
| + | |||
| + | One of the reasons for a pre-monsoon rainfall is excessive heating from March to June which several parts of the country witness. The moisture from the Arabian Sea and the Bay of Bengal aids in creation of thunderstorms, Mritunjay Mohapatra, additional director general of the IMD said. | ||
| + | |||
| + | "Pre-monsoon rainfall is important for horticulture crops in some parts of the country. In states like Odisha, ploughing is done in the pre-monsoon season," he said. | ||
| + | |||
| + | Laxman Singh Rathore, former director general of the IMD, said in parts of northeast India and the Western Ghats, pre-monsoon rainfall is critical for plantation of crops. | ||
| + | |||
| + | There will be "moisture stress" in case of a deficit, he said. | ||
| + | |||
| + | Crops like sugarcane and cotton, planted in central India, survive on irrigation, but also require supplement of pre-monsoon rains, Rathore added. | ||
| + | |||
| + | "In the forested regions of Himalayas, pre-monsoon rainfall is necessary for plantations like apple. Due to moisture, pre-monsoon rainfall also helps in minimising the occurrence of forest fires," he said. | ||
| + | =2020 = | ||
| + | ==Delhi, Sep- Dec== | ||
| + | [[File: Southwest monsoon rainfall (June-September 2020).jpg|Southwest monsoon rainfall (June-September 2020) <br/> From: [https://timesofindia.indiatimes.com/india/why-a-drier-monsoon-will-be-a-normal-monsoon/articleshow/90874445.cms April 17, 2022: ''The Times of India'']|frame|500px]] | ||
| + | |||
| + | [[File: Southwest monsoon rainfall, area-wise (June- September 2020).jpg|Southwest monsoon rainfall, area-wise (June- September 2020) <br/> From: [https://timesofindia.indiatimes.com/india/why-a-drier-monsoon-will-be-a-normal-monsoon/articleshow/90874445.cms April 17, 2022: ''The Times of India'']|frame|500px]] | ||
| + | |||
| + | In 2020, the monsoon had withdrawn on September 30, but the city mostly remained dry as the last rainfall was recorded on September 8. Only trace rainfall was reported in October last year, while November and December recorded just 0.6mm and 1.6mm rainfall, respectively. | ||
| + | |||
| + | [[Category:Climate/Meteorology|R RAINFALL: INDIARAINFALL: INDIARAINFALL: INDIARAINFALL: INDIA | ||
| + | RAINFALL: INDIA]] | ||
| + | [[Category:India|R RAINFALL: INDIARAINFALL: INDIARAINFALL: INDIARAINFALL: INDIA | ||
| + | RAINFALL: INDIA]] | ||
| + | [[Category:Pages with broken file links|RAINFALL: INDIARAINFALL: INDIARAINFALL: INDIARAINFALL: INDIARAINFALL: INDIA | ||
| + | RAINFALL: INDIA]] | ||
| + | |||
| + | =2021= | ||
| + | ==Punjab== | ||
| + | [https://indianexpress.com/article/explained/the-declining-monsoon-rainfall-in-punjab-over-last-two-decades-7572517/?utm_source=newzmate&utm_medium=email&utm_campaign=explained&utm_content=6386461&pnespid=ArssqlsBtCsKng6U8IvASEASowM.yeot9QVVG.heNJrKMjsoxrdSjVqc_9EDmzNF.EevZ8Rt Anju Agnihotri Chaba, Oct 19, 2021: ''The Indian Express''] | ||
| + | |||
| + | Punjab has received below normal rainfall this monsoon, which has withdrawn in the past couple of days from the state. Not just this year, the state has seen a declining trend in rainfall during monsoon in the past two decades. The only silver lining was that the rainfall pattern was good this year, which was witnessed after a long gap. | ||
| + | |||
| + | ''' How much rainfall did the state receive this monsoon period? ''' | ||
| + | |||
| + | Though the formal period of monsoon in Punjab from June 1 to September 30 is over, monsoons are yet to withdraw from northern India. According to Indian Meteorological Department (IMD) records, 436.8 mm rainfall has been recorded in Punjab this year against the normal required 467.3 mm from June 1 to September 30 — which is 7 per cent below the normal monsoon rain. | ||
| + | |||
| + | Less rain in the monsoon period leads to less annual rainfall in the state because around 79 per cent of the annual rain of the state takes place in monsoon period. Punjab’s annual rainfall is around 650 mm, which has decreased from around 800 mm in the 1980s. | ||
| + | |||
| + | ''' What has been the trend of rainfall in the past two decades in the state? ''' | ||
| + | |||
| + | Weather scientists say Punjab has not only been recording below normal rainfall but also deficient rainfall in the past two decades. Anything less than the normal, which can be even 1 per cent less, is called below average rain, but rainfall is categorised as ‘deficient’ when it is less than 20 per cent of the normal average. | ||
| + | |||
| + | In the past two decades, the number of years with below average (467 mm) monsoon rainfall has increased to 8 per decade. According to records, between 2000 to 2009 and 2010 to 2019, there were eight years each decade with below normal rainfall, while the number of deficient rainfall years has also increased in this period as compared to the previous decades, which is a huge shift. Between 2010 to 2019, there were six years with deficient rainfall including 2014 (50% deficient rain), 2012 (46%), 2015 (31%), 2011 (28%) 2016 (25%), 2017 (22%), while 2010 and 2019 recorded below normal rainfall with (7% less rain) in each. Even in 2020, there was 17 per cent less rain from the average. Between 2000 to 2009, there were four years which had recorded deficient rainfall including 2002 (27.2% less), 2004 (44.1%), 2007 (32.2%) and 2009 (34.9%) and the other four recorded below normal rain out of total eight below average rainfall years in this decade. | ||
| + | |||
| + | This is a very bad trend for a state like Punjab where less rain means extracting more water from the ground for irrigation purposes, when the water table in 84 per cent of the state is already over-exploited. | ||
| + | |||
| + | ''' How much deficient rainfall did the state record in previous decades? ''' | ||
| + | |||
| + | From 1990 to 1999, there were only three years of below normal rainfall while there was no deficient rainfall year recorded in this decade. Between 1980 and 1989, there were two years 1982 (24.9%) and 1987 (67.6%) with deficient rainfall. Between 1970 and 1979, there were three years including 1972 (27.6%), 1974 (36.1%) and 1979 (38.3%) with deficient rainfall. From 1960 to 1969 and 1950 to 1959, there were three and one years with deficient rainfall, respectively. | ||
| + | According to Indian Meteorological Department (IMD), there were 35 years of deficient rain in Punjab between 1901 and 2017 (117 years) out of which 10 years of deficient rain were recorded between 2000 and 2019 itself, which means 29 per cent deficient rainfall years in just 17 per cent of over a century. | ||
| + | |||
| + | ''' Why despite below normal rain, is this monsoon being considered good by weather experts? ''' | ||
| + | |||
| + | Dr Prabhjyot Kaur Sidhu, head of the Department for Climate Change and Agricultural Meteorology, Punjab Agriculture University (PAU), Ludhiana, said: “During this monsoon we witnessed a good pattern of rainfall. For instance, if 100 mm rainfall was witnessed in an area then it rained in 8-10 hours, while in the recent years, we had witnessed that 100 to 110 mm rain in just one or two hours which was just a waste of precious rainwater and that pattern was creating flash floods, which was bad for ground water recharging too.” | ||
| + | |||
| + | “If good amount of rain is falling continuously for longer period — 10 to 12 hours — then it is a boon for groundwater recharging because this rain water then seeps into the ground completely and does not accumulate on the surface and thus helps in water recharging,” she said, adding that such monsoons used to occur long ago when light to moderate rains used to take place continuously for days together. | ||
| + | |||
| + | “In Ludhiana we witnessed around 100 mm rainfall thrice this monsoon and every time, this amount of rainfall was recorded during an 8 to 10 hours duration instead one to two hours,” she added. | ||
| + | |||
| + | She also said that this monsoon was quite peculiar because it was advanced by two weeks and then there was a rain break for two weeks in July and August, while in September it rained again and surplus rain was recorded, after which the monsoon finally withdrew in October, while usually, monsoon withdraws by September-end in the state. | ||
| + | |||
| + | ''' What are the factors driving the below normal rain trend? ''' | ||
| + | |||
| + | Dr Prabhjyot said there are several factors and they are not Punjab-specific but a global phenomenon due to which erratic weather changes are occurring, for which a collective approach is required to minimise the effect of global warming to control extreme weather variables. | ||
| + | |||
| + | Experts said deforestation in the state is also one of the causes of the decreasing rainfall trend. | ||
| + | |||
| + | [[Category:Climate/Meteorology|R RAINFALL: INDIARAINFALL: INDIARAINFALL: INDIARAINFALL: INDIA | ||
| + | RAINFALL: INDIA]] | ||
| + | [[Category:India|R RAINFALL: INDIARAINFALL: INDIARAINFALL: INDIARAINFALL: INDIA | ||
| + | RAINFALL: INDIA]] | ||
| + | [[Category:Pages with broken file links|RAINFALL: INDIARAINFALL: INDIARAINFALL: INDIARAINFALL: INDIARAINFALL: INDIA | ||
| + | RAINFALL: INDIA]] | ||
| + | |||
| + | =See also= | ||
| + | [[Agriculture: India]] | ||
| + | |||
| + | [[Climate change: India]] | ||
| + | |||
| + | [[India Meteorological Department]] | ||
| + | |||
| + | [[Monsoons: India]] | ||
| + | |||
| + | [[Mumbai: local rains]] | ||
| + | |||
| + | [[Rainfall: India and Burma, 1907-12]] | ||
| + | |||
| + | [[Rainfall: India]] | ||
| + | |||
| + | [[Weather forecasts: India]] | ||
| + | |||
| + | [[Winter rains: India]] | ||
| + | |||
| + | [[May weather in India]] <> | ||
| − | + | [[June weather in India]] <> | |
| − | + | [[July weather in India]] <> | |
| − | + | [[August weather in India]] <> | |
| − | + | ||
| − | + | [[September weather in India]] <> | |
| + | ==...and also== | ||
| + | [[January weather in India]] <>[[ February weather in India]] <> [[March weather in India]] <> [[April weather in India]] <> [[May weather in India]] <> [[June weather in India]] <> [[Summers: India]]<> [[July weather in India]] <> [[August weather in India]] <> [[September weather in India]] <> [[Monsoons: India]]<> [[October weather in India]] <> [[November weather in India]] <> [[December weather in India]] <> [[Winter rains: India]] <> [[Winters: India]]<> [[Rainfall: India]] | ||
| − | + | [[Category:Climate/Meteorology|R RAINFALL: INDIARAINFALL: INDIARAINFALL: INDIARAINFALL: INDIA | |
| + | RAINFALL: INDIA]] | ||
| + | [[Category:India|R RAINFALL: INDIARAINFALL: INDIARAINFALL: INDIARAINFALL: INDIA | ||
| + | RAINFALL: INDIA]] | ||
| + | [[Category:Pages with broken file links|RAINFALL: INDIARAINFALL: INDIARAINFALL: INDIARAINFALL: INDIARAINFALL: INDIA | ||
| + | RAINFALL: INDIA]] | ||
Latest revision as of 18:22, 18 August 2023
This is a collection of articles archived for the excellence of their content. |
[edit] Definitions
Rainfall is classified as
Very light rain: Rainfall up to 2.4mm
‘light’ when it is between 2.5 and 15.5mm,
‘moderate’ when it is between 15.6 and 64.4mm, and
‘heavy’ when it is above 64.5mm
in a single day.
[edit] Rainfall over the years

From: April 17, 2022: The Times of India
[edit] Annual mean rainfall in India
[edit] 1961-2020
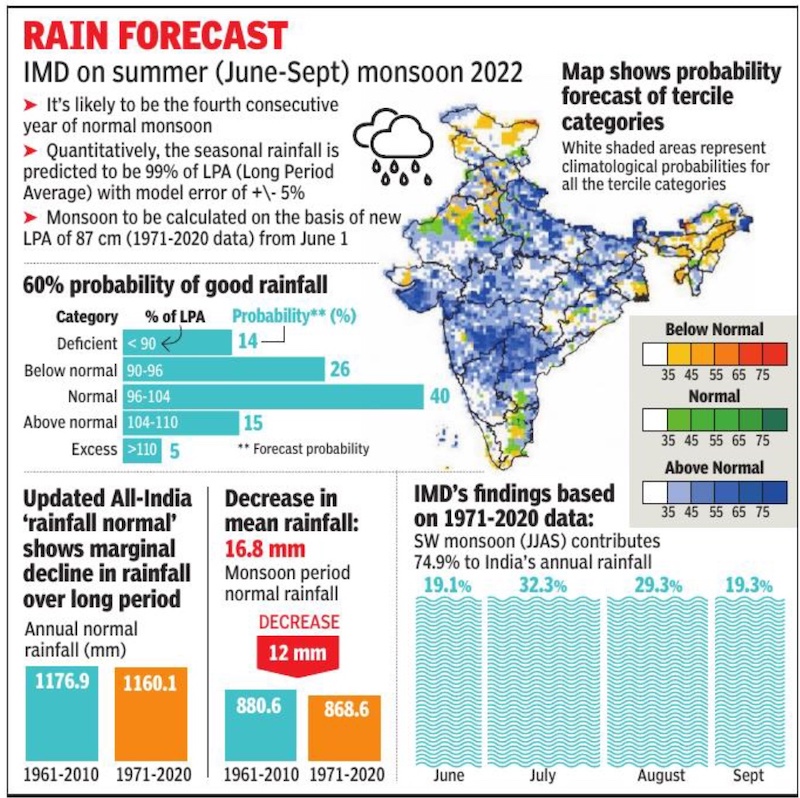
Monsoon period Mean rainfall, 1961- 2020
From: Vishwa Mohan, April 15, 2022: The Times of India
See graphic:
Annual mean rainfall in India, 1961-2020
Monsoon period Mean rainfall, 1961- 2020
[edit] 1971-2022
Priyangi Agarwal, September 7, 2022: The Times of India

From: Priyangi Agarwal, September 7, 2022: The Times of India
New Delhi : The India Meteorological Department (IMD) has revised its ‘normal’ rainfall mark this year, which will be based on the long-period average of the past 50 years (1971-2020). The previous normal was based on the long-period average of 1961-2010.
While the period between July and January saw a decrease in the normal mark for rainfall, the period between February and June witnessed a slight rise. The major difference in normal rainfall was of nearly 15mm in August.
IMD calculates ‘excess’ or ‘deficit’ rainfall on the basis of ‘normal’. For instance, Safdarjung, the city’s base station, logged 286. 3mm rainfall in July this year as against the revised normal of 209. 7mm and hence, the month ended with an excess of 67%. The previous normal for July was 210. 6mm.
“Long-period average is revised once in a decade. The revised normal came into force at Safdarjung this June and it will continue for this decade,” said a Met official said.
The official added, “The months which received more rainfall in 2011-2020 saw an increase in normal range. However, months which recorded less rainfall during the same period witnessed a drop in the normal mark. ”
According to IMD, August saw the highest difference in the previous and current normal benchmark. As the normal onset of monsoon date is June 27 and the monsoon usually arrives in the capital in July and withdraws in September, August, on an average, reports the highest number of rainy days. Safdarjung was able to surpass the average mark only twice in the past 10 years. It recorded excess rainfall of 321. 4 and 378. 8mm rainfall in 2013 and 2012, respectively. The city has been recording a rain deficit in August since 2014.
However, as the month failed to meet its normal rangeeight times between 2011 and 2020, the normal in August decreased from 247. 7mm to 233. 2mm. “Earlier, August used to witness rainy day after every second day,” said a Met official. In contrast, May saw a rise in normal range of 11mm. While the previous normal was 19. 7mm, the current normal is 30. 7mm. IMD data shows that May has been mostly recording excess rainfall. The city saw excess rainfall of 142% and 636% in May in 2022 and 2021, respectively. October’s normal range has a difference of 12. 9mm while July witnessed little change in the normal mark of about 1mm.
[edit] Records
[edit] 24 hour rainfall, 1876-2005

See graphic, All-time records of the highest 24 hour rainfall in India and the world, till 2005
[edit] Updated to 2022
Single day
1563.3mm of rainfall Cherrapunjee’s wettest day June 16, 1995 (The Times of India )
1003.6mm of rain in 24 hours: Mawsynram/ 2022, 16-17 June (from 8. 30am on 16th to 8. 30am 17th) (The Times of India )
945.4mm Mawsynram’s previous highest 24-hour rainfall on June 7, 1966 (The Times of India )
972mm Cherrapunjee, its third highest single-day rainfall / 2022, 16-17 June (from 8. 30am on 16th to 8. 30am 17th) (The Times of India )
Two-day (48-hour) rainfall
2,493mm at Cherrapunjee recorded on June 15-16m, 1995 (The Times of India )
[edit] Highest annual rainfall

The period for which this data holds good has not been mentioned . Therefore, we assume that it pertains to the years 1875 1982
From: Rakhecha, PR, and Pisharoty, PR, Heavy rainfall during monsoon season: Point and spatial distribution, Current Science, Volume 71, No. 3, 10 August 1996
See graphic, Highest annual rainfall
[edit] Highest amount of rainfall in one hour

The period for which this data holds good has not been mentioned . Therefore, we assume that it pertains to the years 1875 1982
From: Rakhecha, PR, and Pisharoty, PR, Heavy rainfall during monsoon season: Point and spatial distribution, Current Science, Volume 71, No. 3, 10 August 1996
See graphic, Highest amount of rainfall in one hour
[edit] Highest rainfall in 1 day, 2 days, 3 days
See graphic, Highest recorded rainfall in a single day, over two days and over three days, 1875 -1982.
[edit] 2019: Mahabaleshwar tops
In individual years different places sometimes hold the all-India and world records.
From TNN/ Neha Madaan, Mahabaleshwar gets 7,000mm rain, is wettest spot on earth/ Sep 6, 2019
June 1 to September 4 2019:
Mahabaleshwar received 7,175.4mm rain
Patharpunj in Patan taluka in Satara also recorded 7,000mm rainfall during the 2019 monsoon
Mawsynram 6,218.4mm [Its normal June-August rainfall is over 8,233.5mm]
Cherrapunji 6,082.7mm
June 1 to September 5, 2019: Mahabaleshwar received 7,369.4mm.
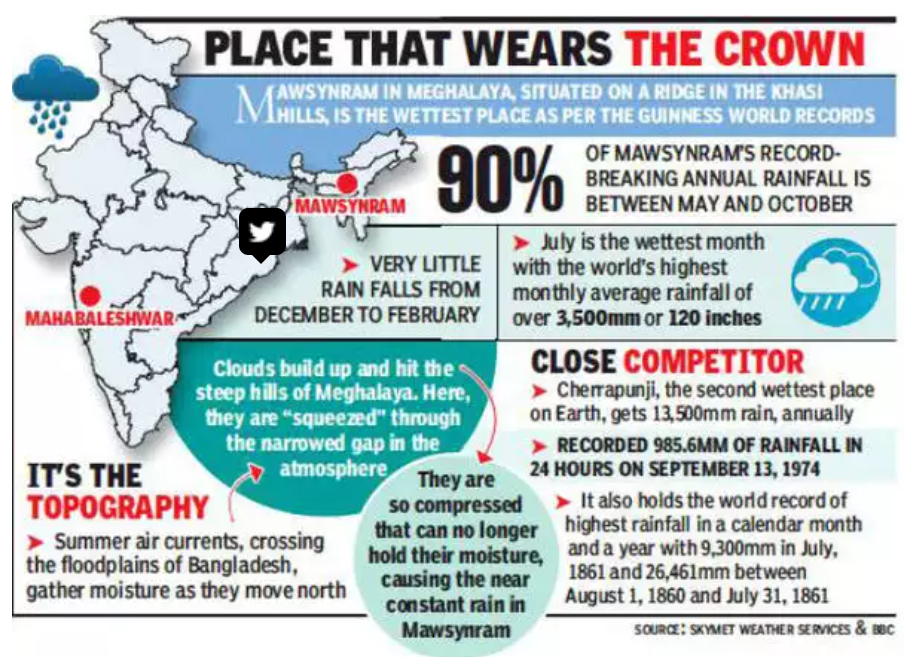
From / TNN/ Neha Madaan, Mahabaleshwar gets 7,000mm rain, is wettest spot on earth/ Sep 6, 2019
Pulak Guhathakurta, head of the climate application and user interface, Climate Research and Services, IMD Pune, said, “Mahabaleshwar is the only station in Madhya Maharashtra that normally receives very high rain during the monsoon because of its orography. It has a unique geographical location in the rain-battered region of the Western Ghats.”
Torrential rains in Mawsynram and Cherrapunji are common. Both are located in a funnelshaped region formed by the Khasi, Garo and Jaintia hills.
The two locations, 81km apart, receive rain from the Bay of Bengal branch. The clouds travel over the plains of Bangladesh for hundreds of kilometres and collide with the Khasi hills.
“The hills have numerous deep valleys and channels. Strong winds push these clouds through the deep valleys and lift them up. The upward motion helps water vapour condense, increasing the moisture content in the winds. When these winds saturated with moisture collide with the Khasi hills, extremely heavy rain occurs over the windward side, where Mawsynram and Cherrapunji are located,” Guhathakurta said.
[edit] State-wise, season-wise
[edit] 1951-2000
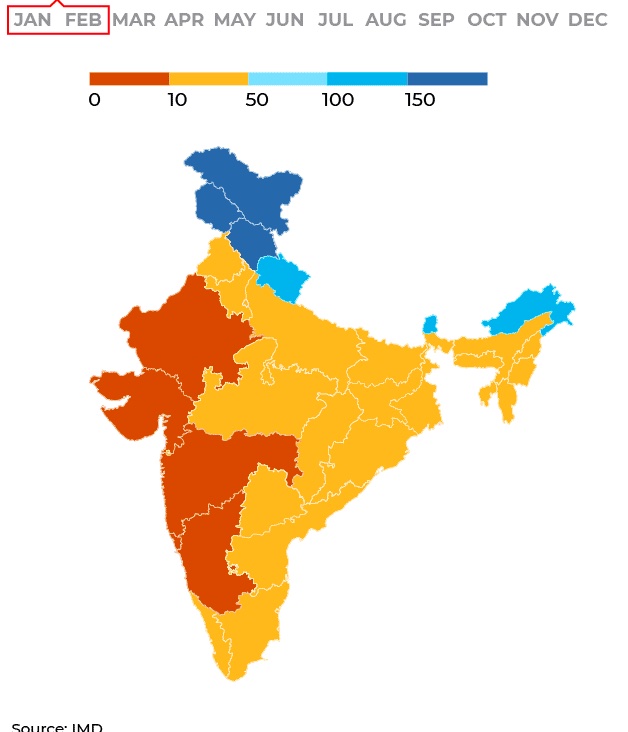
From: Sudha Nambudiri, May 18, 2021: The Times of India
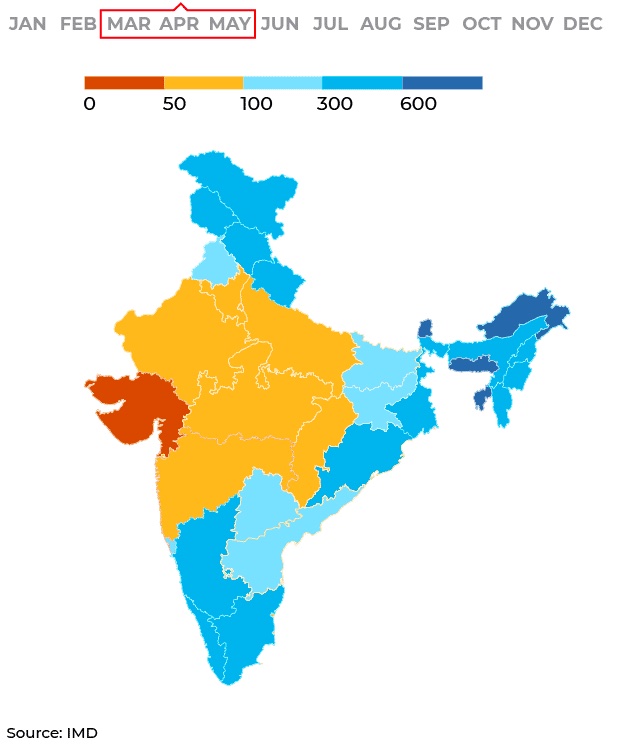
From: Sudha Nambudiri, May 18, 2021: The Times of India
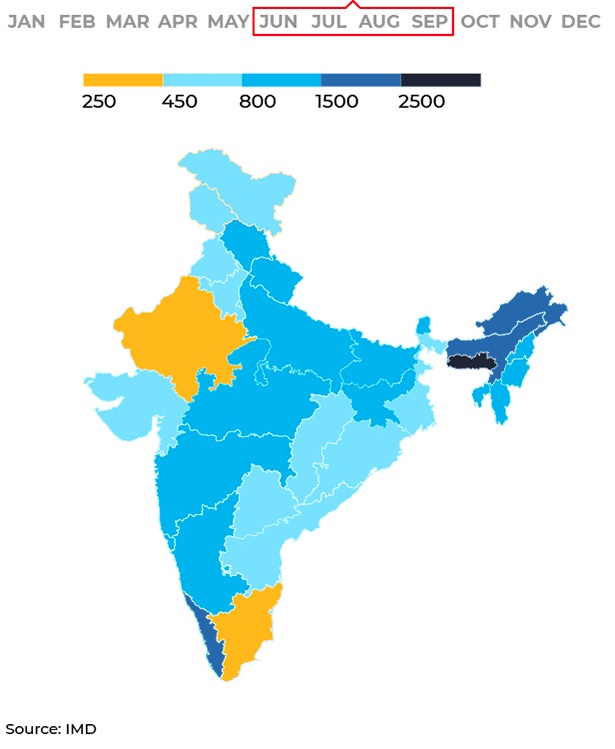
From: Sudha Nambudiri, May 18, 2021: The Times of India
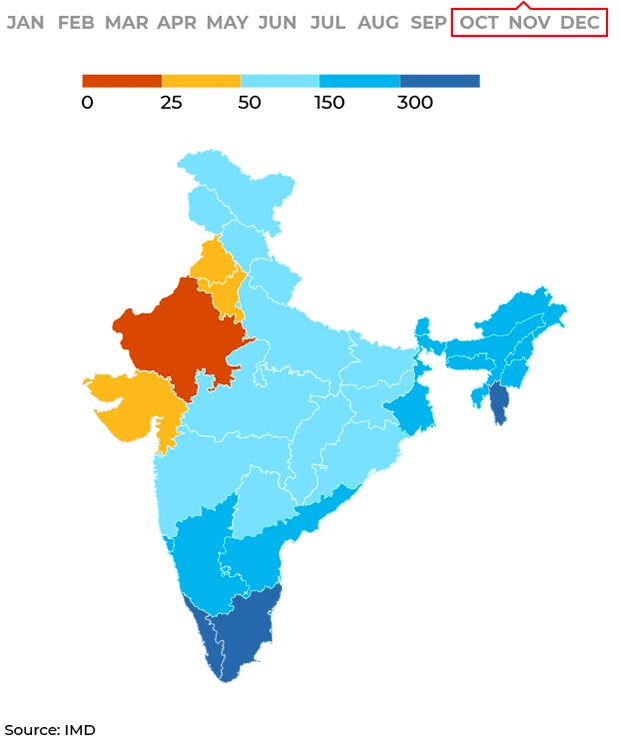
From: Sudha Nambudiri, May 18, 2021: The Times of India
See graphics:
The normal rainfall in the states, 1951-2000 : winter
The normal rainfall in the states, 1951-2000 : pre-monsoon
The normal rainfall in the states, 1951-2000 : monsoon
The normal rainfall in the states, 1951-2000 : post- monsoon
[edit] La Nina years
[edit] 1971-2010
See graphic, ' Rainfall % of average, September and June July during La Nina years: 1971-2010 '
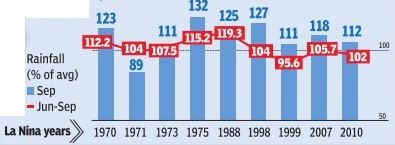
[edit] Drop in rainfall
[edit] 1989-2019: 7 states saw a drop
7 states saw drop in rainfall in last 30 yrs, March 9, 2020: The Times of India
India Also Saw More ‘Dry Days’: Govt Report
Seven states — Uttar Pradesh, Bihar, West Bengal, Himachal Pradesh, Arunachal Pradesh, Meghalaya and Nagaland — have shown “significant decreasing trends” in annual rainfall in the last 30 years and many parts of the country witnessed increase in number of “dry days” during the monsoon season which adversely affected groundwater recharges in these regions.
These are some of the key findings of a report, ‘Observed Rainfall Variability and Changes’, which was shared by the ministry of earth sciences (MoES) with a parliamentary panel in response to the latter’s queries on changing rainfall patterns in the context of its impact on agriculture. The ministry analysed rainfall pattern over 28 states and the Union Territory of J&K based on data of the last 30 years.
The report said the situation for agriculture or water recharge in certain states in the Ganga river basin (UP, Bihar and West Bengal), Delhi and some southern states was “alarming”, as the number of dry days (daily rainfall of 2.5 mm or less) during the south-west monsoon was “significantly increasing”.
MoES secretary Madhavan Rajeevan said, “It could be attributed to climate change. Global warming is happening and it has impacted the climate in India as well. As a result, many parts of the country have seen decreasing trends while others witnessed increasing trends.”
“Such a study may help farmers plan their agricultural activities and conserve/utilise available water resources,” Rajeevan said. The parliamentary standing committee on science & technology and environment, headed by Congress’s Jairam Ramesh, submitted its report to Parliament.
“Five states, viz Bihar, Meghalaya, Nagaland, West Bengal and Uttar Pradesh, have shown statistically significant decreasing trends in south-west monsoon rainfall. These five states, along with two more states — Arunachal Pradesh and Himachal Pradesh — have also shown statistically significant decreasing trends in annual rainfall,” the report said. The report said the frequency of rainfall of lower intensity, favourable for soil and ground water recharge, was decreasing in these regions. Overall, there was significant changes in the frequency of dry days, rainy days and heavy rainfall events in different parts of the country.
[edit] Low rainfall years
[edit] 2015, 2009
The Times of India, Oct 01 2015
Neha Madaan
Monsoon ends with lowest rainfall in 6 yrs
The monsoon season ended on Wednesday with a 14% deficit, making it the weakest monsoon since 2009.In terms of average countrywide rainfall during the season (June-September), this year was the third lowest since 1979, the other acutely deficient year being 2002. The country received 760.6mm rainfall during the June-September monsoon season as against the normal 887.5 mm, which is less than last year's monsoon performance of 781.7mm. With this, the country has seen two backto-back droughts, the first since 1986-1987.
In September, despite a few late spells of rain in several parts of the country including deficit regions such as central Maharashtra, Marathwada, south peninsula and northwest India, the total rainfall was the lowest since 2005. The country received 131.4mm rainfall in September this year, 24% less than the normal and the lowest in the past 11 September months. In 2002 and 2009, the two worst drought years the country experienced in recent decades, the rainfall deficiency stood at 19.2% and 21.8%, respectively . The India Meteorological Department has, however, discontinued using the term “drought“ because it believes an entire country never faces a drought.
[edit] Drought years
[edit] 2002-15
See graphic, '2002-15: years when India was affected by drought '
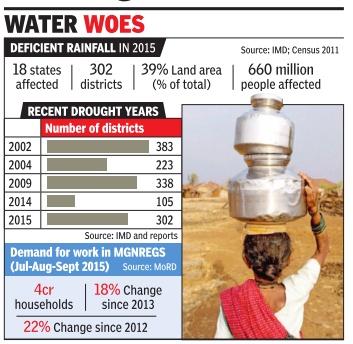
[edit] 2015: 302 of 614 districts drought affected, highest since 2009
The Times of India, Oct 03 2015
Subodh Varma
302 of 614 districts reeling under drought, highest since 2009
There is more to this year's rainfall deficit than meets the eye. After the monsoon was officially declared over on September 30, 17 of the country's 36 weather subdivisions had received deficient or scanty rainfall. That's about 39% of the country's area, home to over 66 crore people, nearly half the country's population. Deficient is when rains are below the average by 20% or more while scanty is when it's below 50%.
Deficient or scanty rains have affected people in 302 districts out of 614 that have sent in their rainfall data to the Indian Meteorological Department (IMD). Details of some 27 districts mainly are yet to come in. Eighteen out of 36 states and union territories are affected. Some of the top grain producing states like Punjab, Haryana, UP , MP and Bihar are part of this belt.These are also areas of high population density , and high dependence on agriculture.Considering the gigantic scales involved in this drought, it is surprising that not much alarm or preparation is visible at the policy makers' level.
The last time a drought of this scale was witnessed was in 2009 when 338 districts were affected. In 2002, 383 districts were drought stricken. In 2014 the number of districts affected by deficient rains was 105.
There are other worrying indicators also. In the 91 big reservoirs in the country , current water storage is 61% of their total live storage capacity, according to the latest data from the Central Water Commission (CWC). This is significantly lower than the 10-year average of 77% storage. In the southern region live storage is just 34% of capacity compared to average 81% for the last decade. In the coming days when this reservoir stored water will need to be used for irrigation, power generation and drinking, this shortage will come into play . It will also mean additional pressure on an already overdrawn ground water reserves.
Food grain stocks were 509 lakh metric tons (LMT) on September 1 this year, lower by 15% over the 602 LMT stock last year. This is not because of the monsoon but probably due to the 4.7% dip in grain production last year and only a nominal increase in the minimum support price offered by the government to the farmers. But low stocks is worrying because this is what is going to be consumed till the kharif harvest comes in.
So, what about the kharif crop that was sown in this monsoon? According to the first advance estimates by the government, the hope is that kharif production will be 124 million tons. This is mainly rice, pulses and coarse grains.Last year, kharif production was 126.3 million tons. So that's a shortfall of 2%.
But experts say that these first estimates are based on sowing of crops. How the standing crop fared in its life is what determines how much food grain it provides. It is here that the current drought's peculiarities will matter.
In June this year, rainfall was 16% higher than the long period average. This led to hopes of a good monsoon.So, sowing was done vigorously.But then the rainfall plummeted.
[edit] MONTH-WISE
[edit] March to mid- May
[edit] Delhi
[edit] 2011-22
See graphic, Rainfall in Delhi, March to mid- May, 2011-22
[edit] June-July
[edit] 2013: wettest in country in 19 years
The Times of India 2013/08/02
The June- July 2013 rainfall, which has been 117 % of the long period average [LPA] is the highest the country has seen since 1994. The last time there was more rain during this two-month period was in 1994, when the monsoon was 123% of the average. The 528.1mm rain bounty that the country got in the first half of the monsoon season is the third highest in 50 years. The wettest June-July spell during this period was in 1994 (564.7mm) while the second wettest was 1964 (538.1mm). Another interesting feature of this year’s rains has been the absence of a break in the monsoon ever since it covered the entire country in June 16.
[edit] Jun-Jul 2013: With 460mm rain, Delhi’s wettest in 10 years
Amit Bhattacharya TNN
The Times of India 2013/08/04
New Delhi: The first two months of the monsoon season have been wettest in the capital in the past 10 years. Delhi’s June-July rain tally stood at 460mm, 67% above normal, which is the second highest of this century after 2003.
The city’s rain aggregate got a huge boost in the second half of July. According to figures provided by the Regional Meteorological Centre, the capital got 238.9mm of rain during July 16-31, which is more than the average for the entire month.
There were 10 rainy days during this period, including the season’s wettest day (July 21), when 123.4mm came down on the city. This late surge lifted July’s rain tally to 340.5mm, 62% higher than the month’s average rainfall of 210.6mm. Since 1990, there have been only three years when the city has got more rain in June-July than this year. Apart from 2003, the other bountiful years were 1994 and 1993.
While the rain gods have been kind to Delhi, in neighbouring Haryana it’s been a different story. The meteorological district comprising Haryana, Delhi and Chandigarh is the only one in north India where rains have been deficient so far. That’s mainly because of poor rainfall in Haryana.
[edit] June- August rainfall
[edit] 2014-18
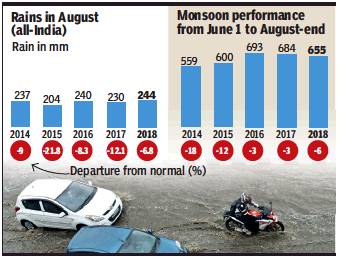
From: Neha Madaan, For India, it’s the rainiest August in five years, September 2, 2018: The Times of India
This August, India recorded the best monsoon for the month in last five years despite a 6.4% shortfall in showers in comparsion to the normal range.
The -6.4% departure is the least deficit recorded in August since 2014 – a drought year. Since 2014, the country saw departures from -8% to -21%. This year, however, all the subdivisions, except south peninsula, ended up with less than average rain in August 2018, but India fared better than all the years since 2014.
An IMD official said August had no break-like conditions this year, unlike last year and 2016. In 2017, breaklike conditions prevailed during the first week of July and on several days during the first fortnight of August. In 2017, August 3 and 4, and August 11 to 13 depicted typical monsoon-break conditions. This made August 2017 end up at a -12.1% departure from normal.
In 2016, rainfall activity was very less in June, second part of July and August, as well as in the beginning of September. Though rainfall activity was good in the beginning of July and August, the monthly rainfall in August 2016 ended with a -8.3% departure from normal.
In 2015 rainfall activity over India in August was very subdued. Except for some meteorological subdivisions of central, peninsular and extreme northeastern region, most of the subdivisions received deficient or scanty rainfall.
A K Srivastava, head of climate monitoring at IMD, Pune, said 2014 and 2015 were El Nino years, resulting in below-normal rain. “Typically, August experiences a break situation in the second or third week in most years. This year, monsoon was very active during August, so much so that it caused a deluge in Kerala. An upper air anti-cyclone in August over NE ensured westward movement of monsoon systems, causing good rainfall,” he said.
[edit] July
[edit] The driest Julys
[edit] 1980-2015
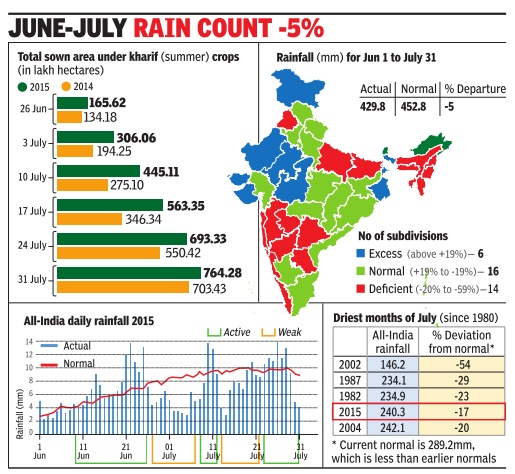
ii) The driest Julys between 1980-2015; Graphic courtesy: The Times of India, Aug 02 2015
See graphic:
Total sown area under kharif crops 2014 and 2015…
[edit] 2015: July

See graphic, ' Rains in July 2015 '
[edit] August
[edit] 2009, 2021: low rainfall
Neha Madaan, Sep 2, 2021: The Times of India
The 196.2mm rain in August was the lowest recorded in India after the deficient monsoon in 2009 in a 12-year period, reports Neha Madaan. The rainfall, with a deficit of 24.1%, was below the 258mm mark that is normal for this month. August rains over the past decade have been over 200mm.
IMD data from 2010 for August show that the country received over 300mm rain, the highest, in 2020 and 192.5mm, the lowest, in 2009. IMD director general Mrutyunjay Mohapatra told TOIthat the negative Indian Ocean Dipole (IOD) was among the reasons for the below normal rain for August this year. “A negative IOD is unfavourable for the Indian monsoon. Monsoon depressions were absent,” he said. Weather activity over northwest Pacific, where the maximum number of depressions and cyclones form in August, also affected rainfall in this month in India.
[edit] ‘Heavy rainfall;’ extremely- and very-
[edit] 2017 >2019
Vishwa Mohan, September 17, 2020: The Times of India
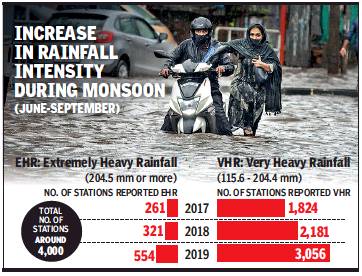
From: Vishwa Mohan, September 17, 2020: The Times of India
The number of rain gauge stations recording ‘extremely heavy rainfall’ in the country has increased by more than 100% in the past three years — from 261 in 2017 to 554 in 2019 – while the ones which recorded ‘very heavy rainfall’ increased by over 67% during the same period.
The IMD’s data for the past three years, shared by Union minister of earth sciences Harsh Vardhan in Rajya Sabha on Tuesday, shows a similar trend for number of cyclones in Arabian Sea and Bay of Bengal. Collectively, the number of cyclones increased from three in 2017 to eight in 2019.
Though it’s not a longterm trend as there are many years in the past that have recorded a decrease in the number of extreme weather events, the three years’ events could lead to “unexpected increase in natural disasters” during the 2017-19 period. Attributing the reasons to climate change, IMD chief Mrutyunjay Mohapatra told TOI on Wednesday that it’s an established fact that ‘extremely heavy rainfall’ has been increasing in tropical regions, including India.
“This trend is, however, not meant for the entire country. If you look at our analysis of rainfall patterns based on the data of the last 30 years, you will find that there are states which have witnessed significant decreasing trends of annual rainfall,” he said. On Wednesday, the minister pitched for a robust climate risk management framework for India to determine the impact of various climate change risks over the country.
[edit] 2017> 21
Vishwa Mohan, Sep 2, 2021: The Times of India
The overall quantitative rainfall in India might not have increased but the number of stations recording ‘very heavy’ and ‘extremely heavy’ rainfall within limited period is increasing, said IMD chief M Mohapatra on Wednesday while underlining why this changing aspect of the monsoon makes it all the more important to go for rainwater conservation in a big way.
He noted that the skewed distribution may affect farming operations unless there are enough efforts to save rainwater to support agriculture in the deficit period or break phase of the monsoon.
The data show the number of stations recording very heavy (115.6 to 204.5 mm) rainfall in August increased from 401 in 2017 to 510 in 2018, 987 in 2019 and 1008 in 2020. Similarly, the number of stations recording extremely heavy (over 204.5 mm) rainfall, also in the month of August, increased from 90 in 2017 to 165 last year without actually affecting the overall quantity of rainfall during the entire monsoon period. It means the remaining months of the monsoon season had seen much less rainfall.
Though the year 2021 has not seen this trend in August, spatial distribution of the rainfall was highly skewed during the first three months of the monsoon season with northwest India, Gujarat and parts of Odisha facing limited rainfall.
The depressed rainfall in northwest India may, however, marginally affect the ongoing sowing operation as the region, having good irrigation facilities, doesn’t depend on rainfed agriculture. Overall, the acreage in the country as a whole will be above normal due to good distribution of rainfall, at least, over rainfed areas of Maharashtra, UP and MP.
The overall acreage of Kharif crops (paddy, sugarcane, cotton, oilseeds and coarse cereals) may not cross the last year’s figure of record acreage, but it’ll certainly be above ‘normal’ sown area (average of last five years) of 1073 lakh hectares (LH). Records show that overall acreage as on last Friday had already reached 1064 LH which was 34 LH more than the ‘normal’ acreage (1030 LH) of corresponding period.
[edit] Rainfall and the kharif crop
[edit] 2003-11
See graphic:
The linkage between rainfall and the kharif crop, 2003-11
[edit] REGIONAL VARIATIONS
[edit] Some of India's rainiest places
See graphic, ' Some of India's rainiest places '
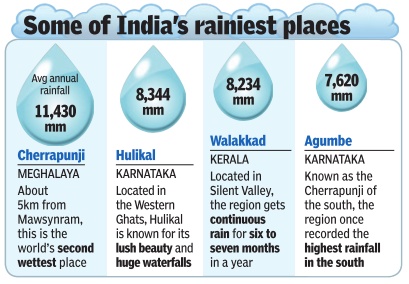
[edit] Delhi
[edit] 1910-2022: the wettest Octobers
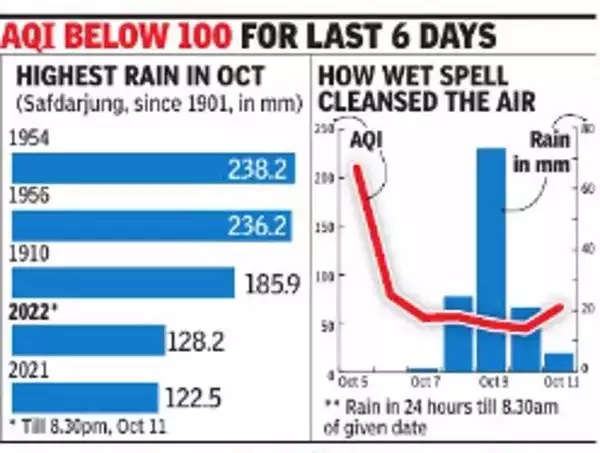
From: Kushagra Dixit, Oct 12, 2022: The Times of India
See graphic:
Delhi, the wettest Octobers, 1910-2022
[edit] 2011 - 20: Rainfall recorded at Safdarjung
Regular rain prevented any big rise in mercury, making it the coolest July since 2016. The mean maximum temperature recorded this July was 34.7 degrees Celsius against the normal average of 35.6 degrees Celsius. The last time the city recorded a lower maxi mum temperature in July was in 2016 at 34.5 degrees Celsius.
[edit] June to September
[edit] 2011-23
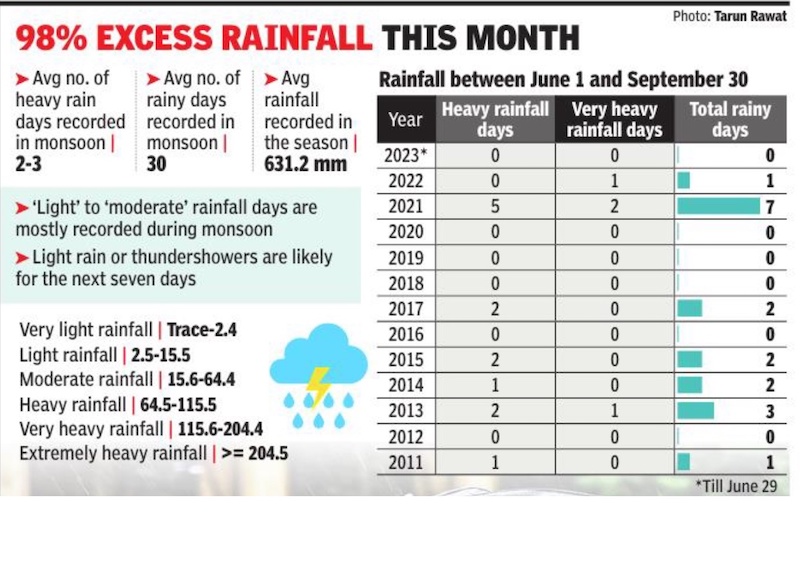
From: Priyangi Agarwal, June 30, 2023: The Times of India
See graphic:
Rainfall in Delhi June to September, 2011 – 23
[edit] Annual average normal rainfall
The annual average normal rainfall mark for Safdarjung from January to December is 779 mm
The normal rainfall during July is 210.6 mm at Safdarjung Observatory.
[edit] 2018-2021
2018: the city had crossed the annual average normal mark with 816.mm rainfall.
2019, 2020 According to IMD, the annual average rainfall recorded was below the normal mark. Safdarjung station received 613 mm rainfall in 2019 and 765.4 mm rainfall in 2020 against the normal mark of 779 mm.
2021: The city received 780.7 mm rainfall till 1 August morning while, according to India Meteorological Department (IMD). Of the total rain, 507.1 mm rainfall was recorded solely in July.
Kuldeep Srivastava, scientist at IMD and head of Regional Weather Forecasting Centre, said, “Delhi’s base station Safdarjung crossed the annual average normal rainfall mark on August 1, with five months still left to the year. After the onset of the monsoon, the city has been receiving rain on most days. July recorded 16 rainy days, including three heavy rain days. As August usually witnesses heavy rain days too, the annual rainfall recorded this year is expected to be higher.”
The actual rainfall was nearly 141% above normal than the long-period average. Apart from July, May also recorded excess rain than the average mark. The city received 144.8 mm rainfall in May, while January, February, March, April and June recorded deficit rainfall.
[edit] June- Aug (average); 2018 (actual)
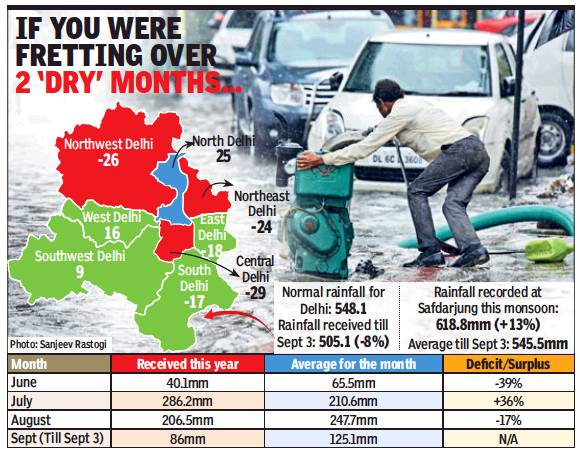
June- Aug (average); 2018 (actual)
From: Jasjeev Gandhiok, Hat-trick of rainy days in Sept helps erase deficit of 2 months, September 4, 2018: The Times of India
The capital saw two rainfall deficit months during this monsoon, but the first three days of September seem to be making up for it — Delhi now has a 13% rainfall ‘surplus’.
A Met official said that after recording a deficit of 39% in June and 17% in August, Delhi, as per the measurements by the Safdarjung observatory, has now received 618.8mm of rain in the monsoon season so far as compared to the usual average of 545.5mm.
Although the Safdarjung observatory is considered the base both in terms of rainfall and temperatures, the Met office said the overall rainfall distribution across all districts in Delhi still showed a deficit of 8% at 505.1mm as compared with the average of 548.1mm. “Central, northwest and northeast Delhi are all in the deficient zone right now, while northern Delhi has recorded a large excess. The other parts like south and southwest Delhi are close to the average,” said a Met official.
According to the India Meteorological Department (IMD), with moderate showers, September is on track to cross its monthly average of 125.1mm in this first week itself, recording around 86mm of rainfall till 8.30am on Monday. “The average for Delhi in September is around 125mm. With more rain forecast for this week, the capital could record a good surplus during this period,” said the Met official.
According to IMD data, Delhi’s Safdarjung observatory recorded just 40.1mm rain in June as compared to a monthly average of 65.5mm. However, July saw a surplus of 36% with 286.2mm rain. The monthly average for July is 210.6mm.
“But August once again had a rainfall deficit of around 17% with just 206.5mm rain recorded as compared to a normal of 247.7mm for Safdarjung. Late rainfall activities in the last week of August improved this figure. However, September so far has been extremely good for Delhi,” said an official.
On August 28, Gurgaon received the heaviest rainfall in eight years, and Delhi has seen moderate showers over the past three days. The forecast for this week shows that light-to-moderate showers are likely to continue over the entire national capital region (NCR). Rainfall is largely considered ‘deficient’ if it is under 19% of the normal, while ‘excess’ rainfall is recorded if it’s above 19%.
“Conditions right now are ideal for more rain not just over Delhi but adjoining places, too. We expect this activity to continue for at least the next three to four days,” said an official.
[edit] 2018, Sept 1-10: longest wet spell since 1988
Amit Bhattacharya, September 11, 2018: The Times of India
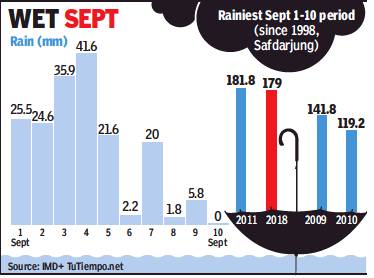
From: Amit Bhattacharya, September 11, 2018: The Times of India
The capital witnessed its longest wet spell in the month of September in 22 years, with rain being recorded in nine consecutive days from the first till the ninth of the month. Safdarjung, Delhi’s main weather station, registered 179mm of rain during these nine days, nearly 40% more than the normal for the entire month.
This was also the wettest start to September — counting the first 10 days of the month — in seven years and the second wettest in the last 22 years, according to rainfall data from IMD and the TuTiempo website.
In fact, it rained continuously in the capital from August 27 till September 9, as per Safdarjung weather station records, barring just a single day — August 31.
The next few days, however, are expected to be relatively dry in the city.
9 days of continuous rain in Sept unusual for Delhi
Safdarjung recorded as much as 259mm of rain in this 14-day period, more than what the city normally receives during the entire period of its wettest month of August. Normal August rainfall in Delhi is 247.7 mm.
“It is highly unusual for the city to record nine straight days of rainfall, particularly in September. The spell was caused by steady incursion of moisture into the region because of a persisting cyclonic circulation over Uttar Pradesh and Haryana that led to the monsoon trough staying close to the capital,” said B P Yadav, head of IMD’s regional meteorological centre.
This peculiar atmospheric condition led to long spells of rain in a relatively small area adjoining south Haryana and UP, the official said.
The monsoon trough, a typical feature of the monsoon season, is an east-west line of atmospheric low pressure that divides two regions of differing air flows. It usually moves in a northsouth direction, shuttling between the Himalayan foothills and the central Indian plateau. But during this period, officials said, the trough stayed mostly just north or south of the national capital, creating perfect conditions for rainfall over the area.
It was in 2011 that the capital last saw a wetter start to September. Then, the cumulative rainfall in the first 10 days of the month was just marginally more than this year, at 181.8mm. Going back further, such heavy rainfall in the beginning of September was last seen in the capital way back in 1995, when 179.3mm was recorded in the first 10 days of the month.
As for most consecutive rainy days in September, 2011 too saw a nine-day wet spell like this year. A longer spell was last witnessed in 1995, when 11 straight days of rain took place from September 3 to 13, as per the weather archives website, TuTiempo.net.
[edit] Gurgaon/ Gurugram
[edit] Rainfall records, 2008- 2018

See graphic, ' Gurgaon’s rainfall records, 2008- 2018 '
[edit] Karnataka
[edit] 2000-18: 11 drought years, 2 flood years
May 6, 2019: The Times of India
Drought, floods new normal as Karnataka rain pattern changes
BENGALURU: Karnataka has been witnessing a drastic change in rainfall pattern and distribution over the past two decades, resulting in frequent drought, floods and untimely rain.
According to a study by the Karnataka State Natural Disaster Monitoring Centre (KSNDMC), north Karnataka and coastal areas have been g a declining trend in rainfall, besides a very high fluctuation in rain distribution. The state has reeled under 11 years of drought and two years of floods since 2000.
A good example of this was 2018 when the state had to deal with floods and drought. “Karnataka is perhaps the only state in the country to be declared both drought- and flood-hit in the same year. It’s mainly because of drastic change in rainfall distribution,” said GS Srinivas Reddy, director, KSNDMC.
While most districts of north Karnataka and south- interior Karnataka faced drought in 2018, Kodagu, Chikkamagaluru, Dakshina Kannada and Udupi districts and parts of Shivamogga were hit by floods and incessant rain. In fact, Kodagu and parts of Chikkamagaluru bore the brunt of rain fury.
Reddy said drought and floods were occurring not because there’s a drastic decline or increase in rainfall. As per analysis of data since 1991, there’s been an average decline of just 2.5mm of rain during the southwest monsoon and 4.2mm in the northeast monsoon. A 4mm decrease in rain is equal to loss of 1 tmcft of water, which is insignificant compared to the state’s annual rain yield.
In a year, Karnataka receives 1,135mm of rain and the south-west monsoon accounts for 73% of it. Since 2011, the state has received an average rainfall of 1,033 mm, that’s 10% less than normal.
Even north-interior Karnataka received good rainfall with an average of 593mm against the annual rainfall of 712mm.
It shows that distribution of rainfall, not quantity, is the problem. In 2015, the state received good rainfall in April and early May facilitating good sowing. But rain stayed away in July and August when it was needed the most. It’s been happening for the past few days too, Reddy added.
[edit] Mumbai
2,000 mm of rainfall was received in the rainy season
…in 52 days: By July 22, 2021
…in 56 days: By July 26, 2023: Mumbai reached the first 1,000 mm rainfall milestone on July 21 2023, and the next 1,000 mm mark was reached in five days.
[edit] North India
[edit] Falling rainfall trend/ 1961-2013
North India may have enjoyed a bountiful monsoon so far this year but long-term rainfall data points to a worrying trend. An India Meteorological Department (IMD) analysis reveals several parts of the region have been witnessing decreasing annual rainfall over the past five decades.
Delhi and NCR cities such as Gurgaon and Noida such as Gurgaon and Noida are among 85 districts across the country , constituting 8% of India's area, where a “significantly decreasing“ rainfall trend has been observed since 1961.
The decreasing trend was most pronounced in north India, which has more than 50 of these districts, many in agriculturally important belts.
The IMD study ana lysed annual and seasonal rainfall trends in 632 districts and 34 meteorological sub-divisions, barring Ladakh, Andaman & Nicobar and Lakshadweep islands, using rainfall data from 1901 to 2013. Uttar Pradesh finds it self with more than 40% (32 out of 75) of its districts showing a significant drop in rainfall. In Delhi, eight of the nine (old) districts showed the trend.
An IMD scientist involved in the analysis told TOI that while researchers found no trend in countrywide rainfall during the periods studied, subdivision and district-wise trends were apparent. “The aim of the study was to implement suitable measures and en sure proper management of water resources in districts that have shown decreasing rainfall,“ the scientist said.
More recent data outside the study, too, reveals a weakening of the monsoon in several parts of north India. The trend is sharpest since 1999. Of the 18 rainy seasons during this period, Haryana received at least 10% below normal monsoon in 13 years. For Punjab, the corresponding figure was 12. Decreasing rainfall has obvious impacts on levels of groundwater, which is increasingly being used in agricul ture as well as cities in the region. Satellite studies have revealed alarming levels of over exploitation of ground water in north India.
The IMD study also revealed an increasing rainfall trend in several districts, including many in Jammu & Kash mir and Bihar, and a few in Jharkhand, Punjab and Chhattisgarh.
Scientists involved in the study said it was difficult to pinpoint reasons for the increasing or decreasing trends. An expert at the Indian Institute of Tropical Meteorology reasoned that monsoon circulation had been showing a weakening trend since the 1950s, possibly due to anthropogenic influences like pollution aerosols. “Indo-Gangetic plains are a core monsoon area, where the monsoon trough is located. The weakening of the monsoon circulation may have had its impact on this region too,“ he said.
[edit] Pune
[edit] 1961-2013: bucks trend of 85 districts
Despite being a rain shadow region, Pune is the only district in Maharashtra where yearly rainfall has increased significantly since 1961 though close to 85 districts in the country, including in Delhi, Haryana, Uttar Pradesh and Madhya Pradesh, among others, have witnessed decreasing annual rainfall during the last five decades, a recent analysis by India Meteorological Department (IMD) has found.
The IMD study analysed long-term trend of annual and seasonal rainfall over 632 districts and 34 meteorological sub-divisions using rainfall data from 1901 to 2013. The analysis was done barring Andaman and Nicobar and Laksh adweep islands. The analysis found that while monsoon and annual rainfall has decreased significantly in Pune from 1901 to 2013, the district's annual rainfall has increased over the recent decades -from 1961-2013.
Annual and monsoon rainfall for Mumbai suburban and Raigad, too, has decreased during the 113-year period, the study found. Conversely , from 1961 to 2013, the annual rainfall for the two coastal districts has increased, but not significantly. An IMD scientist involved in the analysis told TOI that while researchers found no trend in the country-wide rainfall during the periods studied, subdivision-wise and districtwise trends were apparent.
The analysis found that over the last five decades, subdivisions like Marathwada in Maharashtra, Punjab, Himachal Pradesh, Harayana, Delhi, Uttarakhand, west and east UP have seen a reduction in both, annual and monsoon rainfall, while Konkan-Goa has seen a significant increasing trend, followed by Madhya Maharashtra, Vidarbha, among others in the country .
[edit] Punjab and Haryana
[edit] 1999-2014: Rain woes in Punjab, Haryana
The Times of India, Jun 03 2015
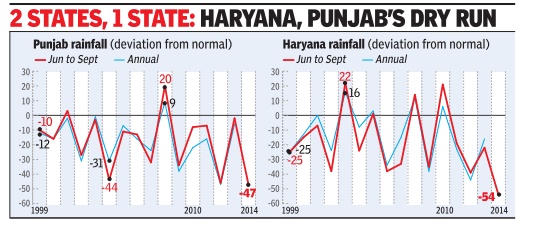
Amit Bhattacharya
SHOWER SHORTAGE - For 2 grain-bowl states, below-par rain for 16 years
IMD's monsoon update predicts 85% seasonal rains for northwest India, indicating that rain woes of the agriculturally crucial states of Punjab and Haryana could continue for another year.
Both states have witnessed meteorological droughts in five of the last 10 years, meaning rainfall in half of the past decade has been at least 25% below the long term average (LPA). Last year's monsoon season was among the driest in the recorded history of both states. Punjab received 243.5mm of rain against an LPA of 491.5mm, posting a 50% deficit for the season. It was the second worst monsoon in the state in 113 years (1901-2014), next to only the 67% deficit seen in 1987.
Haryana had an even greater deficit of 56%, with the state receiving 200.1mm rain as against an LPA of 460.3mm. Only two monsoons since 1901 have been worse in the state.
More worryingly, the distress is not limited to the past decade. The two grainbowl states, which were at the forefront of India's green revolution, have been getting below par rainfall for the past 16 years.
According to Met department figures, Punjab has seen just two above normal monsoons since 1999. The last time that happened was eight years ago, in 2008.
Haryana's plight is similar. The June-September rains in the state have been above par on just four occasions in the past 16 monsoons.
Some experts see the chronic monsoon deficien cy in the two states as the worst symptoms of a larger and natural monsoon cycle, which has been in the downswing phase in the past several decades.
Other experts TOI had spoken to when it highlighted this trend last year were of the opinion that the deficit went beyond natural monsoon variability and needed to be investigated.
Interestingly, all through this one-and-a-half decades of depressed rainfall, the ag ricultural output of the two states has been rising.
That's because farmers have been tapping deeper and deeper into the groundwater resources of the region.
According to a Central Ground Water Board report, Punjab overexploits its groundwater annually by 170%, the highest in the country . Of the 138 blocks in the state, groundwater is overexploited in 110 (80%).Haryana is not far behind, with 59% of blocks labelled overexploited.
Many studies, including those using satellite data to map the groundwater situation, have shown that such drawals were unsustainable and the region was fast reaching the limits of such overexploitation.
[edit] South/ peninsular India
[edit] 2021
‘S India saw highest rainfall in Nov since 1901’/ The Times of India / 2 December 2021
2021, Nov Peninsular India recorded the highest ever rainfall in November since 1901, said the India Meteorological Department (IMD) on Wednesday while noting that even the ‘heavy’, ‘very heavy’ and ‘extremely heavy’ rainfall events last month were the highest over the last five years.
Andhra Pradesh, Tamil Nadu, Puducherry, Kerala and south interior Karnataka received169% excess rainfall while the country witnessed 645 ‘heavy’ (64.5 to 115.5 mm), 168 ‘ve heavy’ (115.6 to 204.5 mm) and 11 ‘extremely heavy’ (over 204.5 mm) rainfall events in November.
The Met department attributed such rainfall events to the active phase of northeast monsoon and also to five lowpressure systems over the Andaman Sea in November which was nearly double the average number of low-pressure systems in the month.
[edit] YEAR-WISE
[edit] 2018
[edit] Dry dams in west, north; overflow in south
September 16, 2018: The Times of India
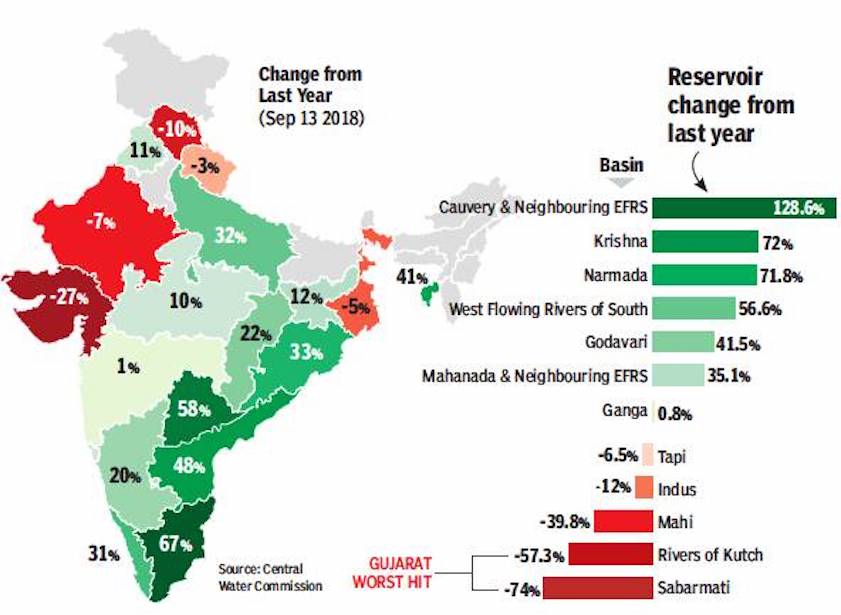
From: September 16, 2018: The Times of India
June was a good month: monsoon hit Kerala on time and most of the country, barring four states, got decent rain. By mid-June, rainfall was actually 20% in excess. Things got choppy after that – heavy rain in parts, deficit in others. So, by August 8, there was a 10% deficit. This shrunk to 6% by end of the month, but by September 11, deficit was up to 8%.
All this, coupled with how it has rained in the previous years, led to some reservoirs running dry while some are overflowing. Gujarat has been among the worst hit, with reservoirs linked to river Sabarmati 74% drier than last year.
It’s exactly the opposite down south. There, the reservoirs are overflowing. Tamil Nadu’s reservoirs now have 67% more water than in 2017.
[edit] Civil Lines very wet, Mayur Vihar dry
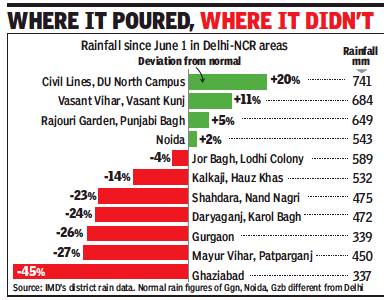
From: Amit Bhattacharya, Delhi’s monsoon: Civil Lines very wet, Mayur Vihar dry, September 21, 2018: The Times of India
The monsoon was normal in the capital in 2018, but how much rain did your locality get? The answer will depend on where you stay. If you are a Mayur Vihar resident, for instance, the monsoon was poor for you — 450mm since June 1, 27% below normal. But just 15km away, a Civil Lines resident had good reason to think the rains this year were excessive. The area has got 741mm of rain, 20% above normal.
Welcome to the vagaries of rainfall distribution. Even in a relatively small area like Delhi and its satellite cities, rains have been far from even. IMD’s district-wise rainfall data reveals a highly variable picture, ranging from 20% excess monsoon in north Delhi to a 45% shortfall in Ghaziabad.
Consider Gurgaon and its adjoining areas. While the Millennium City can feel shortchanged this monsoon, having got just 337mm of rain with a deficit of 26%, neighbouring Vasant Kunj and Dwarka have received more than double that amount of rainfall — 684mm, 11% above normal.
Met explains why your area got rain, your friend’s didn’t
Met officials said such high differences in rainfall weren’t out of line. “These differences aren’t abnormal. Rainfall is the most variable weather parameter. The smaller the area under study, the larger is the variation likely to be,” said B P Yadav, head of IMD’s Regional Meteorological Centre.
This year, several close by areas got vastly different amounts of rain over the season. For instance, the New Delhi district housing places such as Jor Bagh, Lodhi Colony and the Lutyens’ Bungalow Zone had a fairly wet monsoon (589mm, deficit of -4%) but the central district, including areas like Daryaganj, Paharganj and Karol Bagh, was considerably drier. The district has a 24% deficit, having received 472mm of rain.
Explaining such high divergence, Met officials said rainfall is rarely evenly distributed, even during spells of widespread rain. “In the beginning of this month, the Ridge observatory in north Delhi recorded heavy rainfall for twothree days while several other stations in the city hardly had any rain,” the official said.
For the record, the north Delhi district — IMD goes by the old demarcation of districts in which north includes places such as Rajpur Road, Shamnath Marg, Civil Lines and DU’s north campus — was the wettest this season in the city. The driest district was east (Mayur Vihar, Preet Vihar, Patparganj etc). Among Delhi’s neighbouring cities, Ghaziabad was the driest having received just 337mm of rain through the season. Overall, Delhi has an 8% monsoon deficit, well within the normal range (+20 to -20%).
However, questions could be asked on the quality of the district-wise data, particularly since the Met department does not have working rain gauges in all districts. An official said weather stations at Akshardham and DU were not working.
“Many of the automatic weather stations in the city were set up during the Commonwealth Games. These came up close to spots associated with the Games. These locations are not always ideal for capturing district-wise rain data,” an official said, not wishing to be named.
The north Delhi district was the wettest this season in the city. The driest district was east. Overall, Delhi has an 8% monsoon deficit, well within the normal range (+20 to -20%)
[edit] 2019
[edit] 27% decline in pre-monsoon rainfall
April 28, 2019: The Times of India
As temperatures rise, pre-monsoon rainfall records 27 per cent dip: IMD
NEW DELHI: Pre-monsoon rainfall from March to April, a phenomenon critical to agriculture in some parts of the country, has recorded 27 per cent deficiency, according to the India meteorological department (IMD).
The IMD recorded 43.3 millimetres of rainfall across the country from March 1 to April 24 as against the normal precipitation of 59.6 millimetres. This was 27 per cent less of the long period average (LPA).
The highest deficiency of 38 per cent was recorded in the northwest India division of the IMD, which comprises states of Uttar Pradesh, Delhi, Punjab, Haryana, Jammu and Kashmir, Uttarakhand, Himachal Pradesh.
This was followed by the Southern peninsula division comprising all five states of the South India and the Union Territory of Puducherry, Goa and coastal Maharashtra, where the deficiency recorded was 31 per cent, the IMD said.
East and northeast India division recorded 23 per cent deficiency.
The Central India division is the only one to have recorded more than five per cent rainfall than the normal.
Pre-monsoon showers, thunderstorms and lightening have killed more than 50 people in Madhya Pradesh, Maharashtra, Gujarat and Rajasthan this month.
Several parts of India receive pre-monsoon rainfall which is critical for those regions. The phenomenon, which is usually from March to May end, is vital as it helps in bringing the temperatures down.
The situation also appears to be grim as large parts of the country have been witnessing heating and there has not been any major relief since April 17, said Mahesh Palawat, vice president (Meteorology and Climate Change), Skymet.
One of the reasons for a pre-monsoon rainfall is excessive heating from March to June which several parts of the country witness. The moisture from the Arabian Sea and the Bay of Bengal aids in creation of thunderstorms, Mritunjay Mohapatra, additional director general of the IMD said.
"Pre-monsoon rainfall is important for horticulture crops in some parts of the country. In states like Odisha, ploughing is done in the pre-monsoon season," he said.
Laxman Singh Rathore, former director general of the IMD, said in parts of northeast India and the Western Ghats, pre-monsoon rainfall is critical for plantation of crops.
There will be "moisture stress" in case of a deficit, he said.
Crops like sugarcane and cotton, planted in central India, survive on irrigation, but also require supplement of pre-monsoon rains, Rathore added.
"In the forested regions of Himalayas, pre-monsoon rainfall is necessary for plantations like apple. Due to moisture, pre-monsoon rainfall also helps in minimising the occurrence of forest fires," he said.
[edit] 2020
[edit] Delhi, Sep- Dec
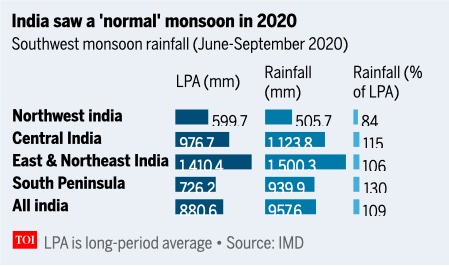
From: April 17, 2022: The Times of India

From: April 17, 2022: The Times of India
In 2020, the monsoon had withdrawn on September 30, but the city mostly remained dry as the last rainfall was recorded on September 8. Only trace rainfall was reported in October last year, while November and December recorded just 0.6mm and 1.6mm rainfall, respectively.
[edit] 2021
[edit] Punjab
Anju Agnihotri Chaba, Oct 19, 2021: The Indian Express
Punjab has received below normal rainfall this monsoon, which has withdrawn in the past couple of days from the state. Not just this year, the state has seen a declining trend in rainfall during monsoon in the past two decades. The only silver lining was that the rainfall pattern was good this year, which was witnessed after a long gap.
How much rainfall did the state receive this monsoon period?
Though the formal period of monsoon in Punjab from June 1 to September 30 is over, monsoons are yet to withdraw from northern India. According to Indian Meteorological Department (IMD) records, 436.8 mm rainfall has been recorded in Punjab this year against the normal required 467.3 mm from June 1 to September 30 — which is 7 per cent below the normal monsoon rain.
Less rain in the monsoon period leads to less annual rainfall in the state because around 79 per cent of the annual rain of the state takes place in monsoon period. Punjab’s annual rainfall is around 650 mm, which has decreased from around 800 mm in the 1980s.
What has been the trend of rainfall in the past two decades in the state?
Weather scientists say Punjab has not only been recording below normal rainfall but also deficient rainfall in the past two decades. Anything less than the normal, which can be even 1 per cent less, is called below average rain, but rainfall is categorised as ‘deficient’ when it is less than 20 per cent of the normal average.
In the past two decades, the number of years with below average (467 mm) monsoon rainfall has increased to 8 per decade. According to records, between 2000 to 2009 and 2010 to 2019, there were eight years each decade with below normal rainfall, while the number of deficient rainfall years has also increased in this period as compared to the previous decades, which is a huge shift. Between 2010 to 2019, there were six years with deficient rainfall including 2014 (50% deficient rain), 2012 (46%), 2015 (31%), 2011 (28%) 2016 (25%), 2017 (22%), while 2010 and 2019 recorded below normal rainfall with (7% less rain) in each. Even in 2020, there was 17 per cent less rain from the average. Between 2000 to 2009, there were four years which had recorded deficient rainfall including 2002 (27.2% less), 2004 (44.1%), 2007 (32.2%) and 2009 (34.9%) and the other four recorded below normal rain out of total eight below average rainfall years in this decade.
This is a very bad trend for a state like Punjab where less rain means extracting more water from the ground for irrigation purposes, when the water table in 84 per cent of the state is already over-exploited.
How much deficient rainfall did the state record in previous decades?
From 1990 to 1999, there were only three years of below normal rainfall while there was no deficient rainfall year recorded in this decade. Between 1980 and 1989, there were two years 1982 (24.9%) and 1987 (67.6%) with deficient rainfall. Between 1970 and 1979, there were three years including 1972 (27.6%), 1974 (36.1%) and 1979 (38.3%) with deficient rainfall. From 1960 to 1969 and 1950 to 1959, there were three and one years with deficient rainfall, respectively. According to Indian Meteorological Department (IMD), there were 35 years of deficient rain in Punjab between 1901 and 2017 (117 years) out of which 10 years of deficient rain were recorded between 2000 and 2019 itself, which means 29 per cent deficient rainfall years in just 17 per cent of over a century.
Why despite below normal rain, is this monsoon being considered good by weather experts?
Dr Prabhjyot Kaur Sidhu, head of the Department for Climate Change and Agricultural Meteorology, Punjab Agriculture University (PAU), Ludhiana, said: “During this monsoon we witnessed a good pattern of rainfall. For instance, if 100 mm rainfall was witnessed in an area then it rained in 8-10 hours, while in the recent years, we had witnessed that 100 to 110 mm rain in just one or two hours which was just a waste of precious rainwater and that pattern was creating flash floods, which was bad for ground water recharging too.”
“If good amount of rain is falling continuously for longer period — 10 to 12 hours — then it is a boon for groundwater recharging because this rain water then seeps into the ground completely and does not accumulate on the surface and thus helps in water recharging,” she said, adding that such monsoons used to occur long ago when light to moderate rains used to take place continuously for days together.
“In Ludhiana we witnessed around 100 mm rainfall thrice this monsoon and every time, this amount of rainfall was recorded during an 8 to 10 hours duration instead one to two hours,” she added.
She also said that this monsoon was quite peculiar because it was advanced by two weeks and then there was a rain break for two weeks in July and August, while in September it rained again and surplus rain was recorded, after which the monsoon finally withdrew in October, while usually, monsoon withdraws by September-end in the state.
What are the factors driving the below normal rain trend?
Dr Prabhjyot said there are several factors and they are not Punjab-specific but a global phenomenon due to which erratic weather changes are occurring, for which a collective approach is required to minimise the effect of global warming to control extreme weather variables.
Experts said deforestation in the state is also one of the causes of the decreasing rainfall trend.
[edit] See also
India Meteorological Department
Rainfall: India and Burma, 1907-12
Rainfall: India
[edit] ...and also
January weather in India <> February weather in India <> March weather in India <> April weather in India <> May weather in India <> June weather in India <> Summers: India<> July weather in India <> August weather in India <> September weather in India <> Monsoons: India<> October weather in India <> November weather in India <> December weather in India <> Winter rains: India <> Winters: India<> Rainfall: India
