Government finances: India
(→Revenues and expenditure (composite graphics, notes)) |
(→Part-B of Budget: Corporate, income taxes’ share, 1997-2017) |
||
| Line 482: | Line 482: | ||
''Expenditure on interest payments as percentage of total spending, 2007-17'' | ''Expenditure on interest payments as percentage of total spending, 2007-17'' | ||
| + | |||
| + | |||
| + | =Revenues and expenditure (composite graphics, notes)= | ||
| + | ==As in 2019== | ||
| + | [[File: Government revenues vis-à-vis expenditures, as in 2019.jpg|Government revenues vis-à-vis expenditures, as in 2019 <br/> From: [https://epaper.timesgroup.com/olive/ODN/TimesOfIndia/shared/ShowArticle.aspx?doc=TOIDEL%2F2019%2F07%2F06&entity=Ar01107&sk=CD51F9E3&mode=image July 6, 2019: ''The Times of India'']|frame|500px]] | ||
| + | |||
| + | See graphic, ' Government revenues vis-à-vis expenditures, as in 2019’ | ||
=Part-B of Budget: Corporate, income taxes’ share, 1997-2017= | =Part-B of Budget: Corporate, income taxes’ share, 1997-2017= | ||
| Line 512: | Line 519: | ||
The government is already in a bit of a spot as far as revenue collection is concerned. Data released by the Controller General of Accounts showed that during the April-November period, revenue deficit stood at 152 per cent of the Rs 3.2 lakh crore full-year target, signalling that the government may also miss the revenue deficit target of 1.9 per cent of GDP for 2017-18. Add to that declining revenue collection from GST (Goods and Services Tax), which now subsumes all indirect taxes apart from customs, and the finance minister is posed with a tricky situation at hand.
Mr. Jaitley indeed is stuck in a three-way conundrum. One, he needs to provide relief to the corporate sector; Two, he needs to ramp up income tax collection without irking the salaried class ahead of the election year and thirdly, making sure that the government does not run into debt due to poor revenue generation. His report card on all these fronts will be out by mid-day of February 1. | The government is already in a bit of a spot as far as revenue collection is concerned. Data released by the Controller General of Accounts showed that during the April-November period, revenue deficit stood at 152 per cent of the Rs 3.2 lakh crore full-year target, signalling that the government may also miss the revenue deficit target of 1.9 per cent of GDP for 2017-18. Add to that declining revenue collection from GST (Goods and Services Tax), which now subsumes all indirect taxes apart from customs, and the finance minister is posed with a tricky situation at hand.
Mr. Jaitley indeed is stuck in a three-way conundrum. One, he needs to provide relief to the corporate sector; Two, he needs to ramp up income tax collection without irking the salaried class ahead of the election year and thirdly, making sure that the government does not run into debt due to poor revenue generation. His report card on all these fronts will be out by mid-day of February 1. | ||
| − | + | [[Category:Economy-Industry-Resources|F GOVERNMENT FINANCES: INDIAGOVERNMENT FINANCES: INDIA | |
| + | GOVERNMENT FINANCES: INDIA]] | ||
| + | [[Category:Government|F GOVERNMENT FINANCES: INDIAGOVERNMENT FINANCES: INDIA | ||
| + | GOVERNMENT FINANCES: INDIA]] | ||
| + | [[Category:India|F GOVERNMENT FINANCES: INDIAGOVERNMENT FINANCES: INDIA | ||
| + | GOVERNMENT FINANCES: INDIA]] | ||
=India’s position vis-à-vis other countries= | =India’s position vis-à-vis other countries= | ||
Revision as of 11:29, 16 December 2020
This is a collection of articles archived for the excellence of their content. |
Assets and debts
2016: India and other countries

From: October 25, 2018: The Times of India
Few governments know how much they own, or how they use those assets for the public’s well-being. Knowing what a government owns and how they can put their assets to better use matters because they can earn about 3% of GDP more in revenues each year and reduce risks, all at once, finds a report...
See graphic:
The Assets and debts of the governments of India and other major countries in 2016
Budget deficit
Estimated and actual deficits, 2015-17

From: Surojit Gupta, January 29, 2018: The Times of India
See graphic:
Estimated and actual budget deficits, 2015-17
2012-18

From: June 19, 2018: The Times of India
See graphic:
Budget deficit- 2012-19, figures as % of GDP
Current account deficit
2017-18: grows 42% to $160bn
India’s FY18 current account deficit grows 42% to $160bn, June 14, 2018: The Times of India

From: India’s FY18 current account deficit grows 42% to $160bn, June 14, 2018: The Times of India
Trebles To 1.9% Of Country’s GDP From 0.6% In Previous Fiscal
A surging import bill, which included crude oil, has resulted in widening of the current account deficit (CAD) — the gap between imports and exports of goods & services — to 1.9% of the gross domestic product (GDP) in FY18 from 0.6% in FY17.
Oil imports resulted in net outflows of $71 billion in FY18, up from $55 billion in FY17. However, oil was not the only culprit with non-oil imports too up 18% to $361 billion from $305 billion in FY17 (see net difference in graphic). Also contributing to the increase in the import bill was the rise in gold purchases. The net outgo due to gold rose 22% to $33.5 billion from $27 billion a year ago. While the current account deficit is higher than last year, it is still within manageable limits.
On the positive side, worker remittances in FY18 improved to $40.3 billion from $35.3 billion in FY17. IT companies also increased their earnings with exports of computers services earning $72.2 billion, up from $70.1billion in FY18.
According to data released by the RBI, for the full year, India’s trade deficit increased 42% to $160 billion in FY18 from $112.4 billion in FY17. The higher imports were partly offset by an increase in net invisible receipts, which were higher in FY18, mainly due to increase in net services earnings and private transfer receipts.
On the capital account front, gross foreign direct investment inflows to India increased to $61 billion in FY18 from $60.2 billion in FY17. However, with investors cashing out, net FDI inflows in FY18 moderated to $30.3 billion from $35.6 billion in FY17.
The capital account was gained by a net inflow of $22.1 billion under foreign portfolio investments — almost thrice the inflow of $7.6 billion seen a year ago. This resulted in a net accretion of $43.6 billion to the foreign exchange reserves on a balance of payment basis, which is sum of current account and capital account.
For the quarter ended March 2018, the current account deficit stood at $13 billion
(1.9% of GDP), up from $2.6 billion (0.4% of GDP) in Q4 of 2016-17, but moderated marginally from $13.7 billion (2.1% of GDP) in the preceding quarter.
The widening of the CAD on a year-on-year (y-o-y) basis was primarily because of a higher trade deficit ($41.6 billion) brought about by a larger increase in merchandise imports relative to exports. Net services receipts increased by 8.8% on a y-o-y basis, mainly on the back of a rise in net earnings from software services and other business services.
During the quarter, private transfer receipts — mainly representing remittances by Indians employed overseas — amounted to $18.1 billion, increasing by 15.1% from their level a year ago. The net FDI for the quarter at $6.4 billion was higher than $5 billion in the corresponding quarter in 2017.
2020, January-March : a surplus
Current account swings to a rare surplus, July 1, 2020: The Times of India
Mumbai:
Data released by the RBI shows that the country recorded a current account surplus of $600 million (0.1% of GDP) for the January-March 2020 quarter as against a deficit of $4.5 billion (0.7%) of GDP a year ago. The last time the current account was in surplus was over a decade ago in March 2007.
The surplus was generated because of the trade deficit shrinking to $35 billion and a sharp rise in net invisible receipts at $35.6 billion as compared to the year-ago period.
A current account surplus is seen as a positive for the rupee as it shows that the supply of dollars for trade is more than demand. The current account position is likely to remain positive in the first quarter of the current fiscal due to the sharp decline in oil prices and the general decline in imports.
For FY20, the current account deficit narrowed to 0.9% of GDP from 2.1% in 2018-19. This was on the back of the trade deficit, which shrank to $157.5 billion in 2019-20 from $180.3 billion in 2018-19. The country’s revenue from the export of services increased to $22 billion in March as against $21.3 billion a year ago. Transfers from Indians working abroad jumped 14.8% to $20.6 billion. The January-March quarter also saw foreign direct investments double to $12 billion from $6.4 billion a year ago.
Fiscal deficit
2004-2019

From: Govt expects fiscal deficit to be better than estimate, February 4, 2019: The Times of India
See graphic:
India’s fiscal deficit as % of GDP, 2004-2019
2012-20
May 30, 2020: The Times of India
From: May 30, 2020: The Times of India
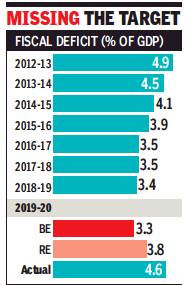
The Centre’s fiscal deficit ballooned to 4.6% of the GDP during the last financial year, mainly on account of a near 10% shortfall in the scaled down revenue target, while spending was scaled down marginally as several ministries could not spend their revised allocation.
The fiscal deficit numbers released by the Controller General of Accounts were higher than the revised estimate of 3.8% of GDP released by the government when the Budget was presented on February 1 and is the highest since the 4.9% recorded in 2012-13. While the lockdown in March resulted in a slowdown in economic activity and tax revenue, the government’s decision to extend the tax payment deadline also contributed to muted inflows into the treasury.
But if March was bad, the situation was worse in April where the Centre’s tax revenue when collections were estimated at Rs 67,557 crore, over 44% lower than a year ago.
2015-16
The Times of India, Jun 01 2016

The government managed to rein in fiscal deficit marginally below the revised estimate for 2015-16, despite mopping lower than budgeted taxes. But, it also meant that the finance ministry had to curtail spending below the revised estimates for the last financial year.
With the provisional estimate of GDP higher than the advance estimate, the Centre's fiscal deficit was estimated at 3.92% of GDP compared to 3.94% in the revised estimate. Against the revised estimate of Rs 5.35 lakh crore of fiscal deficit, the Centre closed the year with a deficit of Rs 5.32 lakh crore, data released by the controller general of accounts showed.
Fiscal deficit is the difference between the government's total spending and receipts, which include tax, non-tax revenue as well as capital receipts such as proceeds from disinvestment.
This was the second year in a row that the government met the fiscal deficit target, but it did not have to significantly cut spending to meet the projections. With private sector investment remaining subdued, the government has been forced to step up public expenditure and lower oil subsidies last year helped keep keep deficit under check.
The government, however, slipped marginally on revenue deficit, which brea ched the revised estimate of Rs 3.41 lakh crore to close the year at a little over Rs 3.42 lakh crore. Revenue deficit is the difference between receipts and expenditure, such as interest payments and other spending to keep assets running. The government is hoping to meet the deficit targets during the current financial year too.
“The fiscal space available to enhance capital spending in 2016-17 has been limited by the Pay Commission and OROP-related (one-rank, one-pension) commitments, despite the revenue augmentation measures introduced in the Budget for 2016-17. The evolving buoyancy of tax and non tax revenues during the current fiscal would critically impact the headroom available to the government to boost spending on identified priorities such as infrastructure creation and PSU bank recapitalization,“ said Aditi Nayar, senior economist at ratings agency ICRA
2016-17: Target of 3.5% deficit was met
Govt meets 3.5% fiscal deficit target for 2016-17, June 1, 2017: The Times of India
The government on Thursday said it has achieved the fiscal deficit target of 3.5% of GDP in 2016-17.
“Fiscal deficit is 3.51% of GDP or Rs 5.35 lakh crore in 2016-17,“ the Controller General of Accounts (CGA) said while releasing the provisional accounts for the last financial year.
For 2017-18, the government aims to further bring down the fiscal deficit -the gap between expenditure and revenue -to 3.2%. The CGA further said that revenue deficit during the last fiscal was 2.02% of GDP. As per provisional data, the fiscal deficit in April 2017 was Rs 2.05 lakh crore, which is 37.6% of the Budget estimate, as against 25.7% in the yearago period. Total expenditure of the government in April was Rs 2.42 lakh crore, or 11.3% of the full-year estimate.
Revenue collection was Rs 35,081 crore, or 2.3%, of the estimate. Total receipts of the government -from revenue and non-debt capital -in April stood at Rs 36,529 crore. Revenue deficit during the month was Rs 1,78,383 crore, or 55.4%, it said. Revenue deficit refers to the shortfall in total government revenue realisation from targeted figure.
2018-19 (+ 2019-20, projected)
How cost of populism fits into the economics, February 2, 2019: The Times of India
From: How cost of populism fits into the economics, February 2, 2019: The Times of India
It’s a magical trick finance ministers have perfected over the years. On the face of it, the budget gives away lots to large sections of the populace and yet the numbers show there has been no reckless spending and the fiscal deficit remains under control.
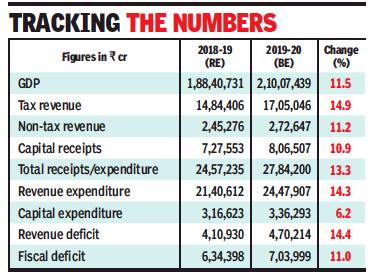
Piyush Goyal has proved he is adept at this magic too. Despite an income support scheme for over 12 crore farmers and tax write-offs for 3 crore taxpayers, the Budget suggests the fiscal deficit for next year will be at 3.4% of GDP, unchanged from the current year. So how is this possible?
One part of the explanation is in the assumed revenue projections. The Budget assumes that nominal GDP will grow by 11.5% from the revised estimate for the current year to touch Rs 210 lakh crore. But the Centre’s tax revenues as a whole are estimated to rise 14.9% (see graphic). Taxes on corporates are estimated to rise by a similar level, but personal income tax collections are slated to go up 17.2%. The only way that is possible with a huge chunk of taxpayers being given a zero liability is if the net widens significantly in the current year and adds relatively richer segments.
The tax numbers also assume that Central GST collections will rise by 21% in the coming year. Again, it’s not clear why this should happen when rates have if anything been tweaked downwards.
On the non-tax revenue side, the RBI it seems will have to play Santa both in the current year and in the next. Against actual realisations of about Rs 44,100 crore in 2017-18 from dividends and surpluses of the RBI and dividends from the banking and financial sector PSUs, the amount jumped to roughly Rs 74,100 in the RE for the current year and is projected to rise further to Rs 82,900 crore in the coming year. That’s a clear indication that at least a part of the RBI’s surplus will be called upon to bail out the fisc.
In the larger context, while the fiscal deficit may seem to be equally under control at 3.4% of GDP in the current and coming years, there is a difference. That’s because revenue expenditure will rise by 14.3% while capital expenditure —investing in creating assets — will go up by a meagre 6.2%. the consequence is that the revenue deficit, widely considered the more worrying deficit, will widen from Rs 4.1 lakh crore in RE 2018-19 to Rs 4.7 lakh crore in the next year, reversing a decline from Rs 4.4 lakh crore in 2017-18. But given the imperatives of an election year, that’s a detail you can’t really expect the government to be too bothered about.
Market borrowings by states
2020/ Q2

From: July 30, 2020: The Times of India
See graphic:
Market borrowings by Indian states, 2020/ Q2
Tax base
The curious case of a narrow tax base:FY05-FY15
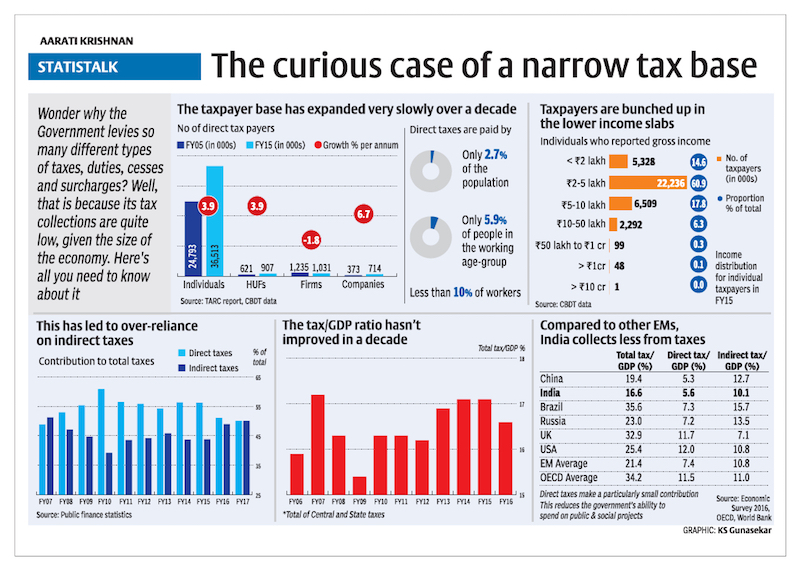
Please see graphic Tax base in India, (Economic Survey, 2016, OECD, World Bank)
40% Of Indirect Taxes are From petrol, diesel
Mopped Up 40% Of Indirect Tax Kitty From Fuels
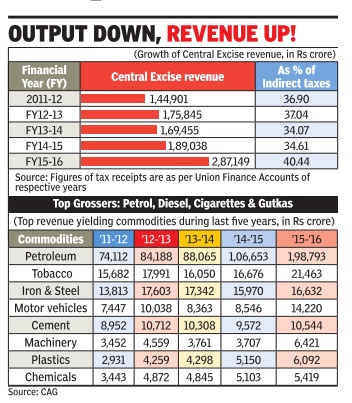
The massive jump in excise duty on petrol and high speed diesel helped the government mop up nearly 40% of its indirect tax kitty from the two auto fuels in 2015-16, compared to 34% in the previous financial year.
A study by the Comptroller and Auditor General (CAG) showed that Union excise duty collection shot up almost 70% from Rs 1.69 lakh crore during 2013-14 to Rs 2.87 lakh crore in 2015-16, with a majority of the contribution being from petrol, diesel, cigarettes and gutka. The indirect tax kitty includes duties from customs, central excise and service tax.
Excise revenue from petroleum products, which made up for 52% of collections in 2013-14, went up to almost 69% during 201516 as the government resorted to a massive increase in levies in the wake of falling global prices.
The central excise duty on petrol and high speed diesel increased from Rs 1.2 per litre and Rs 1.46 per litre to Rs 8.95 per litre and Rs 7.96 per litre respectively during the last two financial years. Revenue from petroleum products went up from Rs 88,000 crore in 2013-14 to Rs 1.99 lakh crore in 2015-16. Tax on sin goods (mainly tobacco products) at Rs 21,000 crore was second highest contributor to indirect taxes.
Compared to countries like Pakistan and Sri Lanka, India has one of the highest retail prices of fuel oil in the subcontinent. The high price of petrol and diesel in India was contrary to the international trend in crude oil prices that crashed from a high of $112 a barrel in 2014 to as low as $30.
Though the lower oil prices substantially reduced India's oil bill as the country depends on 80% imports, domestic prices were kept high by increasing central excise duties. The excess revenue earned was meant to fund government's social sector schemes. The CAG, which tabled its report in Parliament on Friday, however, highlighted the issue by pointing out how the government has been losing major revenue by giving exemptions to industry . The revenue forgone on account of different exemptions come up to more than Rs 2 lakh crore a year which the auditor has said need to be rationalised.
The revenue forgone for FY2016 on excise duties was Rs 2.25 lakh crore -Rs 2.06 lakh crore as general exemptions and Rs 19,000 crore as area-based exemptions. This was over 78% of total revenue earning from central excise.
The auditor has observed that though the main objective behind issue of exemption orders is to deal with circumstances of exceptional nature, but this objective was not properly defined. “As such, the duty forgone on account of issue of special exemption orders is not being calculated towards revenue forgone figures,“ it noted.
Where the taxes came from, 1997-2018
2017 was a watershed year for India with GST completely changing the way we pay our taxes. Click on the dropdown menu above for more details on how the Government of India gets it money and choose the trend you want to see: personal income tax, corporate taxes, service tax, excise or custom duties.
January 19, 2018: The Times of India
Why customs duty is fast becoming a thing of the past'
Back in the day, before India's economy opened up to liberalisation, getting your hands on an imported perfume or a fancy bottle of scotch whiskey was something that was indeed a coveted thing. 'Duty free shops' at airports were all the rage back then and homecoming of relatives staying abroad would feel like Christmas, as they would pick up goodies from these shops. But by the millennial generation reached their teen years, the times had changed. India was increasingly becoming an open economy and the government was keen on relaxing customs duty.
No wonder then, that customs which accounted for about 34 per cent of the total revenue generated in 1996-97 had dipped to nearly third of the share by the time Arun Jaitley presented the last budget. As private and foreign investments started taking over a globalised Indian market, a paradigm shift was visible as India was no longer a country with one of the highest import duty rates in the world. To maintain the balance in the kitty, finance ministers focused on collecting revenues from other form of taxes.
The share of customs duty might well decline further in Budget 2018 with the current regime pushing hard on its 'Ease of Doing Business' pitch.
Not only the customs, the excise duty tax collections also showed a major declining trend over the years. In last two decades, these revenue collections have dived from 34.91 per cent in 1996-97 to 21.29 per cent in 2017-18. The collections in 2002-03 were at 39.38 per cent -- which is the highest in 20 years --fell to 21.29 per cent in 2017-18. The figures went drastically down to 15.26 per cent in 2014-15 from 32.91 per cent in 2004-05. Although, the excise collections have shown signs of picking up.
However, on a separate front, customs duty can boast of a badge of honour. It remains the only indirect tax that is not subsumed under the Goods and Services Tax (GST). So on February 1, when finance minister Arun Jaitley delivers his budget speech, customs will hold special significance despite its diminishing prominence. And will indeed have a cascading effect on goods that use imported material which face duties. Lithium-ion batteries, for example is 100 per cent imported and is a key component in electric cars.
Service tax, 1997-2017
January 16, 2018: The Times of India
HIGHLIGHTS
Service tax accounted for 14.39 per cent of the total revenue expectation in last year's budget
Service tax is among more than a dozen taxes that have been subsumed under GST
Amid declining GST mop-up, the government needs to ensure that the service sector continues to fill its coffers
The roll out of GST (Goods and Services Tax) has subsumed more than a dozen indirect taxes, which constituted 49 per cent of the government's total revenues. Some more number crunching reveals that service tax - which has also been subsumed under GST- alone formed 14.39 per cent of the total revenue expectation in last year's budget. In fact, the revenue generated from the service taxes showed a tremendous run over the last two decades. To put this simply, the figures rose to 14.39 per cent in 2017-18 from just 0.73 per cent in 1996-97.
As a reckoner, service tax is the 15 per cent tax that one used to pay for dining out or a phone recharge. Under GST, most of these services are in the 18 per cent slab.
The share of service tax in total revenues has consistently gone up since the mid 90s but it saw steep rise under the UPA regime when it rose by 9 per cent in 10 years. However, it peaked under the Modi government when it reached 14.53 per cent of the total kitty. The roll out of GST was expected to further improve the revenue generated from services. Finance Minister Arun Jaitley will not be able to tweak service tax rates in the budget as the GST council holds that power now. Amid declining GST mop-up, the government needs to ensure that the service sector continues to fill its coffers.
1997-2018: All sources

Tax revenue is the government’s income from different kinds of taxes: direct taxes (personal income tax and corporate tax) accounted for 51.3% of total revenues in 2016-17 and the rest came from indirect taxes. Because of the introduction of GST from July 2017, the government’s revenues are undergoing a makeover from this year as all indirect taxes (with the exception of customs duties) are now decided by the GST Council and not the Government of India.Data source for this chart: Government of India budget documents
From: January 29, 2018: The Times of India
See graphic:
Tax revenue is the government’s income from different kinds of taxes
1997-2018: Corporate Tax to Tax Revenue

This is the proportion of tax revenue that comes from company profits.Data source for this chart: Government of India budget documents
From: January 29, 2018: The Times of India
See graphic:
Corporate Tax to Tax Revenue, 1997-2018
1997-2018: Customs to Tax Revenue

Revenues from import duties are the only major indirect tax that the Government of India still controls after the introduction of GST in July 2017.Data source for this chart: Government of India budget documents
From: January 29, 2018: The Times of India
See graphic:
Customs to Tax Revenue, 1997-2018
1997-2018: Excise Duties to Tax Revenue
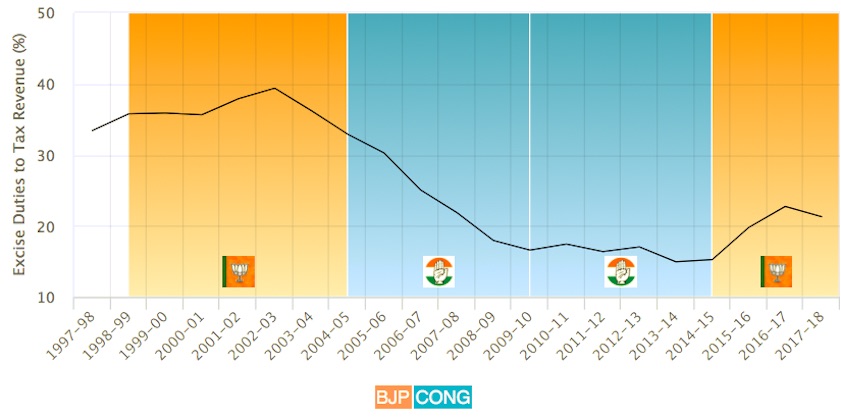
This the contribution to government funds that comes from taxes on manufacturing.Data source for this chart: Government of India budget documents
From: January 29, 2018: The Times of India
See graphic:
Excise Duties to Tax Revenue, 1997-2018
1997-2018: Personal Income Tax to Tax Revenue

This is the proportion of tax revenue that comes from the incomes of Indian citizens. Data source for this chart: Government of India budget documents
From: January 29, 2018: The Times of India
See graphic:
Personal Income Tax to Tax Revenue, 1997-2018
1997-2018: Service Tax to Tax Revenue

This the contribution to government funds that comes from taxes on services (like say eating out in restaurants, on mobile phone bills, for upscale hair dressing etc).Data source for this chart: Government of India budget documents
From: January 29, 2018: The Times of India
See graphic:
Service Tax to Tax Revenue, 1997-2018
Income tax, 2013-16
January 30, 2018: The Times of India

From: January 30, 2018: The Times of India

From: January 30, 2018: The Times of India

From: January 30, 2018: The Times of India
See graphics:
1. Tax payers in india, 2015-16
2. Tax and income inequality in India, as in January 2018
3. Number of tax payers and amount of tax revenue, 2013-16, year-wise
Last year, tax payers rejoiced when finance minister Arun Jaitley announced a reduction in tax rate in the income tax slab of Rs 2.5 lakh to Rs 5 lakh to 5 per cent from 10 per cent in his budget speech. Therefore, it's natural, people will hope for a similar or better announcement in budget 2018. He may or may not, but an in-depth look into the number of Indians paying taxes throw ups some surprising facts.
According to data from the Central Board of Direct Taxes (CBDT), only 2.05 crore Indians or 1.7 per cent of 120 crore Indians paid taxes in 2015-16. Break that up further and you see that 4.6 per cent of total taxpayers paid a whopping 62.34 per cent taxes collected, while 89.86 per cent paid just 23.73 per cent of total taxes. The remaining 5.5 per cent paid 13.92 per cent of taxes.
If around 11 per cent of taxpayers pay a gargantuan 76.26 per cent of taxes, it is because they earn disproportionate share of income. Tax payers with a declared income between Rs 1 and Rs 2.5 lakh make a whopping 93.3 per cent of total tax payers in India.
Despite the fact that India added more tax payers in 2015-16, up from 1.91 crore tax payers in 2014-15, it didn't register an increase in tax revenue. In fact, the tax collected in 2015-16 was to the tune of 1.88 lakh crore, lower than the Rs 1.91 lakh crore collected in 2014-15.
Big question: Why do only 1.7 per cent of Indians pay taxes?
The answer lies in the fact that 90 per cent of Indians don't fall in the tax bracket as they earn less than Rs 2.5 lakh a year, and hence are exempt from paying income tax.
Plus, there are several categories of income earners who don't have to pay tax even if their annual income is more than Rs 2.5 lakh. These include farmers and some categories of non-salaried professionals who and pay lower taxes.
Cesses, surcharges, earned and spent: 2014-17
Priya Kapoor, January 30, 2018: The Times of India

From: Priya Kapoor, January 30, 2018: The Times of India

From: Priya Kapoor, January 30, 2018: The Times of India

From: Priya Kapoor, January 30, 2018: The Times of India

From: Priya Kapoor, January 30, 2018: The Times of India
See graphics:
1. Underutilised-unused cesses, 2016-17
2. India's earnings from cesses and surcharges, 2014-17, year-wise
3. Cess as a percentage of centre's tax revenue, 2009-16, year-wise
4. Cesses India pays, as in January 2018
With Budget 2018 round the corner, you may be taking comfort in the hope that this year may see no new cess announcement thanks to the implementation of Goods and Services Tax (GST) last year. But what about the money that you have already paid over the years towards cesses? Till last year, before GST, India had 20 cesses including Swachh Bharat cess, Krishi Kalyan cess, Clean energy cess, Education cess etc., each levied for funding a particular purpose.
But what is surprising is that money collected from some of these cesses is lying unused. According to the Comptroller and Auditor General (CAG), six major cesses fetched the government Rs 4 lakh crore till 2016-17. Of this, over Rs 1.81 lakh crore, or nearly 45 per cent of the funds collected, remained unutilised and were not transferred from the government's Consolidated Fund of India to the dedicated funds or the intended schemes.
Out of Rs 7,885.54 crore collected from Research and Development (R&D) cess during 1996-2017, only Rs 609.46 crore (7.73 per cent) was utilized towards its aim. The story is somewhat similar for Rs 83,497 collected from Secondary and Higher Education Cess (SHEC) during 2006-17, which remained untransferred to the earmarked fund.
In the past three years revenues collected from these cesses and surcharges have tripled. In 2014-15, the collection from cesses and surcharges stood at Rs 75,533 cr. However, in 2016-17 it saw a whopping Rs 2,35,308 cr
Also, cesses as a percentage of Centre's tax revenue saw a rise in last few years as unlike tax revenues, collections from cess and surcharge was not shared with states.
Despite the fact that India has abolished many cesses post the GST roll out, we still have to pay some cesses like education cess on imported goods and road cess on petrol.
Where the taxes came from in 2017
January 30, 2018: The Times of India

From: January 30, 2018: The Times of India
See graphic:
Where India’s taxes came from in 2017
Truth be told, paying taxes is not something most people look forward to. But for the government, the importance of tax revenues can't possibly be overemphasized, because is simple words-- that's where it earns its money to run the country. In fact, earlier this month, the government emphatically cheered the fact that direct tax collection in the first nine-and-a half months of the current financial year were up by 19 per cent, compared to last year.
Till the last budget, the government's incomes could be broadly classified into- Direct Tax (which includes personal income tax and corporate tax) and Indirect Tax (more than a dozen of cesses and taxes including excise, customs, service tax etc). But the roll out of GST (Goods and Services Tax) has subsumed all indirect taxes, except customs duty.
Some number crunching of last year's budget throws up an interesting fact-- that the share of direct and indirect tax was almost equal --51.3 per cent and 48.7 per cent respectively.
India Inc contributed the most to the government's coffers as corporate tax accounted for 28.2 per cent of the total revenues.
What the taxes were spent on, 1997-2018
1997-2017: Defence expenditure
January 30, 2018: The Times of India
HIGHLIGHTS
In the last budget, defence spending received the smallest chunk of the total outlay (in terms of percentage) since 1996-97
In the last two decades, defence received the maximum allocation in the 2000-01 budget, in the backdrop of Kargil war
The Narendra Modi led-BJP government has projected itself as a rather aggressive backer of the armed forces. From foreign policy on neighbouring countries Pakistan and China to various cabinet ministers and leaders stressing on the valour and sacrifice of the military, the current government has made its stand clear towards the forces.
However, when it comes to spending on defence, the budget allocation for the same paints a different picture. In fact, in the last year's Union Budget, defence spending received the smallest chunk of the total budget outlay (in terms of percentage) since 1996-97. Finance minister Arun Jaitley had allocated a 12.22 per cent of the total spending towards defence. This was a slight dip from the 12.31 per cent spent in the fiscal previous to that- 2016-17. Defence outlay has seen a consistent slip under the current regime as it has come down by almost a per cent since its first budget presented for the 2014-15 fiscal.
Since the Union Budget of 1996-97, defence received the maximum share of the total expenditure in the 2000-01 budget, when the then finance minister Yashwant Sinha had allocated 16.73 per cent of the entire spending. These were the days of Atal Bihari Vajpayee's government and the budget was presented in the backdrop of the Kargil war. Defence spending saw another spurt under Manmohan Singh's regime in the 2005-06 budget when it received 16.14 per cent. However in the following years under the UPA-rule, defence received lower outlays.
1997-2018: All-expense heads

This chart explains how and where the Government of India spends its money.Data source: Government of India budget documents
From: January 29, 2018: The Times of India
See graphic:
What the taxes were spent on, 1997-2018
1997-2018: Capital Expenditure to Total Expenditure

This is the spending by government on investments in long-term projects that give future economic returns like highways, ports, electicity grids etc. as a proportion of its total spending.Data source: Government of India budget documents
From: January 29, 2018: The Times of India
See graphic:
Capital Expenditure to Total Expenditure, 1997-2018
1997-2018: Defence Spending to Total Expenditure
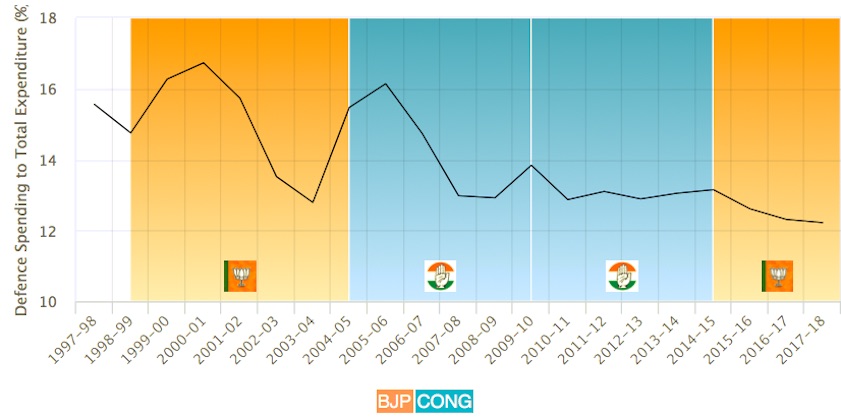
This is the spending by government on defence as a proportion of its total spending. Data source: Government of India budget documents
From: January 29, 2018: The Times of India
See graphic:
Defence Spending to Total Expenditure, 1997-2018
1997-2018: Defence Spending to Total Expenditure

This is the money government pays as interest on all its oustanding debt on past borrowings which haven’t yet been paid back, as a proportion of its total spending.Data source: Government of India budget documents
From: January 29, 2018: The Times of India
See graphic:
Interest Payment to Total Expenditure, 1997-2018
1997-2018: Interest Payment to Tax Revenue

This measures how much the Indian government pays on interest as a proportion of its tax revenues. Think of this as the amount you pay in interest on loans for every Rs. 100 you earn.Data source: Government of India budget documents
From: January 29, 2018: The Times of India
See graphic:
Interest Payment to Tax Revenue, 1997-2018
1997-2018: Pensions to Total Expenditure, 1997-2018

This is the money government spends on pensions to retired employees, as a proportion of its total spending.Data source: Government of India budget documents
From: January 29, 2018: The Times of India
See graphic:
Pensions to Total Expenditure, 1997-2018
1997-2018: Subsidies to Total Expenditure, 1997-2018
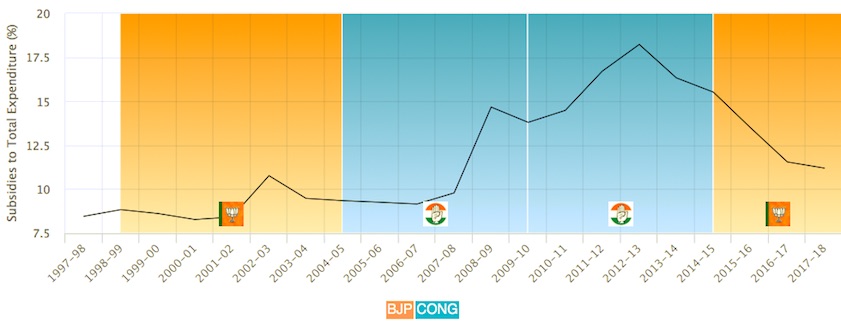
Subsidies are any good or sevice provided below costs to sections of people as part of its duty (for example, on fertilisers, train tickets, LPG or metro rail fares in big cities). This chart measures the amount it spends on subsidies as a proportion of its total spending.Data source: Government of India budget documents
From: January 29, 2018: The Times of India
See graphic:
Subsidies to Total Expenditure, 1997-2018
What India spent on Defence, 2007-17

From: The Times of India
See graphic:
Expenditure on defence as percentage of total spending, 2007-17
What India spent on Subsidies, 2007-17

From: The Times of India
See graphic:
Expenditure on subsidies as percentage of total spending, 2007-17
What India spent on Pensions, 2007-17

From: The Times of India
See graphic:
Expenditure on pensions as percentage of total spending, 2007-17
What India spent on Interest Payments, 2007-17

From: The Times of India
See graphic:
Expenditure on interest payments as percentage of total spending, 2007-17
Revenues and expenditure (composite graphics, notes)
As in 2019

From: July 6, 2019: The Times of India
See graphic, ' Government revenues vis-à-vis expenditures, as in 2019’
Abhik Deb, January 24, 2018: The Times of India

From: Abhik Deb, January 24, 2018: The Times of India

From: Abhik Deb, January 24, 2018: The Times of India
Corporate Tax to Tax Revenue, 1997-2018, year-wise
Personal Income Tax to Tax Revenue, 1997-2018, year-wise
HIGHLIGHTS
The Modi government has seen a dip in share of corporate tax to total revenues. On the other hand, the share of income tax tax to total revenues has gone up. TOI analyses how this trend puts finance minister Arun Jaitley in a spot as far as revenue collection is concerned
The mention of Part-B of the Union Budget may not ring a bell in the common man's mind but it deals with something that probably concerns him the most- taxes. Alternatively, it is also something that will make Mr. Jaitley and his team burn the midnight oil. While taxes are the government's source of income, it also reflects key elements of its policy implementation. In this context, let us see how the Modi government has tweaked things as far as income tax and corporate tax are concerned.
Both personal income tax and corporate tax come under direct taxes which in the last budget together constituted 51.3 per cent of the total revenues, the government projected to earn in the current fiscal. A further breakdown shows that corporate tax accounted for 28.2 per cent of the revenue budget. Even as corporate tax still contributes the most to the government's coffers, the balance is significantly shifting under this regime.
During PM Modi's regime, the share of corporate tax to total revenues has come down from 34.45 per cent in 2014-15 to 28.18 per cent in 2017-18. On the other hand, the share of personal income tax in the same period has gone up from 21.35 per cent to 23.08 per cent, the highest in the last two decades. The contrasting trend is congruent to the government's broader policies as facilitating ease of enterprise and spreading further the income tax net have been parallel but equally strong pitches of the Modi government.
This trend is only expected to continue in Budget 2018. India Inc has been pushing Finance Minister Arun Jaitley to cut down corporate tax. Experts believe that with the US substantially cutting corporate tax, the minister will also need to keep India's tax rate globally competitive.
If the government actually decides to provide relief to the business class, it will have to do so while ensuring that it scores impressively in its attempt to widen the income tax base. A recent data revealed by the Income Tax department has revealed that just over 2 crore Indians, or 1.7 per cent of the total population, paid income tax in the assessment year (AY) 2015-16. Despite being an improvement from the previous year, the pool of taxpayers is hardly enough to handle the pressure of revenue requirement.
The government is already in a bit of a spot as far as revenue collection is concerned. Data released by the Controller General of Accounts showed that during the April-November period, revenue deficit stood at 152 per cent of the Rs 3.2 lakh crore full-year target, signalling that the government may also miss the revenue deficit target of 1.9 per cent of GDP for 2017-18. Add to that declining revenue collection from GST (Goods and Services Tax), which now subsumes all indirect taxes apart from customs, and the finance minister is posed with a tricky situation at hand. Mr. Jaitley indeed is stuck in a three-way conundrum. One, he needs to provide relief to the corporate sector; Two, he needs to ramp up income tax collection without irking the salaried class ahead of the election year and thirdly, making sure that the government does not run into debt due to poor revenue generation. His report card on all these fronts will be out by mid-day of February 1.
India’s position vis-à-vis other countries
2018

From: April 11, 2020: The Times of India
See graphic:
In 2018, India’s government debt-to-GDP ratio was 67%. This graphic compares India with Brazil, China, France, Germany, Indonesia, Japan, Russia, South Korea, the UK, the USA and other countries.
See also
Government finances: India