Tourism (outbound): India
(→Amount spent on foreign trips) |
(→Indian tourists: 2006-15) |
||
| Line 52: | Line 52: | ||
==Indian tourists: 2006-15== | ==Indian tourists: 2006-15== | ||
| − | |||
| − | |||
[[File: Number of Indian nationals departing from India and rate of foreign trips, 2006-15.jpg|Number of Indian nationals departing from India and rate of foreign trips, 2006-15; [http://epaperbeta.timesofindia.com/Article.aspx?eid=31808&articlexml=STATOISTICS-THE-NUMBER-OF-INDIANS-TRAVELLING-ABROAD-HAS-24012017010028 The Times of India], Jan 24, 2017|frame|500px]] | [[File: Number of Indian nationals departing from India and rate of foreign trips, 2006-15.jpg|Number of Indian nationals departing from India and rate of foreign trips, 2006-15; [http://epaperbeta.timesofindia.com/Article.aspx?eid=31808&articlexml=STATOISTICS-THE-NUMBER-OF-INDIANS-TRAVELLING-ABROAD-HAS-24012017010028 The Times of India], Jan 24, 2017|frame|500px]] | ||
| + | '''See graphic''' | ||
| + | |||
| + | ''Number of Indian nationals departing from India and rate of foreign trips, 2006-15'' | ||
==Indian tourists: 2015== | ==Indian tourists: 2015== | ||
Revision as of 20:28, 27 September 2018
This is a collection of articles archived for the excellence of their content. |
Contents |
Amount spent on foreign trips
2013-18: a 25,300% increase
Mayur Shetty, Spends on foreign trips up 253x in 5 yrs, September 15, 2018: The Times of India
Overseas Expenditure By Indians Balloons To $4bn In 2017-18 From $16M In 2013-14
The biggest increase in Indians spending overseas has been on account of travel, where the monthly spend has increased nearly 457 times from less than a million dollars in July 2013 to $450 million two months ago. The other large hike in expenditure has been on studies abroad, which has grown 22 times to $343 million over the same period.
While there might have been exceptional reasons for the month-on-month increase, the full-year numbers show that this is a consistent trend. For instance, the annual spend on foreign travel has gone up 253 times from $16 million in FY14 to $4 billion in FY18. Similarly, Indians spent $2 billion on studies abroad in FY18 — 17 times more than the $2.9 billion spent in FY14.
While a part of the spike in spending is due to better reporting as payments shift to credit cards, there has also been a sharp increase in the number of Indians travelling abroad, which went up to 23 million in 2017. Besides the country’s dependence on imports for oil and electronics, these direct spends by individuals are also having an impact on the country’s balance of payments.
To put things in perspective, the annual spending by Indians under the Liberalised Remittance Scheme (LRS) — which allows each citizen to spend up to $2,50,000 annually — was only $1 billion in 2013-14. This went up to a record $11.3 billion in 2017-18 and, in the first four months of current fiscal 2018-19, the number is already at $4.2 billion.
The total expenditure abroad by individuals last year was over 23% of the $48-billion current account deficit in FY18. The biggest component of this is the spending by Indians who travel overseas, having paid $4 billion in FY18 compared to $92 million in FY14. Remittance towards studies has gone up from $461 million to $2 billion in four years. Interestingly, Indians have reduced their investment in overseas properties and financial instruments.
According to bankers, one reason for the increase in international travel could be that the rupee has been very steady until 2018. Also, financing has become much easier. “Although there is no separate category for travel loans, there is anecdotal evidence that a large share of personal loans are now being taken for overseas travel,” said an official with a large private bank, which is the market leader in personal loans.
Bankers said that the demonetisation exercise had also resulted in an increase in remittances. In January this year, the RBI revised the reporting norms for banks to ensure that data is captured in such a manner that no one breaches the limits. From April 2018, the RBI made it mandatory for banks to report on a daily basis individual transactions under the LRS. The new system enabled banks to see the remittance that each individual had already made during the year.
Bankers say that the reason why overseas investment in property and markets by Indians is going down is because these are typically done by high net worth individuals. “Promoters of companies need not take the LRS route to invest abroad. Since rupee is fully convertible on the current account, they can use the corporate route to buy assets abroad without any restrictions on the value,” said a foreign exchange dealer.
The other reason for the decline in investment in property is that the RBI has started cracking down on Indians using this route to invest money overseas.
In 2013, the RBI reduced the remittance limit to $75,000 a year from $2,00,000 and disallowed use of the LRS for purchase of property. In February 2015, the limit was hiked to $2,50,000 and property purchase was allowed. But the RBI disallowed consolidating a family’s remittance unless each of the member had a share in the property.
Indian tourists abroad
May 23 2015
Desis among biggest spenders on UK vacations
Kounteya Sinha
Indians are among the biggest spenders while holidaying in London, tourism data released by the city mayor's office has shown. As many as 213,000 Indians visiting London over nine months from January to September 2014 spent £172 million. India is ranked 17th in terms of countries for the number of visitors to London during the first three quarters of 2014, seventh for number of nights spent in the capital and 16th for the amount of money spend.
In the 12 months to September 2012, Indian visitors spent £159 million in London alone. But this saw a 40% rise to £220 million in just one year to Sept 2013.
Indian tourists: 2006-15

See graphic
Number of Indian nationals departing from India and rate of foreign trips, 2006-15
Indian tourists: 2015
The Times of India, Jan 31 2016
Himanshi Dhawan
World to cash in on India's newfound wanderlust
3Cr Indians set to tour world by 2018
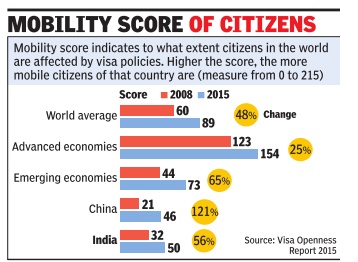
Among the top destinations for Indians are Dubai and South-East Asia. Dubai has registered a 26% increase with 16 lakh Indians visiting the country in 2015. Singapore similarly registered 10 lakh Indian visitors with a 7% year-on-year growth. A recent UNWTO Visa Openness Report 2015 points out, “When comparing data between 2015 and 2008 for some of the fast growing outbound markets, such as China, India and the Russian Federation, it becomes clear that destinations continue to make special efforts to facilitate visa formalities for tourists originating from these economies.“ As a direct consequence India's mobility score has increased from 32 in 2008 to 50 in 2015 suggesting that more and more countries are laying down the red carpet.
World Travel & Tourism Council's Travel & Tourism Economic Impact 2014
India, one of the largest outbound markets
The Times of India, April 27, 2016
Indian travellers among biggest spenders abroad
Saurabh Sinha
rotter has emerged as one of the biggest spenders who is being wooed aggressively by the world for his big bucks. Rajeev D Kale, Thomas Cook (India)'s president and COO, outbound tourism, said, “India is one of the largest outbound travel markets globally . World Travel & Tourism Council's Travel & Tourism Economic Impact 2014 (shows) that the total expenditure on outbound travel in India was Rs 75,000 crore in 2013 and (is) projected to be Rs 160,500 crore in 2024.“
According to Cox & Kings, an average India traveller spends Rs 3-4 lakh on a US trip, which usually lasts for 15-33 days. The travel giant says the corresponding figures for UK are Rs 4-6 lakh for 10-20 days; Rs 2-3.5 lakh for a 3-4 days visit to Fran ce and Italy which is part of an extended European trip; Rs 1-2 lakh for 4-5 days in Hong Kong or Singapore and Rs 2.5-3 lakh for a trip of 10-12 days in Australia. This includes airfare, hotel stay , local travel and sightseeing. “On an average, Indians spend around $1500 on hotel, food, sightseeing and shopping as compared to Americans who spends $1,000 and Europeans around $700 on an average,“ a senior Cox & Kings official said.
With this kind of spend, it is no surprise that Indians are in the top spender list of many countries. Britain counts Indians as the 14th largest spenders in their beautiful island nation.And, the German National Tourism Office (GNTO) says Indians are the fourth largest spenders for them, in terms of expenditure per person, per trip.
According to Visit Britain's Ritushri Dhankher, Indian tra vellers spent £443.6 million or Rs 4,259 crore (at current exchange rate of Rs 96 to a Pound) in 2014. Their average spend per person, per trip was £1,139 (Rs 1.1 lakh). Tourists from Gulf and China were bigger spenders at £3,461 (Rs 3.3 lakh) and £3,024, (Rs 2.9 lakh) respectively. Fellow Commonwealth Australians were only marginally ahead at £1,179 (Rs 113,000).
Romit Theophilus, director for India at GNTO, said Indians were at number four with an average spend per person, per trip of 2,741 euros (Rs 205,575 at current exchange rate of Rs 75 to a Euro) in Germany . Only travellers from Gulf, Australia and Japan were ahead at 4,344 euros (Rs 3.2 lakh), 4,160 euros (Rs 3.1 lakh) and 2,905 euros (Rs 2.2 lakh), respectively .
However, in terms of total spend by travellers from a country , India was the seventh biggest contributor in Germany in 2014 with a revenue generation of 0.8 billion euros or Rs 6,000 crore. The Americans were at the top position at 4 billion euros or Rs 30,000 crore. But the reason for Indians being at number seven is the Schengen states' insistence on giving short-term visas to Indian travelers, which is a deterrent to repeat visits. The US, on the other hand, generously doles out 10-year, multiple-entry visas to Indian travellers.
Tourism Australia's Nishant Kashikar said in 2015, over 2.3 lakh Indian visitors went to the continent and “contributed over Rs 5,500 crore in the Australian economy .“ Indians are the 10th largest spenders in Australia.
Travel portal Yatra president Sharat Dhall said, “Indians typically love to shop which means that they are willing to spend that extra buck. Hence, they are benchmarked as some of the biggest spenders.“
With this kind of money power at their disposal, tourism boards of several foreign countries regularly hold road shows here apart from organising India fests in their own nations.
Behaviour abroad
10th highest spenders on hotels
The Times of India, Nov 23 2015
Indian tourists rank 10th on spenders' list on hotel rooms abroad, finds study
The average Indian has been shedding that price-sensitive when travelling abroad, it tag seems. Indian tourists featured in the global top 10 list of nationalities who spend the most on hotel rooms abroad. With an average spend of Rs 9,351 per night, including taxes, when on an international trip, Indian travellers stood 10th on the list, which was led by travellers from Argentina.The Argentinians spent an average of Rs 10,456 per night followed by US tourists, who spent Rs 10,330 per night. The third rank went to the Swiss, whose av erage hotel room spend per night was Rs 10, 238, said a report released by Hotels.com.
But when it came to spending on hotel rooms within their own countries, the Swiss topped the list with an average spend of Rs 12,088 per night, followed by travellers from Singapore, who spent an average of Rs 9,298 per night, and those from Norway , who paid Rs 9,004 a night domestically.
If one were to look at best value accommodation when it came to spending on hotel rooms domestically , Indian travellers ranked fourth with an av erage payment of Rs 5,346 a night.
Topping the list of nationalities who paid the least when travelling domestic were people from Malaysia, who paid an average of Rs 3,645 per night.In the second spot were the Thai, who spent an average of Rs 4,502 per night, while those from Russia came third at Rs 5,063.
“Of the 32 countries analysed, 29 nations paid more abroad for travel than at home with some showing a significant gap between the two amounts,“ said the report, adding that only those from three countries paid more at home than abroad, with Swiss travellers bearing the highest difference, spending Rs 1,850 more on a domestic hotel than a foreign one. They were followed by travellers from Singapore with a difference of Rs 1,326 and those from Denmark with a difference of Rs 82.
Indian travellers’ behaviour in hotels, on flights
Indians make fussy travellers, are quick to complain & flout norms, May 19, 2018: The Times of India
From: Indians make fussy travellers, are quick to complain & flout norms, May 19, 2018: The Times of India

From: Indians make fussy travellers, are quick to complain & flout norms, May 19, 2018: The Times of India

From: Indians make fussy travellers, are quick to complain & flout norms, May 19, 2018: The Times of India

From: Indians make fussy travellers, are quick to complain & flout norms, May 19, 2018: The Times of India

From: Indians make fussy travellers, are quick to complain & flout norms, May 19, 2018: The Times of India
From: Indians make fussy travellers, are quick to complain & flout norms, May 19, 2018: The Times of India

From: Indians make fussy travellers, are quick to complain & flout norms, May 19, 2018: The Times of India
See graphics:
Indian travellers’ behaviour in hotels, on flights, when abroad, presumably as in 2018
Indian travellers’ preference for window seats on flights, when abroad, presumably as in 2018
Indian travellers’ behaviour on flights regarding reclining seats, when abroad, presumably as in 2018
Indian travellers’ behaviour on flights regarding having coffee and loo, when abroad, presumably as in 2018
Indian travellers’ opinion on how airlines treat them on flights, when abroad, presumably as in 2018
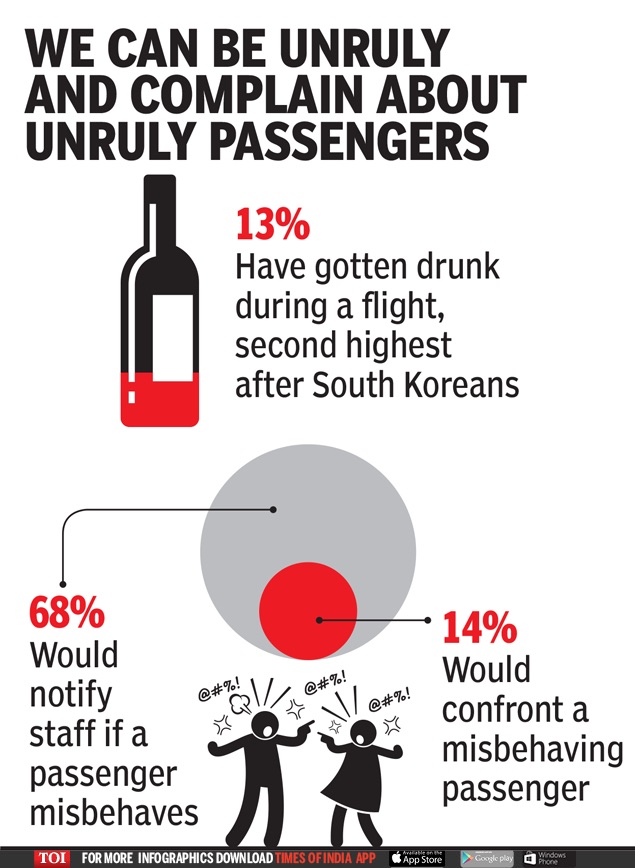
Indian travellers’ on whether to complain about unruly passengers or not, on flights, when abroad, presumably as in 2018
Indian travellers’ preference on whether to prefer brand name while selecting hotels to stay or not, when abroad, presumably as in 2018
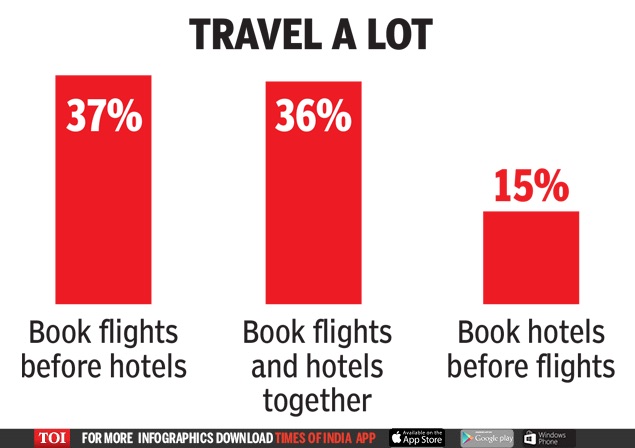
Indians complain the most about other guests at hotel front desks. A poor view from the hotel room prompts us to demand a change of room. On flights, we hanker for window seats, and are willing to pay for in-flight WiFi. Among the most frequent flyers on the continent in an Expedia survey of traveller behaviour across 23 countries, here’s what Indian yatris do…
TRAVEL APLENTY
Indian flyers on average take nearly 8 flights every year, third highest in Asia after Thailand and Japan
Luxury air travel
2011-16: Highest growth in India, China
The Times of India, May 23 2016
Study: India sees highest growth in luxury air travel
During 2011-16, Asia had the highest percentage increase in air travellers who booked business class seats for their outbound travel, with India and China leading the pack with solid two-digit growth, said a survey carried out by a travel industry major.
Luxury travel, that is, air travel in first class or business class is expected to go up in the next 10 years, with the growth rate in outbound luxury travel projected at 6.2%. In comparison, outbound air travel will grow only by 4.8%, said a report released by Amadeus, a travel IT solutions provider. Among the countries that will see the highest growth in outbound luxury travel are India and China.
“India's booming middle class presents great potential for luxury travel investment over the coming decade,“ said the report, adding that a high percentage of the business and first class travel out of India was seen on the medium and long-haul routes, that is, on routes to destinations like Singapore, London, Newark etc.
“Driven by India's impressive luxury market growth, south Asia's luxury market will expand at a faster rate than any other region,“ the report said. India's luxury market has been growing at an annual rate of 12.8%, which is higher than that of any BRICS country , it added.
When it comes to market leaders, North America and Western Europe account for 64% of global outbound luxury trips, despite making up only 18% of the world's population.
2016
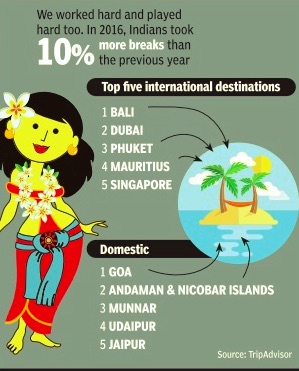
Vacations taken by Indians
See graphic
2016: Indians spent $13.6 bn
'Indian visitors in US spent a record $13.6 bn in 2016' , Aug 11, 2017: The Times of India
HIGHLIGHTS
As many as 1.17 million Indians visited the US in 2016.
India is ranked 11th in terms of number of international visitors to the US in 2016.
Indian visitors spent a record $13.6 billion in the US in 2016, positioning India on the sixth spot among the top 10 international markets for the US in terms of visitor spending.
As many as 1.17 million Indians visited the US in 2016.
India is ranked 11th in terms of number of international visitors to the US in 2016.
A total of 75.6 million international visitors came to the US in 2016 for business, medical, education and leisure purposes, who collectively spent $244.7 billion across the country.
Compared to 2015, visitor arrivals decreased by two per cent and visitor spending decreased one per cent.
It was the first decline in visitors since 2009, the US Department of Commerce said in its latest annual report.
In 2016, travel and tourism was the largest services export for the US, comprising 33 per cent of services exports and 11 per cent of exports overall, it said.
China ($33 billion), Mexico ($20.2 billion), India ($13.6 billion), and South Korea ($8.6 billion) all experienced an increase in both spending and visitations.
China was up 15 per cent in the number of arrivals and nine per cent in spending; South Korea was up 12 per cent in visitations and four per cent in spending; Mexico was up two per cent in visitations and three per cent in spending.
India on the other hand increased four per cent in arrivals and an impressive 14 per cent in spending.
The remaining top markets experienced declines.
"The US has enjoyed increased visitor spending from travellers originating out of India in every single year ever reported, save one (spending was absolutely flat in 2009)," the annual report said.
In fact, in little more than a decade, travel and tourism exports to India have tripled, culminating into a record- setting $13.6 billion in 2016, said the Department of Commerce.
"Travel and tourism exports account for 66 per cent of all US services exports to India," it said.
This propelled India to the sixth spot in terms of spending, pushing Brazil behind.
It was not solely India's strong performance that sent Brazil packing in 2016, pushing Brazil down in the rankings; it was more so the substantial (and somewhat unexpected) decline in total Brazilian spending in the US that pushed Brazil down to seventh place, markedly declining nearly 20 per cent in 2016 to $11.0 billion.
In fact, the number of visitors from Brazil who travelled to the US plummeted by nearly 24 per cent to 1.7 million in 2016, the lowest level since 2011. Brazilians dramatically reduced their outbound travel globally in 2016 (by as much as 15 per cent in some reports), but not as sharply as they did to America.
Arrivals from Brazil accounted for 2.2 per cent of all international arrivals to the US, it said.
While China is ranked fifth with 2.97 million visitors to the US, Chinese spent a whopping $33 billion to put it the number one country in terms of spending.
Canada, on top, which had 19.3 million visitors in 2016, experienced an eight per cent drop in its spending to $20.9 billion. It is ranked second after China in terms of spending.
Countrywise
USA
2009-16: a rise; 2017: slight decline
No. of Indian visitors to US down for 1st time in 8 yrs, September 14, 2018: The Times of India
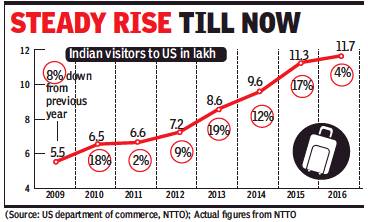
From: No. of Indian visitors to US down for 1st time in 8 yrs, September 14, 2018: The Times of India
The number of Indian travellers to the US has witnessed its first decline in the last eight years, reports Saurabh Sinha.
About 11.14 lakh Indians went to the US in 2017, down 5% from 11.72 lakh in the previous year, says the US department of commerce’s National Travel and Trade Office “forecast of international travellers to the US by origin countries”.
Before this, 2009 saw 5.5 lakh Indian travellers to the US, which was a decline of 8% over the previous year. This was the time when the global slowdown set in. But since then, Indian visitors were increasing every year till 2016.
‘International travel from India rising at 10-12%’
The NTTO had in April temporarily suspended publication of overseas arrival “data due to anomalies in records received from US Customs and Border Protection (CBP)”. As a result, the figures of international travellers to the US for 2017 were not known. On Wednesday, it released the forecast with figures for 2017, which showed a decline in the number of Indian travellers.
However, this may be a temporary blip. The NTTO forecasts an increase in the number of Indian travellers to the US from 2018 to 2022.
Travel industry sources say the international travel from India is rising constantly at 10-12% for the last many years. “There has been a perception in recent times that travel to the US may have become more difficult, especially after some entry restrictions there for certain nationalities. However that is a wrong perception and for the right travellers, the US is as open as it always was,” said a Delhi-based travel agent, who did not want to be named.
This, another travel agent said, is proven by the fact that US routinely issues 10-year validity, multiple entry visas to most Indian applicants under tourist (B1 and B2) category for a visa fee of about Rs 10,000-11,000. European countries, on the other hand, mostly issue very limited period visas or their visa charges are very high. “US wants multiple visits from the right people and therefore follow this policy, which has not changed. The fall in numbers in 2017 over 2016 is an aberration caused by unfounded fears,” said another travel agent.
The US department of commerce, in a statement, said on Wednesday: “US welcomed nearly 7.7 crore international visitors into the country who collectively spent a record-setting $251.4 billion experiencing the US in 2017, a 2% increase when compared to 2016... The number of international travellers to the US rose 0.7 % in 2017 compared to the previous year.”
2015: no.11 source market; no.7 spenders

Indian visitors have emerged among the top overseas spenders in the US and Uncle Sam is now pulling all stops to attract more tourists from the country . Brand USA, the destination marketing organization for the country , says the latest travel data is for 2015 which shows India was at number 11in terms of source market for tourists to the US and number seven in terms of spend.
Of the 7.7 crore international visitors US had in 2015, 11.1 lakh were from India who collectively spent $12 billion. “Indians are among the highest spenders among overseas visitors to the US. From overseas, UK sends the highest number of visitors to the US. In 2015, Indians on an average spent $10,700 -almost four times more than $2,600 by those from the UK,“ said Chris Thompson, president and CEO of Brand USA.
The average spend by all foreign visitors was $4,400-4,500. Indians also tend to have long stays with average traveller spending 35 days there on a trip in 2015. Amid talk of extreme checks at airports in recent days for visitors entering the US, Thompson assured Indian visitors that nothing had changed for them. “Nothing about abili ty to get a visa, or enter has really changed. There have been no policy changes yet. A lot of things have been said but nothing has changed. We have a great history of a very strong relationship with our friends and visitors from India. That is not going to change at all,“ he said. Reassuring India is a must as the country is one of the fastest growing source tourism markets for the US. The year 2015 saw 17% rise in visitors from India to the US and 8% increase in spend by them. “The US department of Commerce projects that Indian visitors will rise on an average by 9-10% over the next five years. India is one of our most important source markets in terms of economic impact. We see India as a major contributor to tourism,“ Thompson said.
“The interesting thing about India is that its population is getting younger. Our ability to capture attention at a young age and nurture that over most of their adult life will help us in future,“ Thompson said, adding, “We are looking at improvement in entry and visa policy .We will make it easier for people to travel between the two countries.“ More Indians are now opting out of package tours to the US and going in for individual bookings by going online.