Kausani
From Indpaedia
(Difference between revisions)
(Created page with "{| class="wikitable" |- |colspan="0"|<div style="font-size:100%"> This is a collection of articles archived for the excellence of their content.<br/> Additional information ma...") |
|||
| Line 7: | Line 7: | ||
|} | |} | ||
| − | + | ||
| − | [[Category: | + | [[Category:Climate/Meteorology |K ]] |
| − | + | ||
=Rainfall= | =Rainfall= | ||
| Line 18: | Line 18: | ||
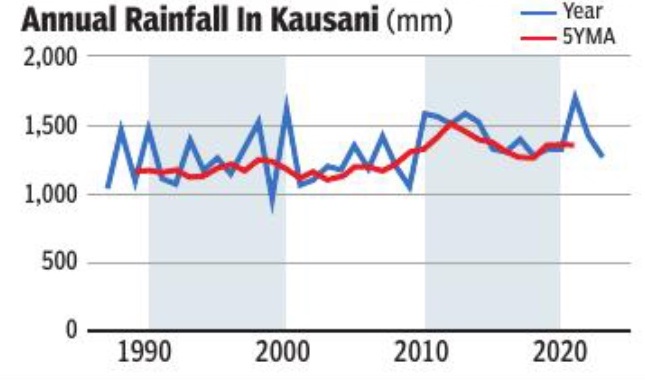
Thanks to the daily rainfall data that hobby meteorologist David Hopkins has recorded since 1987, at Kausani, on a ridge to the north, but very much in the same meteorological zone. The graph above shows annual rainfall since then, along with a five-year moving average, ‘5YMA’. Annual rainfall was flat, averaging about 1150 mm a year for about two decades till 2005, then perked up to almost 1500 mm, and is now running at 1350 mm a year. | Thanks to the daily rainfall data that hobby meteorologist David Hopkins has recorded since 1987, at Kausani, on a ridge to the north, but very much in the same meteorological zone. The graph above shows annual rainfall since then, along with a five-year moving average, ‘5YMA’. Annual rainfall was flat, averaging about 1150 mm a year for about two decades till 2005, then perked up to almost 1500 mm, and is now running at 1350 mm a year. | ||
| + | |||
| + | [[Category:India|K | ||
| + | KAUSANI]] | ||
| + | [[Category:Places|K | ||
| + | KAUSANI]] | ||
Latest revision as of 06:41, 30 June 2024
This is a collection of articles archived for the excellence of their content. |
[edit] Rainfall
[edit] 1987-2023

Annual rainfall in Kausani, 1987 – 2023
From: MOHIT SATYANAND/ Heli-buckets and tankers in hills, but the fault is not in our clouds/ The Times of India/ 23 Jun 2024
From: MOHIT SATYANAND/ Heli-buckets and tankers in hills, but the fault is not in our clouds/ The Times of India/ 23 Jun 2024
Thanks to the daily rainfall data that hobby meteorologist David Hopkins has recorded since 1987, at Kausani, on a ridge to the north, but very much in the same meteorological zone. The graph above shows annual rainfall since then, along with a five-year moving average, ‘5YMA’. Annual rainfall was flat, averaging about 1150 mm a year for about two decades till 2005, then perked up to almost 1500 mm, and is now running at 1350 mm a year.