Migration: India
(→Outward migration from India) |
(→Internal migration) |
||
| Line 49: | Line 49: | ||
''2010, 2017: Immigrants living in India, China and major countries' | ''2010, 2017: Immigrants living in India, China and major countries' | ||
| − | |||
| − | |||
| − | |||
| − | |||
| − | [[ | + | [[Category:Demography|M MIGRATION: INDIAMIGRATION: INDIAMIGRATION: INDIAMIGRATION: INDIA |
| − | + | ||
| − | + | ||
| − | + | ||
| − | + | ||
| − | + | ||
| − | + | ||
| − | + | ||
| − | + | ||
| − | + | ||
| − | + | ||
| − | + | ||
| − | + | ||
| − | + | ||
| − | + | ||
| − | + | ||
| − | + | ||
| − | + | ||
| − | + | ||
| − | + | ||
| − | + | ||
| − | + | ||
| − | + | ||
| − | + | ||
| − | + | ||
| − | + | ||
| − | + | ||
| − | + | ||
| − | + | ||
| − | + | ||
| − | + | ||
| − | + | ||
| − | + | ||
| − | + | ||
| − | + | ||
| − | + | ||
| − | + | ||
| − | + | ||
| − | + | ||
| − | + | ||
| − | + | ||
| − | + | ||
| − | + | ||
| − | + | ||
| − | + | ||
| − | + | ||
| − | + | ||
| − | + | ||
| − | + | ||
| − | + | ||
| − | + | ||
| − | + | ||
| − | + | ||
| − | + | ||
| − | + | ||
| − | + | ||
| − | + | ||
| − | + | ||
| − | + | ||
| − | + | ||
| − | + | ||
| − | + | ||
| − | + | ||
| − | + | ||
| − | + | ||
| − | + | ||
| − | + | ||
| − | + | ||
| − | + | ||
| − | + | ||
| − | + | ||
| − | + | ||
| − | + | ||
| − | + | ||
| − | + | ||
| − | + | ||
| − | + | ||
| − | + | ||
| − | + | ||
| − | + | ||
| − | + | ||
MIGRATION: INDIA]] | MIGRATION: INDIA]] | ||
| − | [[Category:India|M | + | [[Category:India|M MIGRATION: INDIAMIGRATION: INDIAMIGRATION: INDIAMIGRATION: INDIA |
MIGRATION: INDIA]] | MIGRATION: INDIA]] | ||
| − | [[Category:Society|M | + | [[Category:Pages with broken file links|MIGRATION: INDIA]] |
| + | [[Category:Society|M MIGRATION: INDIAMIGRATION: INDIAMIGRATION: INDIAMIGRATION: INDIA | ||
MIGRATION: INDIA]] | MIGRATION: INDIA]] | ||
Revision as of 14:20, 13 January 2021
This is a collection of articles archived for the excellence of their content. |
Contents |
Attacks on migrants, normally workers
1960s-2018 (brief history)
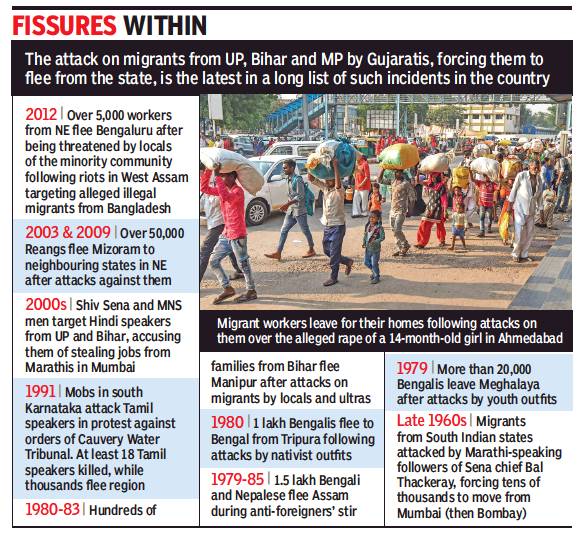
From: October 9, 2018: The Times of India
See graphic:
1960s-2018: Attacks on migrants, normally workers, a brief history
HNW individuals’ migration
How The Rich Buy New Nationalities; 2017 figures
How The Rich Buy A New Nationality, July 30, 2018: The Times of India
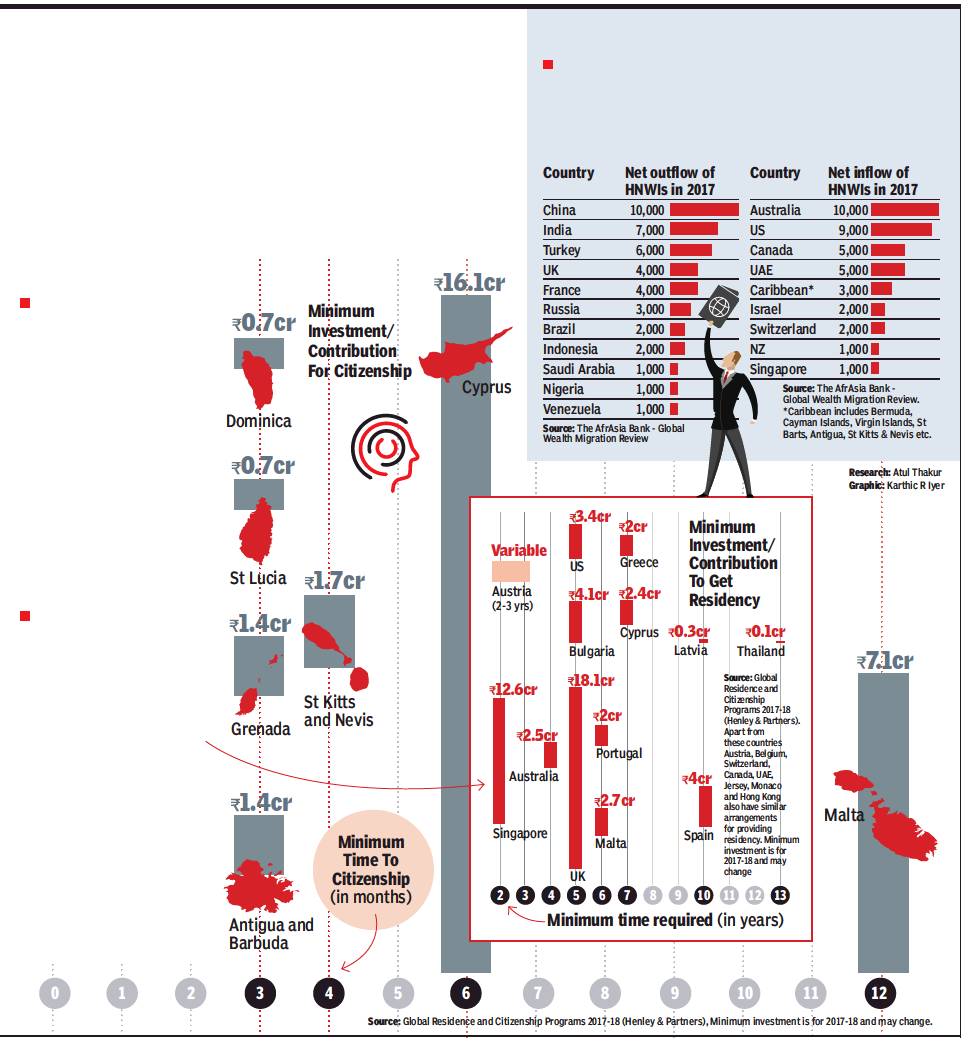
ii) THE countries that they migrate to.
From: How The Rich Buy A New Nationality, July 30, 2018: The Times of India
Fugitive Mehul Choksi bought Antiguan citizenship, and his new passport allows him visa-free entry to over 130 countries. TOI takes a look at how the rich can buy their way to new citizenship and residency
Can citizenship be acquired by investing?
Acquiring citizenship need not be a long-drawn process. Not all nations need you to prove years of residency. Many countries offer the wealthy citizenship-by-investment programmes. This method of granting citizenship was seen as controversial when Caribbean island St Kitts and Nevis pioneered the idea in 1984. But today many countries have followed suit to offer citizenship to well-heeled individuals who donate a fixed amount to the government of their new home or invest over a certain level.
Can permanent residency be acquired by investing?
Many countries that don’t provide citizenship but grant residency to the wealthy if they invest above a certain amount in the local economy. Residency provides unlimited stay and rights enjoyed by locals. These may include benefits like healthcare coverage and the right to work or study. Such residents cannot vote and are not issued passports of their new home nation. Indians, for instance, can apply for Tier 1 (Investor) visa of UK if they are willing to invest GBP 2 million (INR 18.1 cr). Similarly, the process for a US Green Card can be expedited for an individual who invests USD 1 million (or USD 500,000 in rural areas with few jobs) and creates at least 10 new full-time jobs.
Where are the super-rich going and which countries are the biggest losers?
South Africa-based New World Wealth, a global market research group that specialises in wealth statistics, found China followed by India witnessed the highest migration of high net worth individuals (HNWIs) — people with net assets of US$1 million (Rs 6.9cr) or more. The largest recipient of these super rich migrants are Australia, US and Canada.
Immigration (into India)
2010, 2017: Migrants in India

From: February 5, 2019: The Times of India
See graphic:
2010, 2017: Immigrants living in India, China and major countries'
Gulf, Migration to
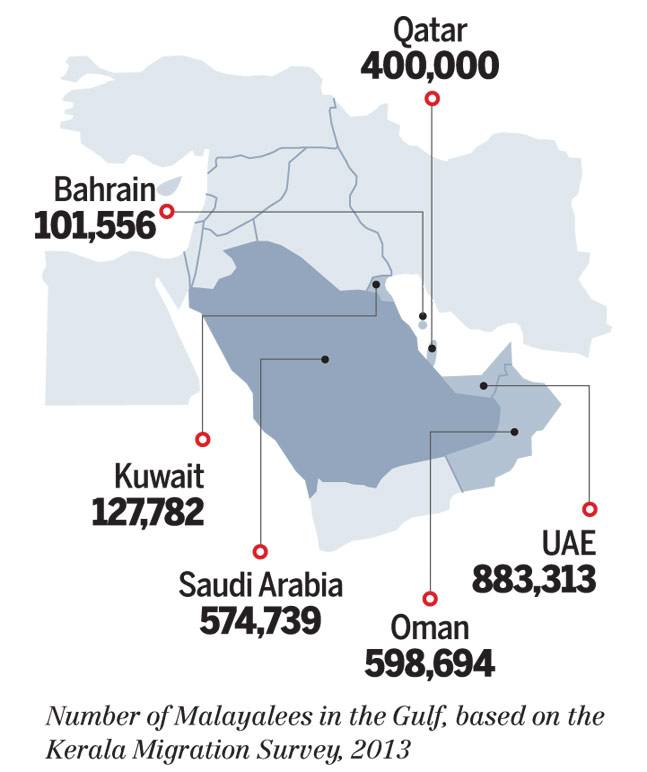
2013: Malayalis in the Gulf
See graphic:
No. of Malayalees in the Gulf
2014> 2018: Migration to Gulf for jobs drops 62%
Lubna Kably, January 12, 2019: The Times of India
Lubna Kably, UAE is top Gulf workplace for Indians, January 12, 2019: The Times of India
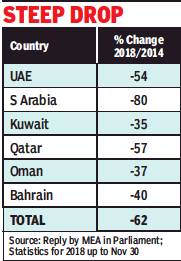
From: Lubna Kably, January 12, 2019: The Times of India
From: Lubna Kably, UAE is top Gulf workplace for Indians, January 12, 2019: The Times of India
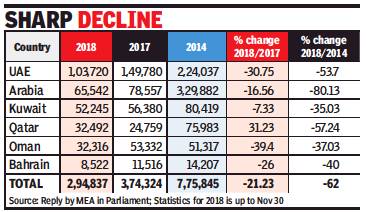
The total number of emigration clearances granted to Indians headed to the Gulf, for employment, has dropped by 21% to stand at about 3 lakh during the 11-month period ended November 30, 2018, compared with the year 2017.
Over the past five years, during 2014, the outflow of Indian workers to Gulf was the highest at about 7.8 lakh. Compared with this figure, the decline in 2018 is as high as 62%. These statistics are drawn from the e-Migrate emigration clearance data, which captures the emigration clearances issued to workers holding ECR (emigration check required) passports.
Among all the Gulf nations, the largest outflow of Indian workers in 2018 was to UAE, with about 1 lakh (or 35%) of the total workers being granted emigration clearances. It was followed by Saudi Arabia and Kuwait with 65,000-odd and 52,000-odd workers headed to these countries.
In 2017, Saudi Arabia had relinquished its position as being the most attractive destination among Gulf countries for Indian workers. In its edition dated August 22, 2017, TOI had analysed the Nitaqat scheme for protection of local workers — the decline in expat workers, including from India is attributed to this scheme and the economic conditions.
Qatar stands out by being the only country in the Gulf region, where the number of workers shows an increase in 2018 as compared to the previous year. Nearly 32,500 workers headed to Qatar were granted emigration clearances, as compared to close to 25,000 in 2017, which is a rise of 31%.
“This could be because of increased labour requirement as the country prepares to host the World Cup, 2022” says a Mumbai based labour recruiter. However, there have been some reports of non-payment to Indian workers by unscrupulous employers, an instance of a construction agency not paying nearly 600 workers was recently in the spotlight. Washington headquartered think-tank, The Middle East Institute, says there are an estimated 6 to 7.50 lakh Indian migrant workers in Qatar, constituting the largest expatriate community and nearly double the number of native Qataris.
According to a reply given by the ministry of external affairs in Lok Sabha last December, there are several reasons for the decrease in numbers. “Prominent among them is that the Gulf countries are passing through a period of economic slowdown primarily because of the slump in oil prices.”
Outward migration from India
2017, 2018: to OECD countries
Lubna Kably, October 20, 2020: The Times of India
From: Lubna Kably, October 20, 2020: The Times of India
India world No. 2 in migrations to OECD nations, getting citizenships
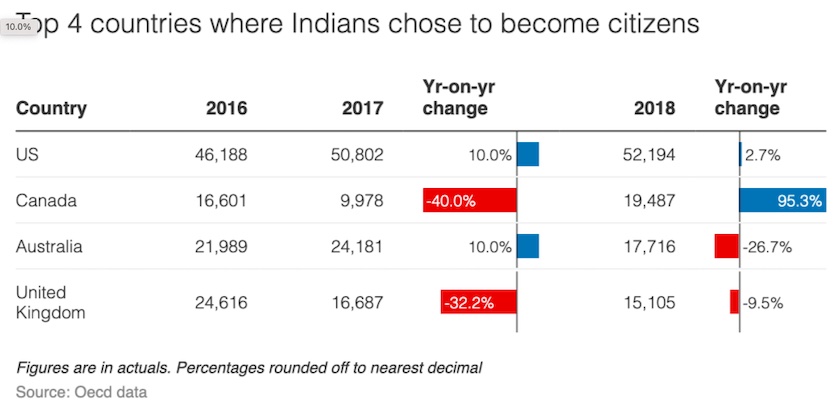
MUMBAI: India has emerged as the second largest source country both in terms of the “total” inflow of new migrants to OECD countries during 2018 and also as regards the number of Indians acquiring citizenship of these countries. While China continued to retain its top slot as the largest source country, India replaced Romania to emerge as the second largest source. During 2018, about 4.3 lakh Chinese migrated to OECD countries, accounting for nearly 6.5% of the total migration inflows.
However, there was a slight decline of 1% as compared to the previous year. On the other hand, migration from India to OECD countries increased sharply by 10% and reached 3.3 lakh. Migration from India represents about 5% of the overall migration to OECD countries. While Canada saw a huge spike in numbers, others such as Germany and Italy also saw more arrivals as compared to the previous year.
Collation of country-wise data shows that the “total” inflow of new migrants to OECD countries was 66 lakh, a slight rise of 3.8% over the previous year. Data on migra tion flows by nationality may include temporary migration for some destination countries, clarifies OECD. The Organisation for Economic Co-operation and Development is an association of 37 member countries, such as European countries, US, Canada, Australia, New Zealand, and Japan.
As these are well-developed economies, they attract a large share of immigrants, be it for work, studies or even asylum. Before the pandemic, permanent migration flows to OECD countries (bar Colombia and Turkey that have hosted a large number of humanitarian migrants in recent years) was 53 lakh in 2019, with similar figures for 2017 and 2018. Permanent migration flows do not include temporary labour migration or international students.
While releasing the “International Migration Outlook 2020” at a virtual press conference on Monday, Angel Gurría, secretary general at OECD, said Covid-19 has redrawn the international mi gration map. Following the onset of Covid-19, almost all OECD countries restricted admission to foreigners. Issuances of new visas in these countries plummeted by 46% in first half of 2020 compared with the same period in 2019. This is the largest drop ever recorded. In the second quarter, the decline was 72%. The secretary general said migration would continue to play a key role for economic growth and innovation, and in responding to rapidly changing labour markets.
2015-16: Educated migrants
November 28, 2020: The Times of India
From: November 28, 2020: The Times of India
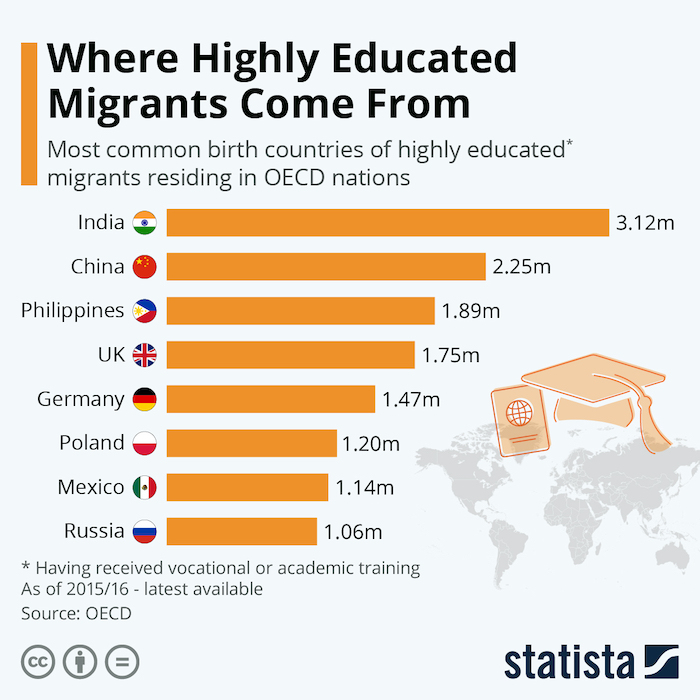
Indians top the list of educated migrants in rich countries OECD data reveals that there are around 120 million migrants living in OECD member countries. 30 to 35 percent of these migrants are considered highly educated, meaning they have received vocational or academic training. Among the most common birth countries for highly educated migrants, these shares are a lot higher, however.
For India, which topped the list as of 2015/16 with more than three million highly educated migrants in the OECD, the share of those considered of high education status was nearly 65 per cent. China had a rate of 48.6 percent highly educated migrants in the OECD – or 2.25 million.
The Philippines come in rank 3, behind the world’s two biggest countries and ahead of a list of OECD nations, naturally trading highly educated personnel back and forth with each other, especially within Europe. 53.3 percent of Filipino immigrants to the OECD are considered highly educated, which brings the total to almost 1.9 million for a country of just over 100 million inhabitants. In a paper on the Philippines, the International Labor Organization finds that many of those high skilled migrants - to OECD countries and elsewhere – were health care professionals, especially nurses. Because of the coronavirus pandemic, the Philippines government has put a stop to this brain drain at least temporarily by capping the deployment of newly hired nurses at 5,000 per year.
Around half of Filipino migrants in the OECD chose the United States, forming one of the most important migration corridors identified by the OECD, behind Mexican and Indian immigration to the United States and ahead of Polish immigration to Germany.
Women migrating abroad
2010
Changing times: More women go abroad to work
Divya A |
June 2010
Deepa Gupta, 22, a mathematics graduate from Ludhiana, thought it a great opportunity to go to a postgraduate course in Michigan University. Two years down the line, she is settled in the US and has been joined by her widowed mother.
Gupta represents a trend — that of Indian women increasingly leaving home turf for professional, rather than personal reasons. The World Bank’s report on ‘Gender, Poverty Reduction and Migration’ says more women from developing countries such as India are migrating to the West independently rather than as dependents. It also says that female migration indirectly helps alleviate poverty.
Neelam Soni, executive with an overseas placement agency in Delhi says women in nursing, teaching, social and voluntary work, the hospitality industry, data-entry operations, sales and even housework are able to migrate to foreign shores.
Social scientist Mala Kapur Shankardass says that even though a large proportion of female migration can still be explained away by marriage (estimates say 80%) it is significant that 20% of all women migrants leave for professional reasons. A decade ago, less than 5% of women migrants worked She says that earlier, male migrants used to belong to the ‘Employed’ category and female to the ‘Not in the Labour Force’. This is changing. Shankardass.
But Shankardass cautions that Indian female contribution to forex remittances is still not properly documented. Official data largely focuses on male remittances.
See also
Migration: India
