Mutual Funds: India
(→Investments in Mutual Funds) |
(→Equity funds) |
||
| (20 intermediate revisions by 2 users not shown) | |||
| Line 6: | Line 6: | ||
|} | |} | ||
| − | [ | + | |
| − | [[Category:Economy-Industry-Resources |M ]] | + | |
| + | |||
| + | |||
| + | = Asset base= | ||
| + | ==2019== | ||
| + | [https://epaper.timesgroup.com/Olive/ODN/TimesOfIndia/shared/ShowArticle.aspx?doc=TOIDEL%2F2019%2F12%2F26&entity=Ar01610&sk=7EFE8867&mode=text Dec 26, 2019: ''The Times of India''] | ||
| + | |||
| + | Mutual funds have added over Rs 4 lakh crore to their asset base in 2019 and the industry expects the growth trajectory to continue in the new year on the back of strong inflows in debt schemes and measures taken by regulator Sebi for boosting investors’ confidence. | ||
| + | |||
| + | It was because of strong inflows into debt-oriented schemes that saved 2019 from being a “dark-dull year of investing” as inflows into equity funds have dropped this year due to a volatile market. | ||
| + | |||
| + | Going ahead, the industry should witness growth in the range of 17-18% in 2020 and equity funds should see robust inflows as expectations are high about improved equity markets and a revival in economic growth, industry body AMFI’s CEO N S Venkatesh said. | ||
| + | |||
| + | The asset under management (AUM) of the industry rose by 18% (Rs 4.2 lakh crore) to an all time high of Rs 27 lakh crore in 2019 by November-end itself, up from Rs 22.9 lakh crore at the end of December 2018, as per the latest data available with the Association of Mutual Funds in India (Amfi). Some industry experts said the final Decemberend figure might be slightly lower than the November-end level, as liquid funds could see some dip due to a quarter-end phenomenon. | ||
| + | |||
| + | Kaustubh Belapurkar, director manager research at Morningstar Investment Adviser India, said, “While the mutual fund industry saw a significant growth post-demonetisation, there has been steady but not spectacular growth in 2019. But given the backdrop of the pessimism due to slowing economic growth, credit crisis and volatile markets, this growth is quite admirable.” | ||
| + | |||
| + | The investor count is estimated to have grown by over 62 lakh | ||
| + | during 2019, to 8.65 crore this year. In 2018, investors’ folio grew by more than 1.3 crore. | ||
| + | |||
| + | The 18% AUM growth seen by the 44-member mutual fund industry in 2019 is higher than 7.5% witnessed in 2018. However, the growth was much higher at 32% in 2017, when the asset base expanded by over Rs 5.4 lakh. Kotal Mahindra AMC MD and CEO Nilesh Shah attributed the growth to three factors — first, Sebi, as a regulator, consistently created rules and regulations that boosted investors’ confidence in the industry, then to distributors and thirdly to the mutual funds for managing risk-return balance well. AGENCIES | ||
| + | |||
| + | [[Category:Economy-Industry-Resources|M MUTUAL FUNDS: INDIAMUTUAL FUNDS: INDIAMUTUAL FUNDS: INDIAMUTUAL FUNDS: INDIA | ||
| + | MUTUAL FUNDS: INDIA]] | ||
| + | [[Category:India|M MUTUAL FUNDS: INDIAMUTUAL FUNDS: INDIAMUTUAL FUNDS: INDIAMUTUAL FUNDS: INDIA | ||
| + | MUTUAL FUNDS: INDIA]] | ||
| + | [[Category:Pages with broken file links|MUTUAL FUNDS: INDIAMUTUAL FUNDS: INDIAMUTUAL FUNDS: INDIAMUTUAL FUNDS: INDIAMUTUAL FUNDS: INDIA | ||
| + | MUTUAL FUNDS: INDIA]] | ||
=Asset management= | =Asset management= | ||
| + | ==Growth of assets under management (AUM)== | ||
| + | ===1999-2018 === | ||
| + | [https://epaper.timesgroup.com/Olive/ODN/TimesOfIndia/shared/ShowArticle.aspx?doc=TOIDEL%2F2018%2F09%2F08&entity=Ar02312&sk=2BA87BCE&mode=text MF assets at record ₹25L cr on retail push, September 8, 2018: ''The Times of India''] | ||
| + | |||
| + | [[File: Assets under management (AUM) milestones, 1999-2018.jpg|Assets under management (AUM) milestones, 1999-2018 <br/> From: [https://epaper.timesgroup.com/Olive/ODN/TimesOfIndia/shared/ShowArticle.aspx?doc=TOIDEL%2F2018%2F09%2F08&entity=Ar02312&sk=2BA87BCE&mode=text MF assets at record ₹25L cr on retail push, September 8, 2018: ''The Times of India'']|frame|500px]] | ||
| + | |||
| + | Assets managed by mutual funds (MFs) in the country crossed the Rs 25-lakhcrore milestone at the end of August, helped by strong participation of retail investors in the last few years and substantial inflow into liquid funds from corporates last month. From Rs 23.1 lakh crore at the end of July, assets under management (AUM) of the 42 fund houses together was Rs 25.2 lakh crore on August 31, data by industry trade body AMFI showed. | ||
| + | |||
| + | As of August 2017, the AUM was Rs 20.2 lakh crore. | ||
| + | |||
| + | According to AMFI CEO N S Venkatesh, the monthly rise in AUM was because of the industry body’s investor awareness campaign and strong participation from retail investors. About a year ago, AMFI, on behalf of the MF industry, had launched an awareness campaign with the tag line ‘Mutual funds sahi hai’, which has now emerged to be popular among Indians. | ||
| + | |||
| + | Retail investors have also been putting money in mutual funds schemes, especially in those that invested mainly in shares through the systematic investment plan (SIP) route. As of August, inflows through SIPs were nearly Rs 7,700 crore, compared to Rs 4,947 crore in August 2017 and Rs 3,334 crore as of August 2016, AMFI data showed. | ||
| + | |||
| + | ===2017-21=== | ||
| + | [[File: Growth of assets under management, 2017-21.jpg| Growth of assets under management, 2017-21 <br/> From: [https://epaper.timesgroup.com/Olive/ODN/TimesOfIndia/shared/ShowArticle.aspx?doc=TOIDEL/2021/08/10&entity=Ar01909&sk=1EB320E0&mode=text August 10, 2021: ''The Times of India'']|frame|500px]] | ||
| + | |||
| + | '''See graphic''': | ||
| + | |||
| + | '' Growth of assets under management, 2017-21 '' | ||
| + | |||
| + | [[Category:Economy-Industry-Resources|M MUTUAL FUNDS: INDIAMUTUAL FUNDS: INDIAMUTUAL FUNDS: INDIA | ||
| + | MUTUAL FUNDS: INDIA]] | ||
| + | [[Category:India|M MUTUAL FUNDS: INDIAMUTUAL FUNDS: INDIAMUTUAL FUNDS: INDIA | ||
| + | MUTUAL FUNDS: INDIA]] | ||
| + | [[Category:Pages with broken file links|MUTUAL FUNDS: INDIAMUTUAL FUNDS: INDIAMUTUAL FUNDS: INDIAMUTUAL FUNDS: INDIA | ||
| + | MUTUAL FUNDS: INDIA]] | ||
| + | |||
==2018: IDFC looks to exit Asset management== | ==2018: IDFC looks to exit Asset management== | ||
[https://epaper.timesgroup.com/Olive/ODN/TimesOfIndia/shared/ShowArticle.aspx?doc=TOIDEL%2F2018%2F03%2F22&entity=Ar02302&sk=B8535EAB&mode=text Boby Kurian, Mayur Shetty & Partha Sinha, IDFC looks to exit asset mgmt biz in ₹4,000cr deal, March 22, 2018: ''The Times of India''] | [https://epaper.timesgroup.com/Olive/ODN/TimesOfIndia/shared/ShowArticle.aspx?doc=TOIDEL%2F2018%2F03%2F22&entity=Ar02302&sk=B8535EAB&mode=text Boby Kurian, Mayur Shetty & Partha Sinha, IDFC looks to exit asset mgmt biz in ₹4,000cr deal, March 22, 2018: ''The Times of India''] | ||
| Line 33: | Line 88: | ||
The value-unlocking moves should also be seen in the context of some IDFC shareholders being unhappy with the lackadaisical share price, which they believe is trading at more than 50% discount to its intrinsic fair value. The stock closed at Rs 50 apiece in Mumbai trade. | The value-unlocking moves should also be seen in the context of some IDFC shareholders being unhappy with the lackadaisical share price, which they believe is trading at more than 50% discount to its intrinsic fair value. The stock closed at Rs 50 apiece in Mumbai trade. | ||
| − | =Categorisation= | + | =Categorisation, SEBI's= |
==2018== | ==2018== | ||
[https://epaper.timesgroup.com/Olive/ODN/TimesOfIndia/shared/ShowArticle.aspx?doc=TOIDEL%2F2018%2F05%2F14&entity=Ar01505&sk=4D870843&mode=text Partha Sinha, MFs’ rejig: Don’t redeem in panic, May 14, 2018: ''The Times of India''] | [https://epaper.timesgroup.com/Olive/ODN/TimesOfIndia/shared/ShowArticle.aspx?doc=TOIDEL%2F2018%2F05%2F14&entity=Ar01505&sk=4D870843&mode=text Partha Sinha, MFs’ rejig: Don’t redeem in panic, May 14, 2018: ''The Times of India''] | ||
| Line 53: | Line 108: | ||
Second, some unscrupulous distributors are telling investors that they should exit their existing investments and enter some new ones so that the distributors can make some money. Investors should be careful about this, too, financial advisers and planners said. | Second, some unscrupulous distributors are telling investors that they should exit their existing investments and enter some new ones so that the distributors can make some money. Investors should be careful about this, too, financial advisers and planners said. | ||
| + | |||
| + | [[Category:Economy-Industry-Resources|M MUTUAL FUNDS: INDIAMUTUAL FUNDS: INDIAMUTUAL FUNDS: INDIA | ||
| + | MUTUAL FUNDS: INDIA]] | ||
| + | [[Category:India|M MUTUAL FUNDS: INDIAMUTUAL FUNDS: INDIAMUTUAL FUNDS: INDIA | ||
| + | MUTUAL FUNDS: INDIA]] | ||
| + | |||
=CEO remunerations= | =CEO remunerations= | ||
| Line 71: | Line 132: | ||
The annual salary of Jain, however, remained the highest in the industry among fund managers. Incidentally , HDFC MF's average AUM in the equity category increased 18.4% yo-y to Rs 80,592 crore while ICICI Prudential's average AUM surged 33% y-o-y to Rs 77,223 crore for 2016-17. MFs would not disclose the remuneration paid to its star fund managers earlier. They would disclose compensation paid to key managerial personnel (KMP), which included the MD. Interestingly , KMP included the MD and CEO, CFO and company secretary and not CIOs who run the fund management business. | The annual salary of Jain, however, remained the highest in the industry among fund managers. Incidentally , HDFC MF's average AUM in the equity category increased 18.4% yo-y to Rs 80,592 crore while ICICI Prudential's average AUM surged 33% y-o-y to Rs 77,223 crore for 2016-17. MFs would not disclose the remuneration paid to its star fund managers earlier. They would disclose compensation paid to key managerial personnel (KMP), which included the MD. Interestingly , KMP included the MD and CEO, CFO and company secretary and not CIOs who run the fund management business. | ||
| + | |||
| + | =Closure of schemes= | ||
| + | == investors have final say: SC== | ||
| + | [https://epaper.timesgroup.com/Olive/ODN/TimesOfIndia/shared/ShowArticle.aspx?doc=TOIDEL/2021/07/15&entity=Ar01903&sk=FB9011C1&mode=text July 15, 2021: ''The Times of India''] | ||
| + | |||
| + | [[File: Empowering investors.jpg|Empowering investors <br/> From: [https://epaper.timesgroup.com/Olive/ODN/TimesOfIndia/shared/ShowArticle.aspx?doc=TOIDEL/2021/07/15&entity=Ar01903&sk=FB9011C1&mode=text July 15, 2021: ''The Times of India'']|frame|500px]] | ||
| + | |||
| + | The Supreme Court empowered investors in a mutual fund scheme to have the final say on its closure after trustees who manage it give a “reasoned nod” for winding it up. Under present rules, trustees alone have the right to decide on the closure of a scheme. | ||
| + | |||
| + | The landmark verdict came in the case relating to the winding-up of Franklin Templeton MF’s six debt schemes. In April 2020, Franklin Templeton MF’s trustees had agreed to close down the schemes due to a severe liquidity crunch in the debt market after a Covid-induced lockdown. The SC also upheld the validity of Sebi’s mutual fund regulation under which these schemes are being closed down. The court held that Sebi can look into the decision of the trustees in case of a closure of a scheme. | ||
| + | |||
| + | The SC judgment came on an appeal filed by Franklin Templeton MF against a Karnataka high court order that had asked the fund house to get the consent of its investors by a simple majority to its decision to wind up the six schemes. Some aggrieved investors had also moved SC challenging the validity of Sebi’s MF regulations. | ||
| + | |||
| + | In their 77-page order, Justices S Abdul Nazeer and Sanjiv Khanna dealt with the interpretation of Sebi’s rules and regulations related to the issue of winding up of a scheme and the process followed. They also said that to start the windingup process, the trustees should give a public notice in newspapers to disclose circumstances leading to their decision to close the scheme. | ||
| + | |||
| + | Justice Khanna said that they had “reservations on the said observations (of Karnataka HC) for the simple reason that if there is a violation of the regulations...by the trustees or AMC, it is open to Sebi to proceed in accordance with the law”. | ||
| + | |||
| + | The apex court said that Sebi had the powers to pass directions under Sections 11 and 11B of the Sebi Act which deal with the protection of investors’ interests. SC, however, said that trustees need not take prior approval of Sebi while deciding to close a scheme. | ||
| + | |||
| + | On February 12, the SC had allowed the e-voting process for winding up of six MF schemes. In December last year, the investors had voted their consent to the decision to close down the six schemes but the final results of the voting was not disclosed till February 12 under the apex court’s order. | ||
| + | |||
| + | The SC had also allowed disbursal of funds to investors in these schemes under the supervision of SBI MF. According to the disbursal schedule, by the end of the week nearly Rs 21,100 crore would have been distributed to the investors of the six FTMF schemes. | ||
| + | |||
| + | [[Category:Economy-Industry-Resources|M MUTUAL FUNDS: INDIAMUTUAL FUNDS: INDIAMUTUAL FUNDS: INDIA | ||
| + | MUTUAL FUNDS: INDIA]] | ||
| + | [[Category:India|M MUTUAL FUNDS: INDIAMUTUAL FUNDS: INDIAMUTUAL FUNDS: INDIA | ||
| + | MUTUAL FUNDS: INDIA]] | ||
| + | [[Category:Pages with broken file links|MUTUAL FUNDS: INDIAMUTUAL FUNDS: INDIAMUTUAL FUNDS: INDIAMUTUAL FUNDS: INDIA | ||
| + | MUTUAL FUNDS: INDIA]] | ||
| + | |||
| + | =Equity funds= | ||
| + | ==2008-19 == | ||
| + | [[File: Funds mobilisation from equity markets, 2008-19.jpg|Funds mobilisation from equity markets, 2008-19 <br/> From: [https://epaper.timesgroup.com/Olive/ODN/TimesOfIndia/shared/ShowArticle.aspx?doc=TOIDEL%2F2019%2F04%2F01&entity=Ar01706&sk=6B371A7D&mode=text Allirajan M, Equity fund-raise plunges 68% in FY19 on poor IPOs, April 1, 2019: ''The Times of India'']|frame|500px]] | ||
| + | |||
| + | '''See graphic''': | ||
| + | |||
| + | ''Funds mobilisation from equity markets, 2008-19'' | ||
| + | |||
| + | |||
| + | ==2019: 68% decline on poor IPOs== | ||
| + | [https://epaper.timesgroup.com/Olive/ODN/TimesOfIndia/shared/ShowArticle.aspx?doc=TOIDEL%2F2019%2F04%2F01&entity=Ar01706&sk=6B371A7D&mode=text Allirajan M, Equity fund-raise plunges 68% in FY19 on poor IPOs, April 1, 2019: ''The Times of India''] | ||
| + | |||
| + | |||
| + | Fund-raising from equity markets fell 68% y-o-y to Rs 56,440 crore in FY19 due to the poor show by IPOs. The slump comes after a robust performance in FY18 when fund-raising from equity markets and IPOs hit a record high. | ||
| + | |||
| + | Funds mobilised through IPOs plunged 81% y-o-y to Rs 16,294 crore in 2018-19. The response to IPOs was affected by poor listing performance, said Pranav Haldea, managing director, PRIME Database. Of the 13 IPOs which got listed (RVNL is yet to be listed), only two gave a return of over 10% (based on the closing price on listing date). HDFC Asset Management gave a robust return of 65% and was followed by RITES at 15%. | ||
| + | |||
| + | Fund-raising in 2019-20 would be significantly impacted by the outcome of the general elections, Haldea said. | ||
| + | |||
| + | =Growth of mutual funds= | ||
| + | ==2013 – 23== | ||
| + | [[File: Mutual Fund growth in India, 2013- 23.jpg|Mutual Fund growth in India, 2013- 23 <br/> From: [January 11, 2024: ''The Times of India'']|frame|500px]] | ||
| + | |||
| + | '''See graphic''': | ||
| + | |||
| + | '' Mutual Fund growth in India, 2013- 23 '' | ||
| + | |||
| + | [[Category:Economy-Industry-Resources|M MUTUAL FUNDS: INDIAMUTUAL FUNDS: INDIAMUTUAL FUNDS: INDIAMUTUAL FUNDS: INDIA | ||
| + | MUTUAL FUNDS: INDIA]] | ||
| + | [[Category:India|M MUTUAL FUNDS: INDIAMUTUAL FUNDS: INDIAMUTUAL FUNDS: INDIAMUTUAL FUNDS: INDIA | ||
| + | MUTUAL FUNDS: INDIA]] | ||
| + | [[Category:Pages with broken file links|MUTUAL FUNDS: INDIAMUTUAL FUNDS: INDIAMUTUAL FUNDS: INDIAMUTUAL FUNDS: INDIAMUTUAL FUNDS: INDIA | ||
| + | MUTUAL FUNDS: INDIA]] | ||
= Investments by Mutual Funds = | = Investments by Mutual Funds = | ||
| Line 81: | Line 205: | ||
=Investments in Mutual Funds= | =Investments in Mutual Funds= | ||
| − | ==2007-18== | + | ==Retail investors' share in MFs== |
| + | ===2007-18=== | ||
[[File: Retail investors' share in mutual funds doubles in 4 years.jpg|Retail investors' share in mutual funds doubles in 4 years <br/> From: [https://epaper.timesgroup.com/Olive/ODN/TimesOfIndia/shared/ShowArticle.aspx?doc=TOIDEL%2F2018%2F08%2F08&entity=Ar02922&sk=56534CCB&mode=image August 8, 2018: ''The Times of India'']|frame|500px]] | [[File: Retail investors' share in mutual funds doubles in 4 years.jpg|Retail investors' share in mutual funds doubles in 4 years <br/> From: [https://epaper.timesgroup.com/Olive/ODN/TimesOfIndia/shared/ShowArticle.aspx?doc=TOIDEL%2F2018%2F08%2F08&entity=Ar02922&sk=56534CCB&mode=image August 8, 2018: ''The Times of India'']|frame|500px]] | ||
| Line 88: | Line 213: | ||
''Retail investors' share in mutual funds doubles in 4 years'' | ''Retail investors' share in mutual funds doubles in 4 years'' | ||
| − | + | [[Category:Economy-Industry-Resources|M MUTUAL FUNDS: INDIAMUTUAL FUNDS: INDIAMUTUAL FUNDS: INDIA | |
| + | MUTUAL FUNDS: INDIA]] | ||
| + | [[Category:India|M MUTUAL FUNDS: INDIAMUTUAL FUNDS: INDIAMUTUAL FUNDS: INDIA | ||
| + | MUTUAL FUNDS: INDIA]] | ||
| + | [[Category:Pages with broken file links|MUTUAL FUNDS: INDIAMUTUAL FUNDS: INDIAMUTUAL FUNDS: INDIAMUTUAL FUNDS: INDIA | ||
| + | MUTUAL FUNDS: INDIA]] | ||
| + | |||
| + | ==Growth of SIPs/ MFs vs. bank FDs == | ||
| + | ===2014-18=== | ||
[https://epaper.timesgroup.com/Olive/ODN/TimesOfIndia/shared/ShowArticle.aspx?doc=TOIDEL%2F2018%2F05%2F28&entity=Ar01701&sk=307F04F0&mode=text Allirajan M, MFs now nearly a fifth of FDs as small towns take SIP of equity funds, May 28, 2018: ''The Times of India''] | [https://epaper.timesgroup.com/Olive/ODN/TimesOfIndia/shared/ShowArticle.aspx?doc=TOIDEL%2F2018%2F05%2F28&entity=Ar01701&sk=307F04F0&mode=text Allirajan M, MFs now nearly a fifth of FDs as small towns take SIP of equity funds, May 28, 2018: ''The Times of India''] | ||
| Line 116: | Line 249: | ||
Like FDs, gold and real estate have also given abysmal returns in recent years. Suresh Sadagopan, founder of Ladder7 Financial Advisories, said, “People are investing in MFs through SIPs as physical assets such as gold and property have not been doing well for quite some time.” | Like FDs, gold and real estate have also given abysmal returns in recent years. Suresh Sadagopan, founder of Ladder7 Financial Advisories, said, “People are investing in MFs through SIPs as physical assets such as gold and property have not been doing well for quite some time.” | ||
| + | [[Category:Economy-Industry-Resources|M MUTUAL FUNDS: INDIAMUTUAL FUNDS: INDIAMUTUAL FUNDS: INDIA | ||
| + | MUTUAL FUNDS: INDIA]] | ||
| + | [[Category:India|M MUTUAL FUNDS: INDIAMUTUAL FUNDS: INDIAMUTUAL FUNDS: INDIA | ||
| + | MUTUAL FUNDS: INDIA]] | ||
| + | [[Category:Pages with broken file links|MUTUAL FUNDS: INDIA | ||
| + | MUTUAL FUNDS: INDIA]] | ||
| − | == | + | ==Equity MFs vsFIIs== |
| + | ===2015=== | ||
[[File: 2007-2015, investments in mutual funds, and investments by FIIs in equities.jpg|2007-2015, investments in mutual funds, and investments by FIIs in equities; Graphic courtesy: [http://epaperbeta.timesofindia.com//Article.aspx?eid=31808&articlexml=Equity-MF-investors-beat-FIIs-in-15-20112015023019 ''The Times of India''], November 20, 2015|frame|500px]] | [[File: 2007-2015, investments in mutual funds, and investments by FIIs in equities.jpg|2007-2015, investments in mutual funds, and investments by FIIs in equities; Graphic courtesy: [http://epaperbeta.timesofindia.com//Article.aspx?eid=31808&articlexml=Equity-MF-investors-beat-FIIs-in-15-20112015023019 ''The Times of India''], November 20, 2015|frame|500px]] | ||
| Line 138: | Line 278: | ||
Barring odd instances such as the market meltdown in 2008 when the rout that followed the global financial crisis triggered a massive pullout by FIIs, overseas investors have stood head and shoulders above their domestic peers in investments into Indian stocks. | Barring odd instances such as the market meltdown in 2008 when the rout that followed the global financial crisis triggered a massive pullout by FIIs, overseas investors have stood head and shoulders above their domestic peers in investments into Indian stocks. | ||
| − | == | + | [[Category:Economy-Industry-Resources|M MUTUAL FUNDS: INDIAMUTUAL FUNDS: INDIAMUTUAL FUNDS: INDIA |
| + | MUTUAL FUNDS: INDIA]] | ||
| + | [[Category:India|M MUTUAL FUNDS: INDIAMUTUAL FUNDS: INDIAMUTUAL FUNDS: INDIA | ||
| + | MUTUAL FUNDS: INDIA]] | ||
| + | [[Category:Pages with broken file links|MUTUAL FUNDS: INDIAMUTUAL FUNDS: INDIA | ||
| + | MUTUAL FUNDS: INDIA]] | ||
| + | |||
| + | == AUM as % of m-cap == | ||
| + | ===May 2018 (at 5.4%)=== | ||
[https://epaper.timesgroup.com/Olive/ODN/TimesOfIndia/shared/ShowArticle.aspx?doc=TOIDEL%2F2018%2F06%2F19&entity=Ar02016&sk=11476548&mode=text Allirajan M, Equity MF assets to market cap at all-time high, June 19, 2018: ''The Times of India''] | [https://epaper.timesgroup.com/Olive/ODN/TimesOfIndia/shared/ShowArticle.aspx?doc=TOIDEL%2F2018%2F06%2F19&entity=Ar02016&sk=11476548&mode=text Allirajan M, Equity MF assets to market cap at all-time high, June 19, 2018: ''The Times of India''] | ||
| Line 148: | Line 296: | ||
With retail investors participating in the stock market rally in zest, equity MF AUM as a percentage of India’s stock market capitalisation touched 5% for the first time in September last year. The m-cap of all companies listed on the BSE (Bombay Stock Exchange) grew 18.25% y-o-y or by ₹23 lakh crore to ₹149 lakh crore in September. The equity MF AUMto-market capitalisation ratio was hovering around the 4% mark for about 18 months starting September 2015. | With retail investors participating in the stock market rally in zest, equity MF AUM as a percentage of India’s stock market capitalisation touched 5% for the first time in September last year. The m-cap of all companies listed on the BSE (Bombay Stock Exchange) grew 18.25% y-o-y or by ₹23 lakh crore to ₹149 lakh crore in September. The equity MF AUMto-market capitalisation ratio was hovering around the 4% mark for about 18 months starting September 2015. | ||
| + | |||
| + | [[Category:Economy-Industry-Resources|M MUTUAL FUNDS: INDIAMUTUAL FUNDS: INDIAMUTUAL FUNDS: INDIA | ||
| + | MUTUAL FUNDS: INDIA]] | ||
| + | [[Category:India|M MUTUAL FUNDS: INDIAMUTUAL FUNDS: INDIAMUTUAL FUNDS: INDIA | ||
| + | MUTUAL FUNDS: INDIA]] | ||
| + | [[Category:Pages with broken file links|MUTUAL FUNDS: INDIAMUTUAL FUNDS: INDIAMUTUAL FUNDS: INDIA | ||
| + | MUTUAL FUNDS: INDIA]] | ||
=Investors’ rights and duties= | =Investors’ rights and duties= | ||
| Line 194: | Line 349: | ||
''Duties of a responsible investor'' | ''Duties of a responsible investor'' | ||
| + | |||
| + | =NBFCs, investments in/ exposure to= | ||
| + | [[File: Mutual Fund's exposure to NBFCs, August 2018- June 2020.jpg|Mutual Fund's exposure to NBFCs, August 2018- June 2020 <br/> From: [https://epaper.timesgroup.com/Olive/ODN/TimesOfIndia/shared/ShowArticle.aspx?doc=TOIDEL%2F2020%2F08%2F21&entity=Ar01307&sk=F5BF7D74&mode=image August 21, 2020: ''The Times of India'']|frame|500px]] | ||
| + | |||
| + | '''See graphic''': | ||
| + | |||
| + | '' Mutual Fund's exposure to NBFCs, August 2018- June 2020 '' | ||
| + | |||
| + | =Net asset values (NAVs)= | ||
| + | ==How default leads to crash in NAVs== | ||
| + | [https://epaper.timesgroup.com/olive/ODN/TimesOfIndia/shared/ShowArticle.aspx?doc=TOIDEL%2F2019%2F06%2F06&entity=Ar01711&sk=A945BB59&mode=text June 6, 2019: ''The Times of India''] | ||
| + | |||
| + | |||
| + | After debt-laden mortgage lender Dewan Housing Finance (DHFL) failed to pay on its bonds on Tuesday, net asset values (NAVs) of several debt funds — including those run by top MFs — crashed. On Wednesday, ratings agencies Crisil And ICRA downgraded commercial papers issued by the company. Here’s the lowdown on the latest troubles in the debt fund segment and what can investors do to safeguard their money... | ||
| + | |||
| + | '''What’s the DHFL crisis about?''' | ||
| + | |||
| + | The genesis of the DHFL crisis is systemic to the Indian debt market system rather than specific to the company. DHFL has substantial short-term loans to repay to holders of bonds and FDs, among others. The company has given home loans, advances against property and also lent to real estate developers, which usually take several years to be recovered. It needs to pay back some of its bond and FD holders, but most of its money is long-term loans. So it’s now selling off parts of the businesses, like affordable housing finance company and mutual fund, to raise money to pay back bond and FD holders. | ||
| + | |||
| + | '''Why NAVs of debt funds fall drastically in case one of its portfolio companies default in payment on its bonds?''' | ||
| + | |||
| + | When the bonds issued by one firm forms a large portion of the fund’s portfolio, a default in it leads to a crash in the NAV of its holding debt fund. This is because under Sebi rules, as soon as a company defaults, the bonds issued by it should be valued at 25% of its original value — that is, a 75% markdown. Over the next 15 days, rating agencies — Crisil and ICRA — are mandated to independently look into each bond issued by that company and give their opinion on the present value of those bonds that each fund manager is liable to accept. | ||
| + | |||
| + | '''What happens after the initial 75% markdown?''' | ||
| + | |||
| + | For example, a fund has Rs 100 crore worth of bonds issued by a company X, which defaults on its payment. The day the company X defaults, those bonds worth Rs 100 crore will be valued at Rs 25 crore (under Sebi rules). Now, if this debt scheme’s total portfolio size was Rs 300 crore, the bonds of company X at Rs 100 crore formed 33% of its portfolio. With Rs 75 crore gone due to the downgrade, the scheme’s NAV will fall by 25% in a single day. So the larger the holding of a bond in default, the bigger would be the fall in NAV on the day after the default. | ||
| + | |||
| + | '''How long does it take for the NAV to recover?''' | ||
| + | |||
| + | After the revaluation by rating agencies as mandated by Sebi, in most cases, the value of bonds in default are seen to be much higher than just 25% of their original (after the markdown). So investors could reasonably expect some smart recovery in NAVs after rating agencies give their valuation opinion. | ||
| + | |||
| + | '''Do NAVs of all funds recover?''' | ||
| + | |||
| + | In case the company is backed by sound business or assets, usually NAVs recoup their losses within 15 days. But a sharp recovery in NAVs does not happen in case of companies with no or bad assets. Mutual fund managers, however, don’t invest in such companies in the first place. | ||
| + | |||
| + | [[Category:Economy-Industry-Resources|M MUTUAL FUNDS: INDIAMUTUAL FUNDS: INDIA | ||
| + | MUTUAL FUNDS: INDIA]] | ||
| + | [[Category:India|M MUTUAL FUNDS: INDIAMUTUAL FUNDS: INDIA | ||
| + | MUTUAL FUNDS: INDIA]] | ||
| + | |||
| + | =Penetration by MFs= | ||
| + | ==India vis-à-vis the world, 2018== | ||
| + | [https://timesofindia.indiatimes.com/business/mutual-funds-penetration-dismal-in-india/articleshow/67448567.cms Mutual funds' penetration dismally low in India, January 9, 2019: ''The Times of India''] | ||
| + | |||
| + | [[File: Penetration by MFs in India and other major countries, presumably as in 2018.jpg|Penetration by MFs in India and other major countries, presumably as in 2018 <br/> From: [https://timesofindia.indiatimes.com/business/mutual-funds-penetration-dismal-in-india/articleshow/67448567.cms Mutual funds' penetration dismally low in India, January 9, 2019: ''The Times of India'']|frame|500px]] | ||
| + | |||
| + | |||
| + | '''See graphic''': | ||
| + | |||
| + | ''Penetration by MFs in India and other major countries, presumably as in 2018'' | ||
| + | |||
| + | Despite the record inflows into mutual funds, their penetration in India remains dismally low compared to other nations. India's mutual funds' penetration is just 11% of GDP while it is 49% in South Africa and 59% in Brazil. But the low penetration also indicates that their is vast untapped potential. Here's a look at how popular mutual funds are around the world. | ||
| + | |||
| + | =Performance= | ||
| + | ==2017: MFs investing in USA beat those investing only in India== | ||
| + | [https://epaper.timesgroup.com/Olive/ODN/TimesOfIndia/shared/ShowArticle.aspx?doc=TOIDEL%2F2018%2F10%2F12&entity=Ar02607&sk=CBBC792D&mode=text Allirajan M, MFs investing in US mkts beat desi funds, October 12, 2018: ''The Times of India''] | ||
| + | |||
| + | |||
| + | With the rupee depreciating sharply against the US dollar and developed markets faring much better than domestic stock indices, equity mutual funds (MFs) that invest in the US stock markets have emerged as one of the best performers. | ||
| + | |||
| + | Equity MFs, which invest exclusively in shares of companies listed in the US bourses, have surged 20-36% in the last one year, the second-best performance in the equities category. | ||
| + | |||
| + | Equity MFs with exposure only to shares of IT (information technology) companies, alone have fared better. MFs, which deploy money in the US market, have emerged on the top of the performance charts in the ‘Equity MF International’ category, which comprises funds that invest across major global markets. | ||
| + | |||
| + | The rupee has fallen about 14.3% so far in 2018, the worst performance among Asian currencies. | ||
| + | |||
| + | A sharply depreciating rupee boosts the returns of MFs that buy into the US stock markets as the shares are priced in dollars. Moreover, the US stock markets have seen a robust rally with key indices delivering higher returns than Indian markets. While the NASDAQ-100 index has surged 16.2% in the last one year, the S&P 500 index has gained 9.2% during the timeframe. | ||
| + | |||
| + | In contrast, the benchmark Sensex and the broadbased Nifty have advanced by only 2.1% and 4.4% respectively in the last one year. Equity MF schemes with substantial exposure to stocks of technology-driven behemoths such as Apple and Amazon have given substantially higher returns than others in the category, data with Value Research, which tracks MFs showed. | ||
| + | |||
| + | =Returns= | ||
| + | ==From SIPs, 1999-2019; debt funds, 2005-19== | ||
| + | [[File: Returns from SIPs, 1999-2019.jpg|Returns from SIPs, 1999-2019 <br/> From: [https://epaper.timesgroup.com/Olive/ODN/TimesOfIndia/shared/ShowArticle.aspx?doc=TOIDEL%2F2019%2F08%2F19&entity=Ar01601&sk=F274CF55&mode=text NARENDRA NATHAN, August 19, 2019: ''The Times of India'']|frame|500px]] | ||
| + | |||
| + | [[File: Returns from debt funds, 2005-19.jpg| Returns from debt funds, 2005-19 <br/> From: [https://epaper.timesgroup.com/Olive/ODN/TimesOfIndia/shared/ShowArticle.aspx?doc=TOIDEL%2F2019%2F08%2F19&entity=Ar01601&sk=F274CF55&mode=text NARENDRA NATHAN, August 19, 2019: ''The Times of India'']|frame|500px]] | ||
| + | |||
| + | |||
| + | ''' See graphics ''' : | ||
| + | |||
| + | '' Returns from SIPs, 1999-2019 '' | ||
| + | |||
| + | '' Returns from debt funds, 2005-19 '' | ||
| + | |||
| + | ==2015-2020== | ||
| + | [[File: Mutual funds’ returns, 2015-2020.jpg| Mutual funds’ returns, 2015-2020 <br/> From: [https://epaper.timesgroup.com/olive/ODN/TimesOfIndia/shared/ShowArticle.aspx?doc=TOIDEL%2F2020%2F03%2F14&entity=Ar02517&sk=4678AB53&mode=text March 14, 2020: ''The Times of India'']|frame|500px]] | ||
| + | |||
| + | '''See graphic''': | ||
| + | |||
| + | '' Mutual funds’ returns, 2015-2020. '' | ||
| + | |||
| + | [[Category:Economy-Industry-Resources|M MUTUAL FUNDS: INDIAMUTUAL FUNDS: INDIA | ||
| + | MUTUAL FUNDS: INDIA]] | ||
| + | [[Category:India|M MUTUAL FUNDS: INDIAMUTUAL FUNDS: INDIA | ||
| + | MUTUAL FUNDS: INDIA]] | ||
=See also= | =See also= | ||
| − | [[Sensex ]] <> [[The stock market: India]] <> [[Mutual Funds: India ]] <> [[ | + | [[Investments and savings (personal): India]] <> |
| + | |||
| + | [[Sensex ]] <> | ||
| + | |||
| + | [[The stock market: India]] <> | ||
| + | |||
| + | [[Mutual Funds: India ]] <> | ||
| + | |||
| + | [[Currency: India ]] <> | ||
| + | |||
| + | [[Chief Executive Officers: India]] | ||
| + | |||
| + | [[Category:Economy-Industry-Resources|M MUTUAL FUNDS: INDIAMUTUAL FUNDS: INDIAMUTUAL FUNDS: INDIA | ||
| + | MUTUAL FUNDS: INDIA]] | ||
| + | [[Category:India|M MUTUAL FUNDS: INDIAMUTUAL FUNDS: INDIAMUTUAL FUNDS: INDIA | ||
| + | MUTUAL FUNDS: INDIA]] | ||
| + | [[Category:Pages with broken file links|MUTUAL FUNDS: INDIAMUTUAL FUNDS: INDIAMUTUAL FUNDS: INDIAMUTUAL FUNDS: INDIA | ||
| + | MUTUAL FUNDS: INDIA]] | ||
Latest revision as of 20:15, 22 February 2024
This is a collection of articles archived for the excellence of their content. |
[edit] Asset base
[edit] 2019
Dec 26, 2019: The Times of India
Mutual funds have added over Rs 4 lakh crore to their asset base in 2019 and the industry expects the growth trajectory to continue in the new year on the back of strong inflows in debt schemes and measures taken by regulator Sebi for boosting investors’ confidence.
It was because of strong inflows into debt-oriented schemes that saved 2019 from being a “dark-dull year of investing” as inflows into equity funds have dropped this year due to a volatile market.
Going ahead, the industry should witness growth in the range of 17-18% in 2020 and equity funds should see robust inflows as expectations are high about improved equity markets and a revival in economic growth, industry body AMFI’s CEO N S Venkatesh said.
The asset under management (AUM) of the industry rose by 18% (Rs 4.2 lakh crore) to an all time high of Rs 27 lakh crore in 2019 by November-end itself, up from Rs 22.9 lakh crore at the end of December 2018, as per the latest data available with the Association of Mutual Funds in India (Amfi). Some industry experts said the final Decemberend figure might be slightly lower than the November-end level, as liquid funds could see some dip due to a quarter-end phenomenon.
Kaustubh Belapurkar, director manager research at Morningstar Investment Adviser India, said, “While the mutual fund industry saw a significant growth post-demonetisation, there has been steady but not spectacular growth in 2019. But given the backdrop of the pessimism due to slowing economic growth, credit crisis and volatile markets, this growth is quite admirable.”
The investor count is estimated to have grown by over 62 lakh during 2019, to 8.65 crore this year. In 2018, investors’ folio grew by more than 1.3 crore.
The 18% AUM growth seen by the 44-member mutual fund industry in 2019 is higher than 7.5% witnessed in 2018. However, the growth was much higher at 32% in 2017, when the asset base expanded by over Rs 5.4 lakh. Kotal Mahindra AMC MD and CEO Nilesh Shah attributed the growth to three factors — first, Sebi, as a regulator, consistently created rules and regulations that boosted investors’ confidence in the industry, then to distributors and thirdly to the mutual funds for managing risk-return balance well. AGENCIES
[edit] Asset management
[edit] Growth of assets under management (AUM)
[edit] 1999-2018
MF assets at record ₹25L cr on retail push, September 8, 2018: The Times of India
From: MF assets at record ₹25L cr on retail push, September 8, 2018: The Times of India
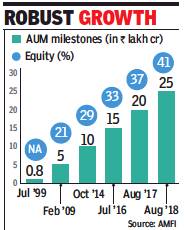
Assets managed by mutual funds (MFs) in the country crossed the Rs 25-lakhcrore milestone at the end of August, helped by strong participation of retail investors in the last few years and substantial inflow into liquid funds from corporates last month. From Rs 23.1 lakh crore at the end of July, assets under management (AUM) of the 42 fund houses together was Rs 25.2 lakh crore on August 31, data by industry trade body AMFI showed.
As of August 2017, the AUM was Rs 20.2 lakh crore.
According to AMFI CEO N S Venkatesh, the monthly rise in AUM was because of the industry body’s investor awareness campaign and strong participation from retail investors. About a year ago, AMFI, on behalf of the MF industry, had launched an awareness campaign with the tag line ‘Mutual funds sahi hai’, which has now emerged to be popular among Indians.
Retail investors have also been putting money in mutual funds schemes, especially in those that invested mainly in shares through the systematic investment plan (SIP) route. As of August, inflows through SIPs were nearly Rs 7,700 crore, compared to Rs 4,947 crore in August 2017 and Rs 3,334 crore as of August 2016, AMFI data showed.
[edit] 2017-21
From: August 10, 2021: The Times of India
See graphic:
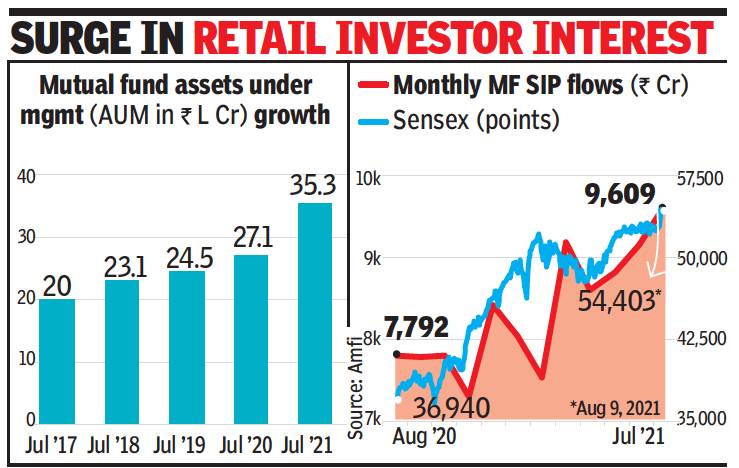
Growth of assets under management, 2017-21
[edit] 2018: IDFC looks to exit Asset management
From: Boby Kurian, Mayur Shetty & Partha Sinha, IDFC looks to exit asset mgmt biz in ₹4,000cr deal, March 22, 2018: The Times of India
Move Part Of Strategy To Unlock Value For Shareholders
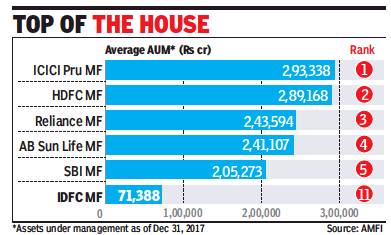
IDFC has begun discussions with IndusInd Bank and Citic CLSA, among others, to merge or sell its asset management company (AMC) — which manages about $11 billion, or Rs 71,000 crore — as part of value-unlocking moves for shareholders, multiple sources familiar with the matter said.
The Hong Kong-based financial services behemoth Citic CLSA and buyout private equity firms like Apax Partners too have evinced early interest to pursue a deal-making. IDFC is expected to ask for a Rs 4,000-crore payout — almost 6% of the assets under management — as the deal valuation. A fourth of the AMC’s assets under management are equity, while the rest are in debt. These exploratory talks would gain momentum only after IDFC allows potential bidders to conduct due diligence, sources added.
A senior official recently told this newspaper that IDFC could explore value-unlocking moves for the AMC business. “This could be either through a merger or a partnership deal,” he had said without divulging details. IDFC, which controls IDFC Bank through a nonoperating financial holding company, has a beaten down market value of Rs 7,900 crore, or $1.2 billion.
When contacted, an IDFC spokesperson said the company would not comment on speculative queries. IndusInd said that it “denies this market speculation”.
IDFC is in the midst of a merger process with Capital First, a non-banking finance company. In January, the private bank agreed to acquire Capital First in a share-swap deal valued at about $1.5 billion as part of efforts to boost retail loans.
IndusInd, originally promoted by the Hindujas and the first private bank to get a licence in post-liberalised India, is on the lookout to build a full suite of financial services. “Asset management is an ROE (return on equity) business they are interested in at a reasonable valuation,” one of the sources cited earlier said. CLSA has been interested in India’s expanding asset management industry with low penetration and expected to benefit from an increasingly digital economy.
Average assets under management (AAUM) of the Indian mutual fund industry stood at over Rs 23 lakh crore in February this year. Domestic mutual funds have reported a fourfold rise from just Rs 5 lakh crore a decade ago. IDFC Asset Management Company was established in the year 2008 after IDFC bought StanChart Asset Management for Rs 820 crore (paying 5.6% of the value of assets under management). StanChart had got the mutual fund subsidiary as part of its deal to acquire ANZ Grindlay’s Bank in 2000.
The value-unlocking moves should also be seen in the context of some IDFC shareholders being unhappy with the lackadaisical share price, which they believe is trading at more than 50% discount to its intrinsic fair value. The stock closed at Rs 50 apiece in Mumbai trade.
[edit] Categorisation, SEBI's
[edit] 2018
Partha Sinha, MFs’ rejig: Don’t redeem in panic, May 14, 2018: The Times of India
From: Partha Sinha, MFs’ rejig: Don’t redeem in panic, May 14, 2018: The Times of India
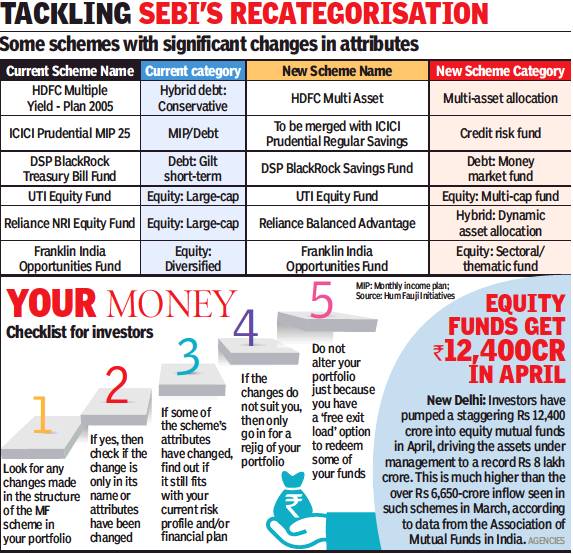
In October 2017, Sebi had asked all fund houses in the country to align their schemes under a broad framework that the regulator put in place. The fund industry was given six months to complete the process and it is now expected that this recategorisation should be over by the end of the month.
The main objective for the recategorisation of mutual funds is to help investors select schemes easily. According to Sebi, the schemes should be “clearly distinct in terms of asset allocation, investment strategy, etc”. The markets regulator divided mutual fund schemes into five broad groups, which are further divided into a total 36 categories.
The five broad categories are equity, debt, hybrid, solutionoriented and other schemes. Within these groups, there are sub-categories with debt funds being divided according to duration and accrual, while equity funds have been divided by market capitalisation, tax treatment, sectoral exposure, etc.
Financial planners and advisers say investors should not rush to redeem their existing schemes just because there are some changes to their attributes. “Not many schemes have undergone drastic changes in their attributes...lot of people are getting alarmed because of the use of jargons in the industry,” said Sanjeev Govila, a Delhi-based financial planner and CEO of Hum Fauji Initiatives. “Even if there are changes, investors should see if the structure fits into their overall portfolio and then decide on the next course of action,” he said.
According to a city-based financial planner, if an investor has any doubts about the changes that have been made, it’s always better to sit with his financial planner or adviser, go through them in detail and then decide whether to effect a change in the portfolio. “Rejig your portfolio only if there are some drastic changes in the attributes of the schemes that you have and the new structure does not gel well with your financial plan,” the financial planner said.
Financial advisers and planners also warn about two things. First, under the Sebimandated recategorisation exercise, fund houses have given investors the option to exit a scheme free of charge. But industry players say that, in any case, over 98% of investments by value in the entire MF industry is under a ‘no exit load’ structure. “So, investors shouldn’t fall pray to this option and redeem their scheme even though they don’t need to,” said Govila.
Second, some unscrupulous distributors are telling investors that they should exit their existing investments and enter some new ones so that the distributors can make some money. Investors should be careful about this, too, financial advisers and planners said.
[edit] CEO remunerations
[edit] 2017: UTI leads
The Unit Trust of India (UTI), the original pioneer of mutual funds (MFs) in the country , may have lost its leadership position to private sector peers. But the fund house's top honcho and its employees are now the best paid in the MF industry.
Leo Puri, MD and CEO of UTI MF , was the highest paid executive in the MF industry in 2016-17. He took home Rs 7.07 crore as annual salary (fixed and variable pay) during the year, a 23% increase compared with the previous fiscal, pipping Milind Barve, the MD and CEO at HDFC MF , the highest paid executive in 2015-16.
The median remuneration at UTI -which stood at Rs 19.6 lakh during the year, more than twice the average pay of employees at the country's top-4 fund houses by assets under management (AUM) -is high as the average tenure of employees is more than 20 years. Incidentally, UTI is only the sixth largest fund house by AUM, and lost its place in the top-5 league to SBI MF in April last year. Kamlesh Dangi, group president & head HR , UTI MF , said, “Since we do not have a long-term incentive plan, the salary (cash) component is high.“
While the median remuneration of employees at ICICI Prudential MF -the largest fund house by AUM -was Rs 5.84 lakh, employees at HDFC MF , the second largest fund manager got Rs 8.77 lakh as average pay . Employees at Reliance MF and Birla Sun Life MF , the third and fourth largest fund houses respectively , got an average pay of around Rs 8.5 lakh and Rs 7 lakh respectively .
More than a dozen executives at UTI were paid in excess of Rs 1 crore in 2016-17. Sundeep Sikka, the executive director and CEO of Reliance MF , got the highest pay rise among executives of top-6 fund houses in the country . Sikka earned Rs 5.01 crore as annual salary (fixed and variable pay) during 2016-17, a 43.1% jump on a yearon-year basis. In addition, he also got a one-time payment of Rs 3.41crore for the year.
Despite the stellar show by equity MFs, which touched record highs, soaring past the Rs 5-lakh-crore AUM mark in 201617, the top-2 equity fund managers saw negligible hike in their annual pay . While Sankaran Naren, the ED of ICICI Prudential MF , who also heads the fund house's equities team, saw no change in remuneration during the year, the annual pay of Prashant Jain, ED of HDFC MF , who dons a similar role, inched up by 3.9%.
The annual salary of Jain, however, remained the highest in the industry among fund managers. Incidentally , HDFC MF's average AUM in the equity category increased 18.4% yo-y to Rs 80,592 crore while ICICI Prudential's average AUM surged 33% y-o-y to Rs 77,223 crore for 2016-17. MFs would not disclose the remuneration paid to its star fund managers earlier. They would disclose compensation paid to key managerial personnel (KMP), which included the MD. Interestingly , KMP included the MD and CEO, CFO and company secretary and not CIOs who run the fund management business.
[edit] Closure of schemes
[edit] investors have final say: SC
July 15, 2021: The Times of India
From: July 15, 2021: The Times of India
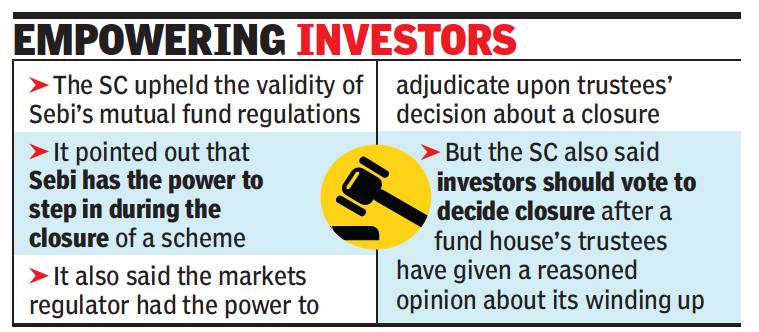
The Supreme Court empowered investors in a mutual fund scheme to have the final say on its closure after trustees who manage it give a “reasoned nod” for winding it up. Under present rules, trustees alone have the right to decide on the closure of a scheme.
The landmark verdict came in the case relating to the winding-up of Franklin Templeton MF’s six debt schemes. In April 2020, Franklin Templeton MF’s trustees had agreed to close down the schemes due to a severe liquidity crunch in the debt market after a Covid-induced lockdown. The SC also upheld the validity of Sebi’s mutual fund regulation under which these schemes are being closed down. The court held that Sebi can look into the decision of the trustees in case of a closure of a scheme.
The SC judgment came on an appeal filed by Franklin Templeton MF against a Karnataka high court order that had asked the fund house to get the consent of its investors by a simple majority to its decision to wind up the six schemes. Some aggrieved investors had also moved SC challenging the validity of Sebi’s MF regulations.
In their 77-page order, Justices S Abdul Nazeer and Sanjiv Khanna dealt with the interpretation of Sebi’s rules and regulations related to the issue of winding up of a scheme and the process followed. They also said that to start the windingup process, the trustees should give a public notice in newspapers to disclose circumstances leading to their decision to close the scheme.
Justice Khanna said that they had “reservations on the said observations (of Karnataka HC) for the simple reason that if there is a violation of the regulations...by the trustees or AMC, it is open to Sebi to proceed in accordance with the law”.
The apex court said that Sebi had the powers to pass directions under Sections 11 and 11B of the Sebi Act which deal with the protection of investors’ interests. SC, however, said that trustees need not take prior approval of Sebi while deciding to close a scheme.
On February 12, the SC had allowed the e-voting process for winding up of six MF schemes. In December last year, the investors had voted their consent to the decision to close down the six schemes but the final results of the voting was not disclosed till February 12 under the apex court’s order.
The SC had also allowed disbursal of funds to investors in these schemes under the supervision of SBI MF. According to the disbursal schedule, by the end of the week nearly Rs 21,100 crore would have been distributed to the investors of the six FTMF schemes.
[edit] Equity funds
[edit] 2008-19
From: Allirajan M, Equity fund-raise plunges 68% in FY19 on poor IPOs, April 1, 2019: The Times of India
See graphic:
Funds mobilisation from equity markets, 2008-19
[edit] 2019: 68% decline on poor IPOs
Allirajan M, Equity fund-raise plunges 68% in FY19 on poor IPOs, April 1, 2019: The Times of India
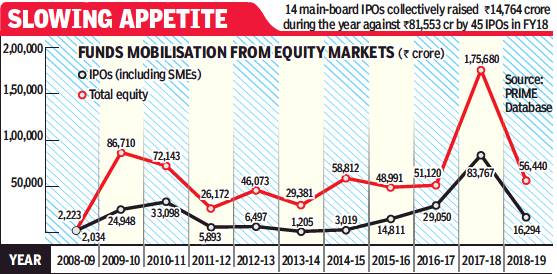
Fund-raising from equity markets fell 68% y-o-y to Rs 56,440 crore in FY19 due to the poor show by IPOs. The slump comes after a robust performance in FY18 when fund-raising from equity markets and IPOs hit a record high.
Funds mobilised through IPOs plunged 81% y-o-y to Rs 16,294 crore in 2018-19. The response to IPOs was affected by poor listing performance, said Pranav Haldea, managing director, PRIME Database. Of the 13 IPOs which got listed (RVNL is yet to be listed), only two gave a return of over 10% (based on the closing price on listing date). HDFC Asset Management gave a robust return of 65% and was followed by RITES at 15%.
Fund-raising in 2019-20 would be significantly impacted by the outcome of the general elections, Haldea said.
[edit] Growth of mutual funds
[edit] 2013 – 23
See graphic:
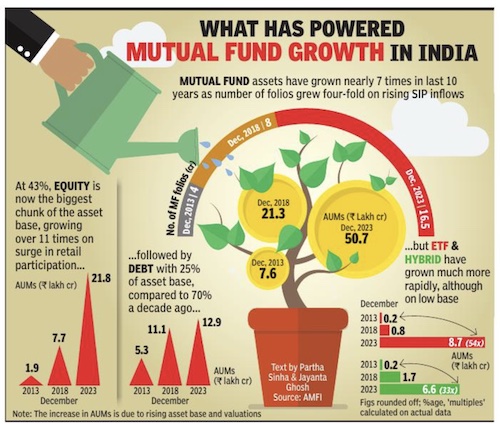
Mutual Fund growth in India, 2013- 23
[edit] Investments by Mutual Funds
[edit] 2018: holdings in biggest IT firms increase

From: June 15, 2018: The Times of India
See graphic:
2017-18- Mutual Funds holdings in India’s bigger IT firms
[edit] Investments in Mutual Funds
[edit]
[edit] 2007-18
From: August 8, 2018: The Times of India
See graphic:
Retail investors' share in mutual funds doubles in 4 years
[edit] Growth of SIPs/ MFs vs. bank FDs
[edit] 2014-18
From: Allirajan M, MFs now nearly a fifth of FDs as small towns take SIP of equity funds, May 28, 2018: The Times of India
For K Srinivasalu from Ongole in Andhra Pradesh’s Prakasam district, ‘investment’ only meant parking his money in insurance schemes. That was till last year when a friend talked him into considering mutual funds (MFs) for better returns. It’s been six months since the 35-year-old started a systematic investment plan (SIP) in an equity MF.
Tuticorin-based Dr P Poornima, meanwhile, has increased her SIP investments in equity MFs by 40%. “Real estate and gold have turned unstable. Equity MF SIPs are useful in longterm wealth creation,” she said.
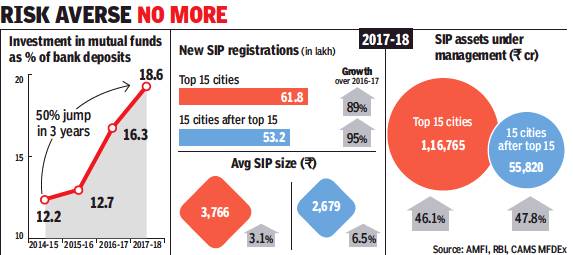
As Indian investors seek higher returns than those from bank fixed deposits (FDs), smaller cities are leading the rush towards MF investments. Money invested in MFs (called assets under management, or AUM) now amounts to roughly a fifth of savings in FDs, which is an all-time high. At the same time, growth in bank deposits has never been slower since 1963.
In 2017-18, total deposits with banks increased by a mere 6.7% year-on-year (y-o-y) to Rs 115 lakh crore, while the AUM of MFs surged 22% y-o-y to more than Rs 21 lakh crore, according to data with the Association of Mutual Funds in India (AMFI).
While SIP registrations in the top 15 cities — called T15 — increased by 89% last year, the growth rate was even faster in the next 15 cities — called B15 — at 95% with more than 53 lakh new registrations, according to data with CAMS MFDex, which represents 96% of the MF industry.
People in smaller cities are also increasing the size of their SIPs faster than investors in bigger cities. In B15 cities, the average live SIP size grew 6.5% to Rs 2,679 at the end of March, compared with a 3.1% increase to Rs 3,766 in T15 cities.
“Awareness about SIPs has reached even smaller towns,” said Srikanth Meenakshi, co-founder and COO, FundsIndia.com, an investment platform for MFs. Inflows into SIPs stood at around Rs 7,119 crore in March alone — the highest ever for a month. Investors committed Rs 67,190 crore through SIPs in 2017-18 — a 53% y-o-y increase, which is also an all-time high.
Investment advisers count poor returns on FDs, the shadow of non-performing assets (NPAs) on public sector banks, and the popularity of balanced funds with monthly dividends among the reasons for the middle class’ shift to MFs.
State Bank of India (SBI), the country’s largest bank, offers 6.4% interest on a one-year FD, while leading private sector banks offer 6.6-7% interest. After tax, the returns shrink by 5% to 30%, depending on the investor’s income slab. This is less than the one-year returns on liquid and ultra short-term fund schemes and much less than the nearly 12% returns from several diversified fund schemes in the past one year.
“People are not happy with the returns on bank FDs,” said Suresh Parthasarathy, founder of MyAssetsConsolidation.com, an investment advisory. “The real returns on bank FDs are almost negligible.” Taking the RBI’s projection for retail inflation into account, the real returns on bank FDs would be a measly 0.75-1%.
Like FDs, gold and real estate have also given abysmal returns in recent years. Suresh Sadagopan, founder of Ladder7 Financial Advisories, said, “People are investing in MFs through SIPs as physical assets such as gold and property have not been doing well for quite some time.”
[edit] Equity MFs vsFIIs
[edit] 2015
The Times of India, November 20, 2015
Allirajan M
Equity MF investors beat FIIs in 2015
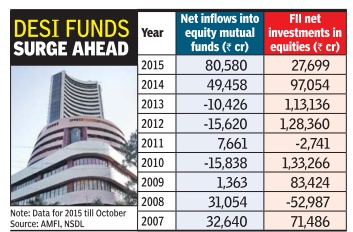
For years, equity mutual funds (MFs) were the poor cousins of the stock markets as foreign institutional investors (FIIs) always poured more money into direct equities. But for the first time ever, equity MF investors are overshadowing their overseas peers, having pumped nearly three times more funds into equity schemes in the current year than FIIs. Equity MFs (including equity-linked savings schemes, or ELSS) have seen net inflows of Rs 80,580 crore, or about $12.5 billion, so far in 2015 (till October) -the highest on record. In contrast, FIIs have made net investments of Rs 27,699 crore, or around $4.25 billion, during the period.
In fact, net investments made by MF investors have al ready surpassed the highs hit in 2014. The surge in inflows into equity schemes has prompted fund houses to deploy money in shares in a big way .Equity MFs have deployed about $950 million per month on an average in 2015. Fund deployments peaked to an all-time monthly high in August af ter the stock markets plunged in the wake of the global turmoil in equity markets amid a sharp selloff in China.
“Investors are gradually realizing that equities are the best option on a tax-adjusted basis over the long term. So they are putting a bigger portion of their savings in equiti es,“ says Sunil Singhania, head (equities), Reliance Capital Asset Management.
Gopal Agrawal, CIO, Mirae Asset Global Investments India, says, “Interest (in equities) has been quite consistent among investors. Other asset classes such as gold and real estate have not done well and this has also helped. There is a clear shift in investment patterns. Investors have become a lot more mature. The attractiveness of other asset classes has diminished to a large extent. But the long-term outlook is quite positive for equities.“
Barring odd instances such as the market meltdown in 2008 when the rout that followed the global financial crisis triggered a massive pullout by FIIs, overseas investors have stood head and shoulders above their domestic peers in investments into Indian stocks.
[edit] AUM as % of m-cap
[edit] May 2018 (at 5.4%)
Allirajan M, Equity MF assets to market cap at all-time high, June 19, 2018: The Times of India
From: Allirajan M, Equity MF assets to market cap at all-time high, June 19, 2018: The Times of India
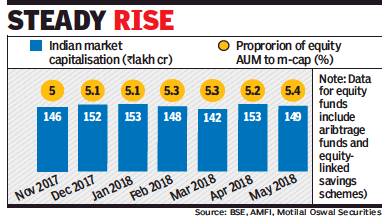
Equity assets under management (AUM) as a percentage of India’s market capitalisation (m-cap) hit an all-time high of 5.4% in May.
The proportion of assets of equity funds (including equitylinked savings schemes or ELSS and arbitrage funds) to the total m-cap have increased 0.8% in the last one year. It has gone up by 0.2% in the last one month alone. The ratio has been ruling consistently above the 5% mark since November last year. After rising by 6.7% in April, the AUM of equity mutual funds (MF) dropped 0.3% month-on-month (m-o-m) to ₹7.98 lakh crore in May. The m-cap of companies listed in the country stood at ₹149 lakh crore at the end of May.
With retail investors participating in the stock market rally in zest, equity MF AUM as a percentage of India’s stock market capitalisation touched 5% for the first time in September last year. The m-cap of all companies listed on the BSE (Bombay Stock Exchange) grew 18.25% y-o-y or by ₹23 lakh crore to ₹149 lakh crore in September. The equity MF AUMto-market capitalisation ratio was hovering around the 4% mark for about 18 months starting September 2015.
[edit] Investors’ rights and duties
[edit] As in 2018
January 23, 2018: The Times of India
Every MF investor has certain rights and some duties to facilitate a smooth investing experience
Mutual fund investors enjoy several rights under current laws. For a smooth investing experience the investor should also fulfil certain duties that will make him/her a responsible investor. Here are some of the important tools that all mutual fund investors should keep in mind.
KYC COMPLIANCE
Under current laws, Know Your Client (KYC) compliance is compulsory for every mutual fund investor. KYC is done mainly to prohibit money laundering and to stop illegal money from getting into the fund industry. In turn such slush money could also percolate into the stock, debt and gold markets.
For KYC compliance, the investor should provide a valid proof of identity (Passport, PAN, voter ID etc.), proof of address, passport photo and PAN. The government has now also made it compulsory to link Aadhaar to all KYC compliance requirement.
Currently, once an investor updates his KYC information with a KYC Registration Agencies (KRA), the same will automatically get updated in the investments he/she has with all the entities regulated by Sebi.
PERSONAL INFORMATION
Every MF investor should update all their relevant personal information__ address for correspondence, contact number(s), email ID, income tax PAN, at least one bank account number that will be used for all fund-related transactions__with the fund houses where they have investments. The bank account details will include the 11-16 digit account number, 11-digit IFSC and 9-digit MICR numbers. In case of any change in personal information, it’s the duty of the investor to inform the fund house as early as possible. Among others, updated personal information helps fund houses to prevent frauds related to investments.
NOMINATION FACILITY
Current rules require that every fund investor should make at least one nomination for each of his/her investments. Alternately, the investor has to declare that he/she doesn’t want to nominate anyone. Nominations turn helpful in case of any eventuality of the investor.
WATCH YOUR INVESTMENTS
Every responsible investor should keep a tab on how his/her funds are performing by watching their funds’ NAVs on a regular basis. However, the regularity should not be too frequent like every day or week which could be detrimental to his/her investment and the long term financial plan. Reviewing investments on a regular basis is important because this makes the investor aware of the market trend and he/she could go for a course correction in case the investments do not perform as planned.
HAVE A FINANCIAL PLAN IN PLACE
One of the first things an investor should remember is that financial planning is never for an individual. It’s for the family. The process of financial planning involves a series of decisions relating to your family’s future financial goals, investments in and buying of financial products, and executing the same.
Some of the important elements of financial planning are goal setting, identifying needs and wants of the family and also of the individuals, keeping tab of income, expenses and savings of the people in the family, creation of an emergency fund, taking adequate insurance, investments for short, medium and long term goals and finally reviewing and if needed rebalancing the portfolio.
AADHAAR AND FATCA COMPLIANCE
Lately the government has made it compulsory for all investors to link their Aadhaar numbers to all investments. It has also asked every investor to comply with Foreign Account Tax Compliance Act (FATCA).
[edit] Duties of a responsible investor

From: January 23, 2018: The Times of India
See graphic:
Duties of a responsible investor
[edit] NBFCs, investments in/ exposure to

From: August 21, 2020: The Times of India
See graphic:
Mutual Fund's exposure to NBFCs, August 2018- June 2020
[edit] Net asset values (NAVs)
[edit] How default leads to crash in NAVs
June 6, 2019: The Times of India
After debt-laden mortgage lender Dewan Housing Finance (DHFL) failed to pay on its bonds on Tuesday, net asset values (NAVs) of several debt funds — including those run by top MFs — crashed. On Wednesday, ratings agencies Crisil And ICRA downgraded commercial papers issued by the company. Here’s the lowdown on the latest troubles in the debt fund segment and what can investors do to safeguard their money...
What’s the DHFL crisis about?
The genesis of the DHFL crisis is systemic to the Indian debt market system rather than specific to the company. DHFL has substantial short-term loans to repay to holders of bonds and FDs, among others. The company has given home loans, advances against property and also lent to real estate developers, which usually take several years to be recovered. It needs to pay back some of its bond and FD holders, but most of its money is long-term loans. So it’s now selling off parts of the businesses, like affordable housing finance company and mutual fund, to raise money to pay back bond and FD holders.
Why NAVs of debt funds fall drastically in case one of its portfolio companies default in payment on its bonds?
When the bonds issued by one firm forms a large portion of the fund’s portfolio, a default in it leads to a crash in the NAV of its holding debt fund. This is because under Sebi rules, as soon as a company defaults, the bonds issued by it should be valued at 25% of its original value — that is, a 75% markdown. Over the next 15 days, rating agencies — Crisil and ICRA — are mandated to independently look into each bond issued by that company and give their opinion on the present value of those bonds that each fund manager is liable to accept.
What happens after the initial 75% markdown?
For example, a fund has Rs 100 crore worth of bonds issued by a company X, which defaults on its payment. The day the company X defaults, those bonds worth Rs 100 crore will be valued at Rs 25 crore (under Sebi rules). Now, if this debt scheme’s total portfolio size was Rs 300 crore, the bonds of company X at Rs 100 crore formed 33% of its portfolio. With Rs 75 crore gone due to the downgrade, the scheme’s NAV will fall by 25% in a single day. So the larger the holding of a bond in default, the bigger would be the fall in NAV on the day after the default.
How long does it take for the NAV to recover?
After the revaluation by rating agencies as mandated by Sebi, in most cases, the value of bonds in default are seen to be much higher than just 25% of their original (after the markdown). So investors could reasonably expect some smart recovery in NAVs after rating agencies give their valuation opinion.
Do NAVs of all funds recover?
In case the company is backed by sound business or assets, usually NAVs recoup their losses within 15 days. But a sharp recovery in NAVs does not happen in case of companies with no or bad assets. Mutual fund managers, however, don’t invest in such companies in the first place.
[edit] Penetration by MFs
[edit] India vis-à-vis the world, 2018
Mutual funds' penetration dismally low in India, January 9, 2019: The Times of India
From: Mutual funds' penetration dismally low in India, January 9, 2019: The Times of India
See graphic:
Penetration by MFs in India and other major countries, presumably as in 2018
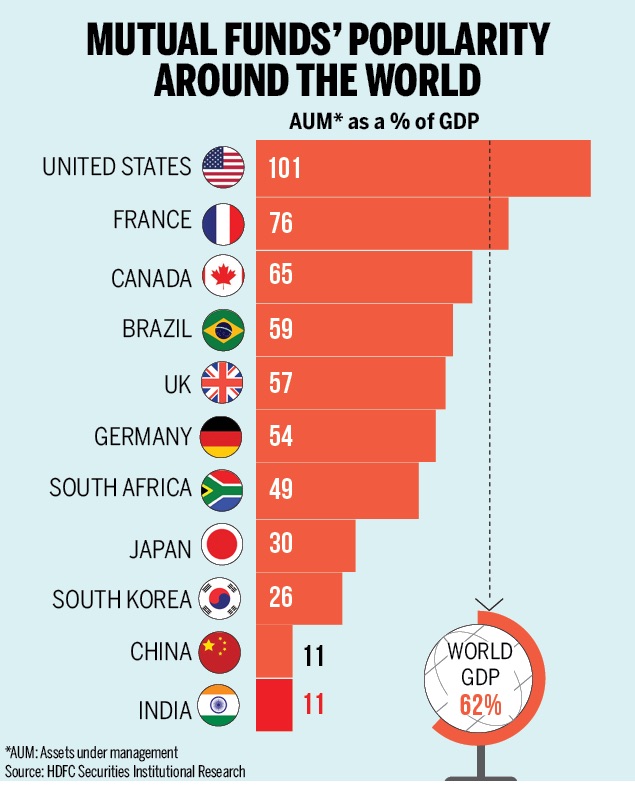
Despite the record inflows into mutual funds, their penetration in India remains dismally low compared to other nations. India's mutual funds' penetration is just 11% of GDP while it is 49% in South Africa and 59% in Brazil. But the low penetration also indicates that their is vast untapped potential. Here's a look at how popular mutual funds are around the world.
[edit] Performance
[edit] 2017: MFs investing in USA beat those investing only in India
Allirajan M, MFs investing in US mkts beat desi funds, October 12, 2018: The Times of India
With the rupee depreciating sharply against the US dollar and developed markets faring much better than domestic stock indices, equity mutual funds (MFs) that invest in the US stock markets have emerged as one of the best performers.
Equity MFs, which invest exclusively in shares of companies listed in the US bourses, have surged 20-36% in the last one year, the second-best performance in the equities category.
Equity MFs with exposure only to shares of IT (information technology) companies, alone have fared better. MFs, which deploy money in the US market, have emerged on the top of the performance charts in the ‘Equity MF International’ category, which comprises funds that invest across major global markets.
The rupee has fallen about 14.3% so far in 2018, the worst performance among Asian currencies.
A sharply depreciating rupee boosts the returns of MFs that buy into the US stock markets as the shares are priced in dollars. Moreover, the US stock markets have seen a robust rally with key indices delivering higher returns than Indian markets. While the NASDAQ-100 index has surged 16.2% in the last one year, the S&P 500 index has gained 9.2% during the timeframe.
In contrast, the benchmark Sensex and the broadbased Nifty have advanced by only 2.1% and 4.4% respectively in the last one year. Equity MF schemes with substantial exposure to stocks of technology-driven behemoths such as Apple and Amazon have given substantially higher returns than others in the category, data with Value Research, which tracks MFs showed.
[edit] Returns
[edit] From SIPs, 1999-2019; debt funds, 2005-19
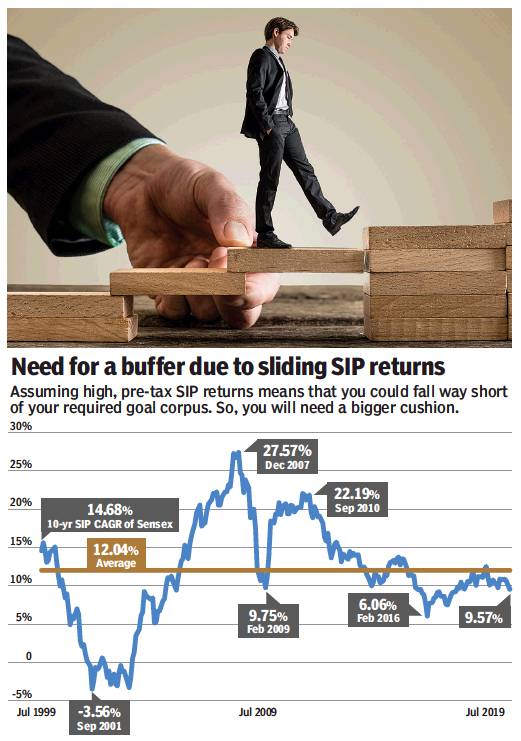
From: NARENDRA NATHAN, August 19, 2019: The Times of India

From: NARENDRA NATHAN, August 19, 2019: The Times of India
See graphics :
Returns from SIPs, 1999-2019
Returns from debt funds, 2005-19
[edit] 2015-2020

From: March 14, 2020: The Times of India
See graphic:
Mutual funds’ returns, 2015-2020.
[edit] See also
Investments and savings (personal): India <>
Sensex <>
Mutual Funds: India <>
