Centre-State financial relations: India
| Line 11: | Line 11: | ||
[[Category:Name|Alphabet]] | [[Category:Name|Alphabet]] | ||
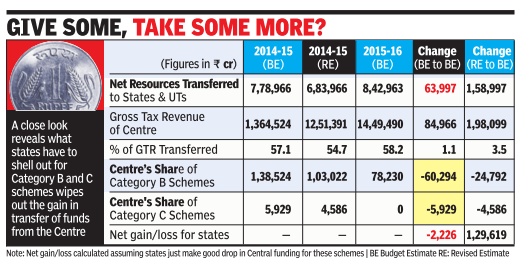
| − | [[File: states2.jpg|2014-16: Central aid to the states, Graphic | + | [[File: states2.jpg|2014-16: Central aid to the states, Graphic courtesy: [http://epaperbeta.timesofindia.com//Gallery.aspx?id=02_03_2015_013_052_010&type=P&artUrl=Centres-cash-spread-to-states-lavish-only-on-02032015013052&eid=31808 ''The Times of India'']|frame|500px]] |
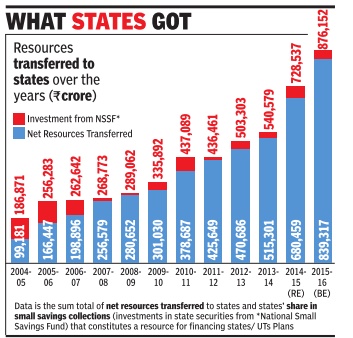
[[File: states1.jpg|2004-16: resources transferred from the centre to the states, Graphic courtesy: [http://epaperbeta.timesofindia.com//Gallery.aspx?id=02_03_2015_013_074_012&type=P&artUrl=IT-link-up-to-keep-an-eye-on-02032015013074&eid=31808 ''The Times of India'']|frame|500px]] | [[File: states1.jpg|2004-16: resources transferred from the centre to the states, Graphic courtesy: [http://epaperbeta.timesofindia.com//Gallery.aspx?id=02_03_2015_013_074_012&type=P&artUrl=IT-link-up-to-keep-an-eye-on-02032015013074&eid=31808 ''The Times of India'']|frame|500px]] | ||
Revision as of 19:39, 8 August 2015
This is a collection of newspaper articles selected for the excellence of their content. |


Central grants to states: India
Centre kind to some, stingy with others
Odisha Tops Central Grants List
Subodh Varma TIMES INSIGHT GROUP
Every year, chief ministers make a beeline to the Planning Commission arguing for more allocation, bemoaning the cash crunch that state governments are facing.
So, how much funds does the central government actually give to the states?
Amounts vary according to the population of the states. So, comparing annual central grants may be misleading. For example, Tamil Nadu got over Rs 34,000 crore from the Centre between 2007-08 and 2011-12, while Kerala got less than half of that– Rs 15,000 crore. But that’s understandable – Kerala’s population is less than half of Tamil Nadu’s.
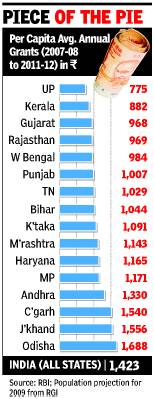
This problem is taken care of by looking at per capita grants from the Centre, that is, grants divided by population. Among major states, this throws up a strange and counter-intuitive picture. While some of the poorest states like Odisha, Jharkhand and Chhattisgarh are top receivers of central funds, other poor or backward states like Uttar Pradesh, Rajasthan and West Bengal are among the lowest beneficiaries.
Between 2007-08 and 2011-12, Uttar Pradesh got just Rs 775 per head per year as grants from the Centre – the lowest among all major states. West Bengal, another populous and poverty stricken state, got Rs 984 per head per year.
Odisha topped the list among major states, getting Rs 1,688 – more than double of what UP got. Jharkhand (Rs 1,566) and Chhattisgarh (Rs 1,540) too got relatively more grants from the Centre. The national average for all states is Rs 1,423. But that includes transfers to states in the northeast, Jammu & Kashmir and other smaller states.
Broadly, total grants from the Centre to states fall in three categories – state plan schemes provided by the Planning Commission, central plan schemes and sponsored programmes provided by the central government, and non-plan grants provided by the Finance Commission, explains Subrat Das, head of New Delhi-based thinktank Center for Budget and Accountability (CBGA).
“Budgets approved for different states in a centrallysponsored scheme depend on priorities of the central ministries, assessment of needs across states, and ability and willingness of the state to contribute matching grants,” Das said. This could be one reason for the strange fact that some poor states seem to be getting more than others.
“Grants recommended by the Finance Commissions have been predominantly in the nature of general purpose grants meeting the difference between the assessed expenditure on the non-plan revenue account of each state and the projected revenue, including the share of a state in central taxes,” says Praveen Jha, professor of economics, and Atul K Singh, a research student at Jawaharlal Nehru University, Delhi.
Although ‘backwardness’ of a state was considered as a parameter for the first time in the Sixth Finance Commission (1973), the ‘gap-filling’ approach continued. It was only in recent finance commissions that some consideration to educational or health related parameters was given.
