Household debt: India
(→What Indians borrow for) |
(→What Indians borrow for) |
||
| (2 intermediate revisions by one user not shown) | |||
| Line 92: | Line 92: | ||
=What Indians borrow for= | =What Indians borrow for= | ||
==2023== | ==2023== | ||
| − | [[File: The Items that Indians take loans for, presumably as in 2023.jpg|The Items that Indians take loans for, presumably as in 2023 <br/> From: [https://epaper.indiatimes.com/article-share?article=01_10_2024_014_009_cap_TOI Oct 1, 2024: | + | [[File: The Items that Indians take loans for, presumably as in 2023.jpg|The Items that Indians take loans for, presumably as in 2023 <br/> From: [https://epaper.indiatimes.com/article-share?article=01_10_2024_014_009_cap_TOI Oct 1, 2024: ''The Times of India'']|frame|500px]] |
'''See graphic''': | '''See graphic''': | ||
'' The Items that Indians take loans for, presumably as in 2023 '' | '' The Items that Indians take loans for, presumably as in 2023 '' | ||
| + | |||
| + | =Leverage ratio= | ||
| + | ==2011-23== | ||
| + | [[File: Household debt as a percentage of assets, Leverage ratio, 2011-23.jpg|Household debt as a percentage of assets/ Leverage ratio, 2011-23 <br/> From: [https://epaper.indiatimes.com/article-share?article=20_09_2024_010_004_cap_TOI Sep 20, 2024: ''The Times of India'']|frame|500px]] | ||
| + | |||
| + | '''See graphic''': | ||
| + | |||
| + | '' Household debt as a percentage of assets/ Leverage ratio, 2011-23 '' | ||
| + | |||
| + | [[Category:Development|D HOUSEHOLD DEBT: INDIA | ||
| + | HOUSEHOLD DEBT: INDIA]] | ||
| + | [[Category:Economy-Industry-Resources|D HOUSEHOLD DEBT: INDIA | ||
| + | HOUSEHOLD DEBT: INDIA]] | ||
| + | [[Category:India|D HOUSEHOLD DEBT: INDIA | ||
| + | HOUSEHOLD DEBT: INDIA]] | ||
| + | [[Category:Pages with broken file links|HOUSEHOLD DEBT: INDIA | ||
| + | HOUSEHOLD DEBT: INDIA]] | ||
| + | [[Category:Society|D HOUSEHOLD DEBT: INDIA | ||
| + | HOUSEHOLD DEBT: INDIA]] | ||
=Source of loans= | =Source of loans= | ||
Latest revision as of 18:59, 28 December 2024
This is a collection of articles archived for the excellence of their content. Additional information may please be sent as messages to the Facebook community, Indpaedia.com. All information used will be gratefully acknowledged in your name.
This is a collection of articles archived for the excellence of their content. |
Contents |
[edit] Household debt
[edit] 2018-21
July 5, 2021: The Times of India
From: July 5, 2021: The Times of India
From: July 5, 2021: The Times of India
From: July 5, 2021: The Times of India
NEW DELHI: The sharp increase in household debts in the pandemic-stricken financial year 2020-21 is a worrying feature indicating rise in debt stress, a report by State Bank of India (SBI) economists said.
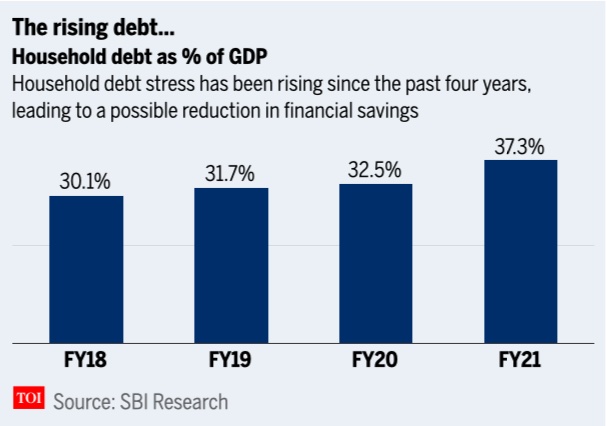
Household debt as percentage of gross domestic product (GDP) jumped from 32.5 per cent in FY20 to 37.3 per cent in FY21, mainly on account of the adverse financial impact caused by Covid-19 pandemic. The debt has been calculated after taking into account retail loans, crop loans and business loans from financial institutions like commercial banks, credit societies, non-banking finance companies (NBFCs) and household finance corporations (HFCs), the report said.
It also warned that the ratio may rise further this fiscal due to the second wave of the pandemic.
Constant rise in household debt levels
The debt burden on households has been constantly on the rise since FY18.
It is to be noted that 2017 was also the year when goods and services tax (GST) regime came into implementation. Since then, the debt levels have increased almost 720 basis points (bps).
Falling savings rate
Rising household debt stress is a clear indication of falling financial savings.
The second Covid wave was a major blow to the health infrastructure of the country. With cases peaking in the month of May, household savings took a major setback as people spent higher on consumption and health.
Decline in bank deposits
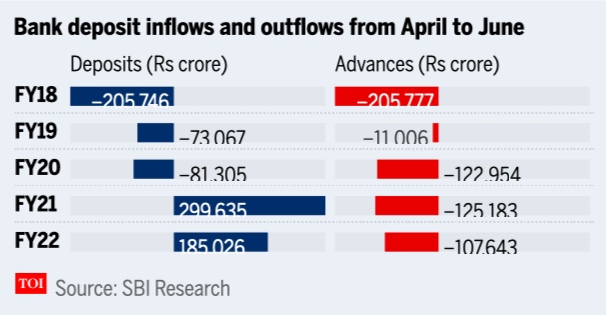
The beginning of the second wave resulted in significant deposit outflows from banking system in alternate fortnights.
However, the pace of these deposit outflows have moderated now. Between March and December 2020, 599 districts saw an inflow of Rs 11,19,776 crore, while 113 districts saw an outflow of Rs 1,06,798 crore.
This decline in bank deposits and the increase in health expenditure may result in further increase in household debt to GDP in FY22, the SBI report said.
During the initial lockdown period in 2020, deposits of the ASCBs had increased due to less avenues to spend. However, subsequently, it declined marginally in the festive months.
Household debt to GDP ratio still lower
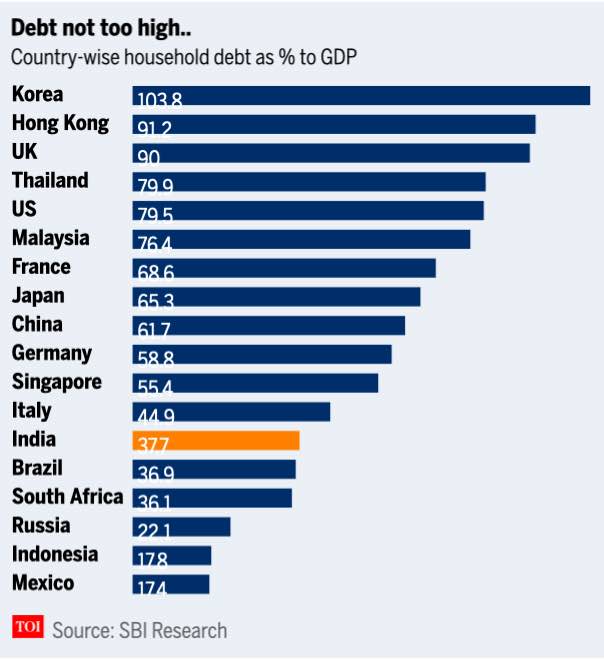
The SBI report further notes that India's household debt to GDP ratio still remain lower than a lot of other countries. However, it says that we need to supplement wage income.
Korea's household debt to GDP ratio is the highest at 103.8 per cent, Britain stands at 90 per cent, while it is 79.5 per cent in the US, 61.7 per cent in China and the lowest in Mexico at 17.4 per cent.
"If we proxy employee expenses as wage income, as percentage of corporate gross value add for around 4,000 listed companies, it has come down to 30.6 per cent in FY21 from 34.1 per cent in FY20, even as their net income as percentage of corporate gross value add has significantly grown from 13.4 per cent in FY20 to 23.7 per cent in FY21," it added.
[edit] Urban Households
[edit] 2002, 2012
Average household debt in cities up 7 times in 10 years
Dec 22, 2014 Subodh Varma
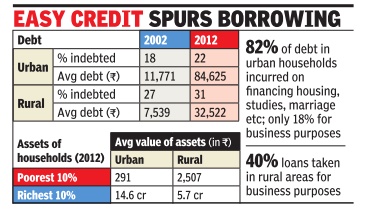
22% of urban families have loans to repay
Nearly a third of rural households and a quarter of urban ones are in debt, says a report released this week. This is understandable with the spread of credit facilities. But the scale of indebtedness revealed is astonishing: between 2002 and 2012, the average amount owed by each family has jumped seven times in cities and more than four times in rural areas.
About 22% of urban households were in debt and the average debt per family was Rs 84,625, up from Rs 11,771 in 2002. In the rural areas, 31% of households were in debt compared to 27% in 2002 -their average debt had increased from Rs 7,539 to Rs 32,522. The survey , carried out by the National Sample Survey Organization (NSSO), studied assets and debt across India through two visits to more than one lakh households in 2013. Such surveys are done by the NSSO every 10 years.
Average debt is computed by dividing the total debt by total population, which includes households that have no debt.A better picture of the scale of indebtedness is seen if the total debt is distributed only over the indebted households: then the average debt increases to Rs1,03,457 in rural areas and Rs 3,78,238 in urban areas. The survey also estimat ed that average value of assets among rural households was about Rs 10 lakh while in urban areas it was nearly Rs 23 lakh.
The definition of assets used this time round was changed from that of previous surveys. Consumer durables, bullion and jewellery were not counted as assets. Also, prices of land and building were taken from normative guideline values rather than as reported by the informant.Hence, asset values reported in this survey are not comparable to previous ones. What is striking in asset ownership is the extreme inequality between rich and poor.While the average value of assets owned by the richest 10% of the urban population was Rs 14.6 crore, the poorest 10% owned assets worth just Rs 291 -virtually nothing. In rural areas too, similar inequality is visible. The average asset value of the richest segment was Rs 5.7 crore compared to Rs 2,507 for the poorest.
Expectedly , wide variation is seen in asset ownership depending upon vocation. In rural areas, cultivators owned assets valued on an average at Rs 29 lakh while non-cultivators had assets worth about Rs 7 lakh. Similarly , in urban areas, self-employed families had assets worth as much as Rs 51 lakh compared to about Rs 20 lakh worth of assets owned by wage or salary earners.
The enormous contribution of real estate prices to the explosion in asset values is clearly seen in the fact that in rural areas, 73% of the value of assets was derived from land and 21% from buildings.In urban areas, while 47% of asset value was from land, 45% was from buildings.
In urban areas, 82% of debt is incurred to finance housing, education, marriages etc and only 18% is for business purposes, showing that the urban housing boom has been driven by debt. In rural areas, 40% of loans were taken for business.Interestingly , shares and debentures made up an insignificant part in both rural and urban areas for most. Just 0.07% of asset value of rural households and 0.17% among urban ones derived from shares etc.
[edit] What Indians borrow for
[edit] 2023
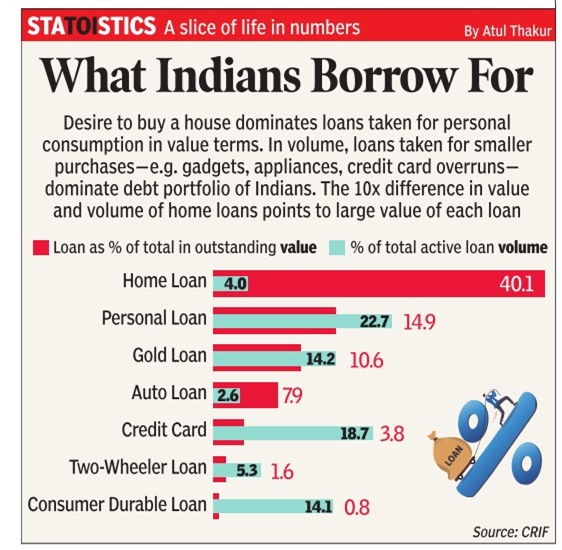
From: Oct 1, 2024: The Times of India
See graphic:
The Items that Indians take loans for, presumably as in 2023
[edit] Leverage ratio
[edit] 2011-23

From: Sep 20, 2024: The Times of India
See graphic:
Household debt as a percentage of assets/ Leverage ratio, 2011-23
[edit] Source of loans
[edit] 2023

From: Oct 3, 2024: The Times of India
See graphic:
The Sources of loans for household borrowings in India, presumably as in 2023
[edit] See also
Household debt: India
Investments and savings (personal): India
