X/ Twitter and India
(→The usage of Twitter) |
|||
| Line 7: | Line 7: | ||
|} | |} | ||
| − | + | ||
| − | + | ||
| − | + | ||
| Line 78: | Line 78: | ||
Social media will be a distinct factor in this election, felt Kumaraguru, and women politicians appeared to have a lot of clout on social media. “Gender diversity is a universal topic, and we find interesting patterns like female handles re-tweeting more,” said Kumaraguru. “Tweets by females on average get retweeted more than those by men — 550 times compared with 530 times for tweets by males.” | Social media will be a distinct factor in this election, felt Kumaraguru, and women politicians appeared to have a lot of clout on social media. “Gender diversity is a universal topic, and we find interesting patterns like female handles re-tweeting more,” said Kumaraguru. “Tweets by females on average get retweeted more than those by men — 550 times compared with 530 times for tweets by males.” | ||
| + | |||
| + | =The most followed Indians= | ||
| + | ==As in 2020== | ||
| + | [[File: The Indians most followed on Twitter, presumably as in 2020 Feb.jpg| The Indians most followed on Twitter, presumably as in 2020 Feb <br/> From: [https://epaper.timesgroup.com/Olive/ODN/TimesOfIndia/shared/ShowArticle.aspx?doc=TOIDEL%2F2020%2F03%2F03&entity=Ar00508&sk=BD401EF4&mode=text March 3, 2020: ''The Times of India'']|frame|500px]] | ||
| + | |||
| + | '''See graphic''': | ||
| + | |||
| + | '' The Indians most followed on Twitter, presumably as in 2020 Feb '' | ||
| + | |||
| + | [[Category:Culture & Learning|T | ||
| + | TWITTER AND INDIA]] | ||
| + | [[Category:Economy-Industry-Resources|T | ||
| + | TWITTER AND INDIA]] | ||
| + | [[Category:India|T | ||
| + | TWITTER AND INDIA]] | ||
Revision as of 19:25, 15 October 2020
This is a collection of articles archived for the excellence of their content. |
Contents |
Government requests
2012-17: Content removal
India has shown a steady increase in the number of account information and content removal requests sent to Twitter from the government since 2012, with the maximum number of requests made between January and June 2017.
India made 104 requests for content removal and another 261 requests for account information. It was the sixth largest number of requests for account information after the US, Japan, the UK, Turkey and France. Twitter released these numbers in its half-yearly transparency report.
Twitter fulfilled 21% of the 261 account information requ ests India made. These requests covered 659 accounts. This number was up from 168 requests made in July-December 2016, where 427 accounts were specified. Although the number of requests has been lower in previous years, the number of accounts has been significantly higher before.
“These fluctuations and rise in numbers is tough to ascribe to any one factor. It could be because of more people using the service, or because of the government starting to recognise Twitter and social media as places where a law and order problem can occur, or it could be censorship,“ says Parminder Jeet Singh, executive director for Bengaluru-based NGO IT for Change.
2015-18: requests for user data
Digbijay Mishra, Govt requests for info from Twitter surge, December 15, 2018: The Times of India

From: Digbijay Mishra, Govt requests for info from Twitter surge, December 15, 2018: The Times of India
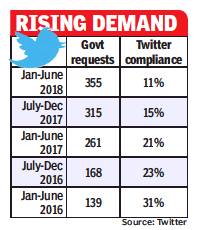
The Indian government wants to know more about what you do on Twitter and its curiosity is only growing. The Centre’s requests from Twitter for user data has risen by over 100% in the last two years, as per the latest transparency report released by the social media major. Between January and June 2018, India sought information on 355 accounts, up from 261 and 139 in the first six months of 2017 and 2016 respectively. Twitter’s transparency data shows that the numbers every six months have been rising.
However, Twitter provided information in the case of only 11% of the requests made by the government in the first six months of 2018. It got 246 requests for removal of accounts in this period and obliged to only about 5% of them. Twitter’s rate of acceptance of government requests has fallen sharply, from 31% in the first half of 2016, to 11% in the latest period. Indian authorities (government, police, court orders) sought to remove 144 accounts in the second half of 2017, and 104 in the first half of that year.
The data showed Twitter withheld (prevented access to) two accounts and 23 tweets in response to a legal demand from the IT ministry for propagating objectionable content. Following legal requests, a total of 19 accounts and 498 tweets were withheld.
The past few years have seen increasingly harsh, often incendiary, posts on social media. More Indians have also flocked to Twitter to air their views. The rising requests from the government is partly a reflection of its attempt to control the more inflammatory posts. When demands are made legally, based on the laws of the land, social media companies are obliged to respect the demand. In other cases, they need to take into account whether accepting the government request would amount to violating the freedom of expression of the user.
In India, between 2012 and 2014, the government sent less than 100 requests for information. But in the first six months of 2015 alone, over 100 requests were made.
India is said to have about 30 million Twitter users, as per estimates by market research firm Statista.
Globally too, government requests have been rising. Twitter said that in the first half of the year, it received 10% more government information requests worldwide, compared to the preceding six-month period — the largest percentage increase since 2015. There was also an 80% rise in global legal demands for removal of accounts in the first six months, compared to the preceding sixmonth period. Close to 90% of these requests came from Russia and Turkey.
The misuse of Twitter
2014
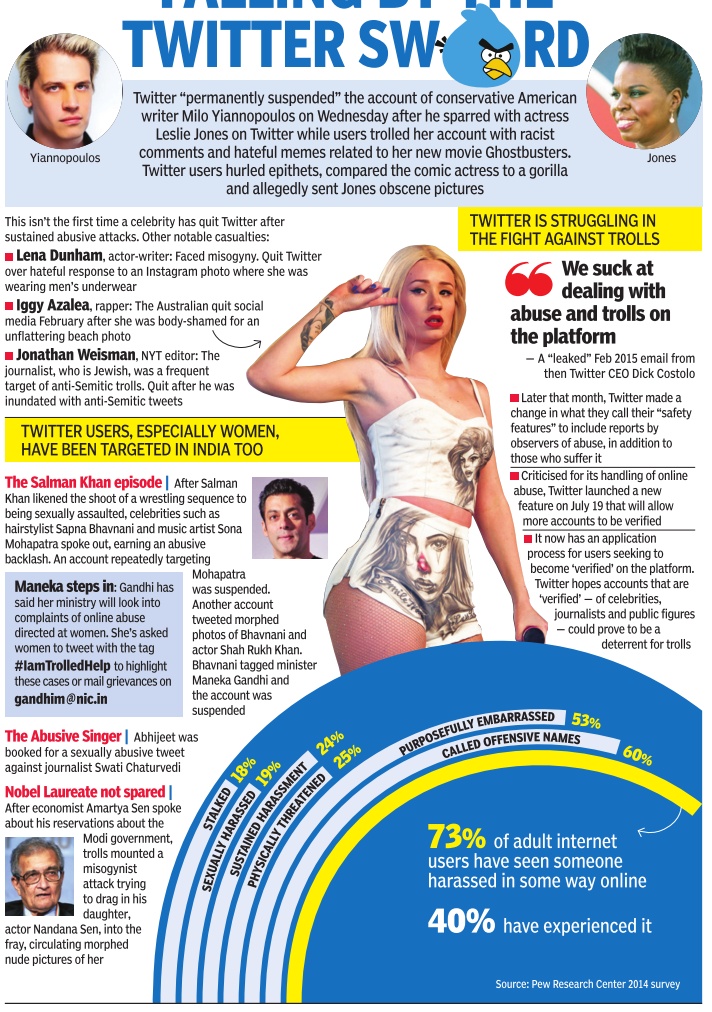
See graphic :
2014:The misuse of Twitter in India and the world, and action taken
The usage of Twitter
2016: The emoji tweeted most often

The Times of India
See graphic :
The emoji tweeted most often, India and the world, 2016
2019: politicians, their parties and their gender

From: Mohammad Ibrar, Get a handle on this: Women calling poll shots on Twitter, March 21, 2019: The Times of India
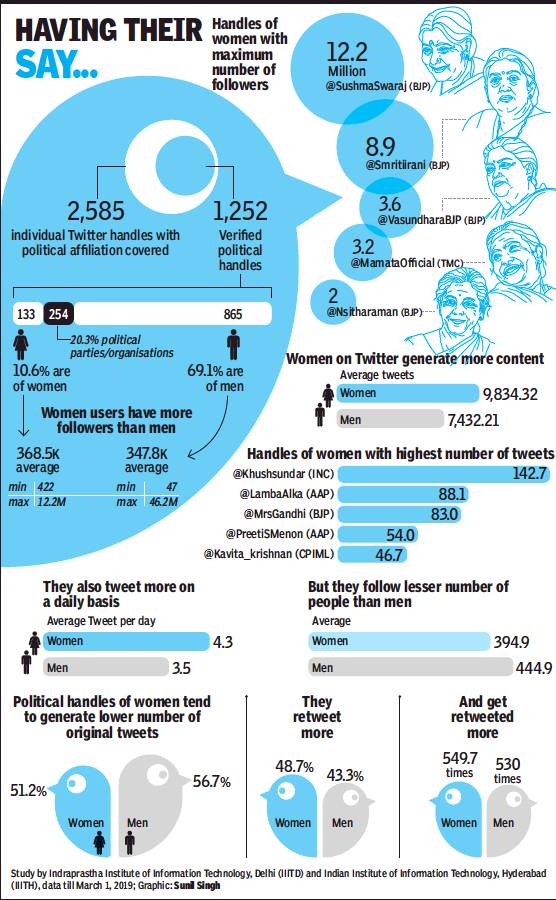
It is politically prudent perhaps to give women their place in politics. After all, as research with Twitter data shows, handles of women on the platform have more followers on average than men and these handles also generate more content than men do. And even if the handles of women produce less original content, their retweets and engagement are high on Twitter, making them an asset for political parties especially in the coming general elections.
Admittedly, of the 1,252 verified political handles analysed, only 133 belonged to female political activists, the rest being those of male politicians or party handles. Analysed and studied at Indraprastha Institute of Information Technology (IIIT) Delhi and International Institute of Information Technology, Hyderabad, by a team of eight students as part of the focus on the 2019 Lok Sabha polls, these were culled after going through “over 21 million posts by roughly a million handles collected from the 2014 general elections”.
Ponnurangam Kumaraguru, associate professor at both IIITs, said he and his team of researchers covered data of over 2,585 Twitter handles which showed some sort of affiliation to an Indian political party. “This list was manually curated and we have been collecting data for these handles from late 2018 through the Twitter Application Programming Interface (API).”
On March 12, Trinamool Congress announced a list of candidates for West Bengal that had over 40% women. Similarly, Biju Janata Dal has said 33% of its candidates in Odisha will be women. A push of this nature is reflective of the increasing female participation on social media. On Twitter, for instance, the study showed that on average, women’s handles had 36,85,000 followers, with the minimum at 422 and the maximum of 12.2 million for external affairs minister Sushma Swaraj.
On average, the feminine handles generated 9,834 tweets each. Compare that with the 7,432 by their male counterparts. This is despite handles belong to men numbering 865, or 69.1%, of the 1,252 verified political handles. A majority of the female tweeters showed their origin to be in Maharashtra, Delhi and UP, the hotbed of political activism.
Social media will be a distinct factor in this election, felt Kumaraguru, and women politicians appeared to have a lot of clout on social media. “Gender diversity is a universal topic, and we find interesting patterns like female handles re-tweeting more,” said Kumaraguru. “Tweets by females on average get retweeted more than those by men — 550 times compared with 530 times for tweets by males.”
The most followed Indians
As in 2020

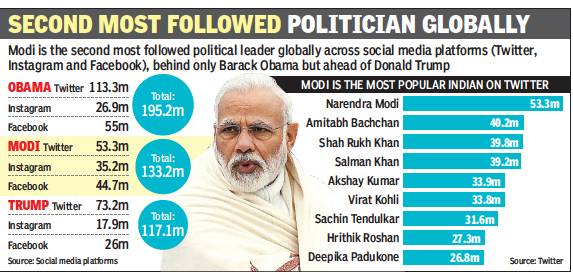
From: March 3, 2020: The Times of India
See graphic:
The Indians most followed on Twitter, presumably as in 2020 Feb
