Elections in India: behaviour and trends (historical)
(→Voter turnout: what does it signify?) |
(→Voter turnout: what does it signify?) |
||
| Line 155: | Line 155: | ||
Andhra the worst with only one out of 42 getting over 50% votes | Andhra the worst with only one out of 42 getting over 50% votes | ||
| + | |||
| + | =Sensex: on the morning after the results= | ||
| + | [[File: sensex after polls.jpg|Sensex movement after poll results |frame| 500px]] | ||
=Voter turnout: what does it signify?= | =Voter turnout: what does it signify?= | ||
| Line 178: | Line 181: | ||
(The writer is founding trustee, IndiaSpend, a non-profi t data journalism initiative) | (The writer is founding trustee, IndiaSpend, a non-profi t data journalism initiative) | ||
| + | |||
=Women in the Lok Sabha= | =Women in the Lok Sabha= | ||
[[File: women historical.jpg| Women in the Lok Sabha |frame| 500px]] | [[File: women historical.jpg| Women in the Lok Sabha |frame| 500px]] | ||
Revision as of 22:19, 26 May 2014
This is a collection of articles archived for the excellence of their content. Readers will be able to edit existing articles and post new articles directly |
Contents |
The two biggest parties: 1952-2014
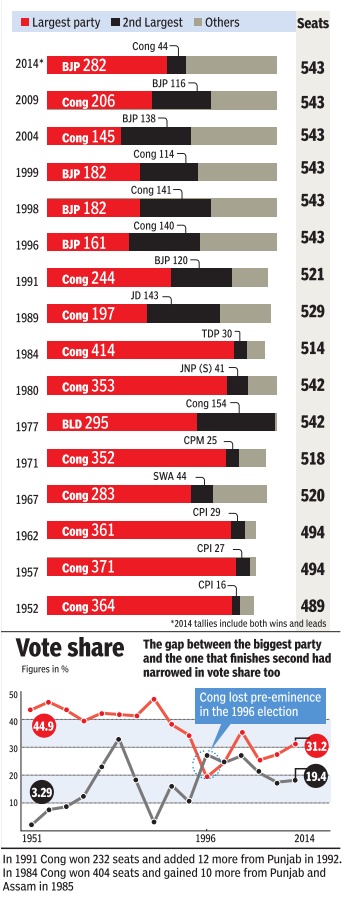
MIND THE GAP
The Times of India May 17 2014
It was a Congres show in the initial elections. By the late 1980s, the picture began to change. With a fragmented polity, coalition governments became the norm. After 25 years, BJP has changed the script winning a decisive majority
Caste
The ‘upper’ castes: voting behaviour
What Johnny won’t see? Upper caste votebank
Why is the support of upper castes for the BJP secular, but that of Muslims for any party communal?
Ajaz Ashraf The Times of India
The 2009 National Election Study, which the Centre for the Study of Developing Studies (CSDS) carried out. It shows 44% of upper castes voted the NDA, down by 9 % from 2004, but the BJP’s decline was just 4%. The UPA bagged 33% of their votes, the Left 10%, the BSP 3%, and Others, a category comprising parties neither in the UPA nor the NDA, 12%. In the 1999 elections, the BJP alone bagged nearly 50% of upper caste votes. [This indicates] an upper caste consolidation
But the incidence of consolidation is far more among other groups, [detractors argue]. The same CSDS study shows 31% of upper OBCs voted the UPA, 27% the NDA, 3% the BSP, 2% the Left, and 37% Others. Take the Dalits, of whom 34% voted the UPA, 15% the NDA, 11% the Left, 21% the BSP, and 20% Others. As for the Muslims, some 47% voted the UPA, of which the Congres bagged 38%, 6% the NDA, 12 % the Left, 6% the BSP, and 29% Others.
This statistical evidence tells a few things. One, other social groups boast as diverse a voting pattern, if not more, as existing among upper castes. Two, voting patterns among all social groups fluctuate over elections. Three, every social group is strongly inclined towards one or two parties which it believes represents its interests.
The tendency to search for Muslim consolidation dates back to the Mandir-Mandal politics, which saw upper castes in significant numbers desert the Congrss for the BJP. But their heft was diminished because Muslims and Dalits, who had sustained Cogress domination for decades, didn’t follow them into the BJP. The myth of Muslim consolidation helps spawn mobilisation of Hindus to offset the numerical disadvantage of upper castes, among whom the BJP is most favoured.
True, Muslims vote tactically in every constituency to vanquish the BJP.
The author is a Delhi-based journalist
Scheduled caste (‘reserved’) seats in UP: the trend
Sub-caste challenge awaits BSP in reserved seats
TIMES NEWS NETWORK The Times of India
Lucknow: BSP may be rushing in to campaign for candidates in reserved constituencies in UP, but past experience shows that the party has performed poorly in these seats.
In 2009, BSP, which claims to be a party of dalits, was able to register a win in only two of the 17 reserved constituencies. Experts say the stumbling block is not only the uncertain transfer of Brahmin votes to dalit candidates but also that sub-castes within the scheduled castes (SCs) make it tough for the party to sail through.
While the BSP won Lalganj and Misrikh seats, its arch-rival, the Samajwadi Party (SP), won nine reserved seats, the Congres three and the BJP two. And the BSP has never won from reserved seats such as Nagina, Shahjahanpur, Hardoi, Basgaon, Mohanlalganj and Bulandshahr.
“Even this time, the Brahmin votes are unlikely to be transferred to the party,” said a district coordinator in a reserved constituency. “Since all parties put up SC candidates on these seats, the question of sub-castes in the SC category comes into play.”
C S Verma, a senior fellow at the Giri Institute of Development Studies in Lucknow, says that local-level politics come into effect in the reserved constituencies. “There’s a clear-cut fragmentation within the dalits.”
On the other hand, the BJP has the support of upper castes and some backward classes. Hence, the SP and the BJP score over the BSP in reserved constituencies.
Studies show out of 66 SCs, Chamars have the highest number, constituting 56.3% of the total SC population. Pasis happen to be the second largest group, forming 15.9% of the SC population. These two sub-castes combined with Dhobis, Koris and Valmikis constitute 87.5% of the total SC population.
While Chamars are concentrated in Azamgarh, Jaunpur, Agra, Bijnor, Saharanpur, Gorakhpur and Ghazipur districts, Pasis are is in Sitapur, followed by Rae Bareli, Hardoi and Allahabad. The other three major groups — Dhobi, Kori and Valmiki — have the maximum population in Bareilly, Sultanpur and Ghaziabad districts.
Corruption: Does not bother the voter
Is graft really a big election issue? Stats say otherwise
Deeptiman Tiwary TNN
New Delhi: Is corruption really an issue in elections? Some surveys claim people worry more about the economy than corruption. Data for 2004 and 2009 general elections show that not only do parties continue to repeatedly field candidates facing graft charges, people even vote for them.
Analysis of affidavits filed by Lok Sabha candidates shows that in 2004, parties fielded a total of 12 candidates facing cases under Prevention of Corruption Act (PCA). Of them, nine won. In 2009, 15 candidates with PCA cases were in the fray with four emerging victorious. Both elections combined, 27 such candidates contested and 16 of them won — a success rate of almost 60%.
Data also shows only one of 2004’s winners (SP’s Rashid Masood) with graft cases lost in 2009. Of the nine winners in 2004, only three (including SAD’s Rattan Singh and RJD chief Lalu Prasad) contested in 2009. Among other winners of 2004, BSP chief Mayawati was UP CM at the time of the 2009 polls and SAD’s Sukhbir Singh Badal was Punjab deputy CM. One candidate died while others did not contest.
A recent survey by Lok Foundation and University of Pennsylvania’s Centre for Advanced Study of India says corruption has found some traction with voters this election, but is still at second position compared to economic growth.
Social and political theorist and Centre for the Study of Developing Societies professor Aditya Nigam says though people seemed to have accepted graft as a part of life until recently, this election could be different. “Giving bribes at every step for decades had made people accept corruption as their destiny. But the Anna Hazare-led anti-corruption movement and Arvind Kejriwal’s AAP have changed that feeling. Economic growth is too abstract an idea to attract masses unless someone breaks it down for them.”
Funds
Funding by the bigger corporates

2012-13: big donors prefer BJP over Congres
Did big donors pick BJP over Congres?
In 2012-13, Saffron Party Collected 83Cr, Its Rival 11Cr, Show Papers Filed With EC
Pradeep Thakur TNN The Times of India
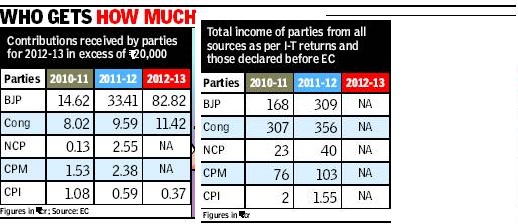
New Delhi: The BJP’s coffers had started swelling much before support for its prime ministerial candidate Narendra Modi turned into a wave. The party collected a record Rs 82.82 crore from declared donors in 2012-13, leaving the ruling Congres trailing in its wake with just Rs 11.42 crore in the same period.
This was revealed in the latest contribution reports submitted by parties to the Election Commission (EC) in which they have to declare donations in excess of Rs 20,000. While BJP’s contribution report runs into 188 pages, and was among the last few to be filed with the EC on March 26, the Congres report ends in 49 pages.
These contributions, however, are just a fraction of what the parties actually receive. Up to 90% of the funds of these parties come through sale of coupons and other sources where donors’ names are not disclosed. BSP has claimed year after year that all its donations are less than Rs 20,000 each. Like BSP, other parties such as Trinamool Congres and AIADMK have said they did not receive any contribution above Rs 20,000.
NCP and CPM are among those yet to submit their contribution reports, sources said. CPI declared Rs 37 lakh in contributions and named its donors.
The income of parties for 2012-13 will be known only after a year when they file their I-T returns. As of now, the 2012-13 contribution reports are the latest available data on parties’ income.
A request is pending with the Central Board of Direct Taxes to investigate the accounts of all major parties which have together earned more than Rs 4,900 crore between 2004-05 and 2011-12. The Association for Democratic Reforms, which has analysed parties’ income through their I-T returns, has petitioned CBDT to probe these anonymous donors.
The biggest beneficiary in the eight years has been Congres, having collected more than Rs 2,300 crore, followed by BJP with a total income of Rs 1,300 crore. BSP, which claims all its donors are anonymous, collected Rs 497 crore. CPM collected Rs 521 crore, NCP Rs 201 crore and CPI Rs 10 crore.
Mandate/ representativeness
One MP for 16,00,000 voters
Mind the gap: 1 MP for 16L voters
Keeping In Touch With Electors Tough
Subodh Varma | TIG The Times of India
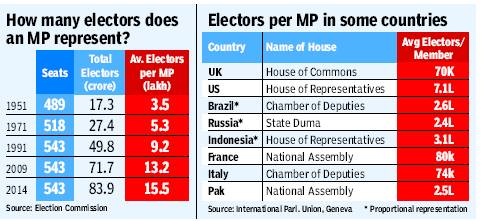
For the 2014 general elections, over 84 crore/ 840 million people are registered as voters as per the latest Election Commission figures. They will elect 543 MPs. That means on average, each MP represents over 15.5 lakh voters. That’s almost four and a half times the number of voters per MP in the first general elections held in 1951-52.
Voters have been increasing because population is increasing. But the number of seats in Lok Sabha has not increased since 1977. As a result, an MP has to represent more and more people with each passing election.
This anomaly gets stranger if you look at statewise averages of voters per MP. For the coming election, a Rajasthan MP will represent nearly 18 lakh voters on average, while one from Kerala will represent just 12 lakh voters. This is among the bigger states, not counting the smaller states and UTs where MPs can get elected with as low an electorate as 50,000 as in Lakshadweep or four to eight lakh in the Northeast.
In the 2008 delimitation, standardization of constituencies did not take place as it would have meant creating more constituencies in states like Rajasthan or Bihar with higher population growth rates, and cutting down in states like Tamil Nadu or Kerala with lower population growth, says election expert Sanjay Kumar, director of New Delhi-based think tank Centre for Studies of Developing Societies.
“It would have meant penalizing states that have successfully restricted their population. This was not fair,” he explained.
So, constituency numbers were kept the same within states, leading to the present anomalous ratio of voters per MP. Nowhere in the world is there such a high ratio of voters per elected representative. The closest would be the US where the average number of voters per House of Representatives member is about 7 lakh.
All this leads to an increasing disconnect between people and elected representatives, turning serious as elections approach. In two weeks candidates have to somehow contact 15 lakh people. With increasing restrictions on overt spending – on posters, vehicles or public meetings – the dynamic of contesting elections is fast changing. And so is covert spending. Increasing use of electronic media or Web-based platforms is also driven by this compulsion.
Once the MP is elected, the responsibility of staying in touch with the voters also is more difficult.
Although the MP is not supposed to be looking after day-to-day issues like roads or drinking water or whether doctors are there in health centres, in India’s topsy turvy democracy it doesn’t work like that.
“People expect their elected representatives to solve everything. They don’t make a distinction between what an MP is responsible for and what a local councillor is supposed to do,” says Kumar.
In reality, the elected representatives too don’t follow these distinctions when it comes to promises, so the people can’t be blamed.
So, what is the solution? In the future, there is no option but to increase the number of seats in the Parliament opines Kumar. But for now, the unwieldy electoral system will have to bumble along.
Are candidates elected by at least 50% of the voters?
Only 120 winning candidates in ’09 got over 50% votes
TIMES NEWS NETWORK
New Delhi: Is our democracy truly representative? Election Commission (EC) data on percentage of votes secured by winning candidates shows it may not be so. In the 2009 general elections, only 120 winning candidates out of the 543 could secure 50% or more votes polled in their respective constituencies.
This meant that on remaining 423 seats (nearly 78% of seats), the winning candidates had the approval of less than half of the electorate. Elections to the Lok Sabha are carried out using the first-past-the-post electoral system, in which the candidate securing the maximum votes of the total votes polled is declared elected, irrespective of the percentage of votes polled or the total number of eligible voters.
The EC data has a silver lining though. Delhi, Rajasthan, West Bengal, Kerala, Gujarat and Maharashtra are some of the better states in terms of consolidation of votes in the favour of winning candidates. While Delhi had six out of seven candidates winning more than 50% votes, Rajasthan was second best with 15 of the 25 winning candidates in that category.
Half of the 42 winning candidates in West Bengal secured the approval of more than 50% of the electorate. Among the worst performing states is Andhra Pradesh where only one out of 42 candidates could get more than 50% votes polled.
DELHI TOPS
Delhi first in vote consolidation, Rajasthan second
Half of the 42 winning candidates in Bengal got over 50% votes
Andhra the worst with only one out of 42 getting over 50% votes
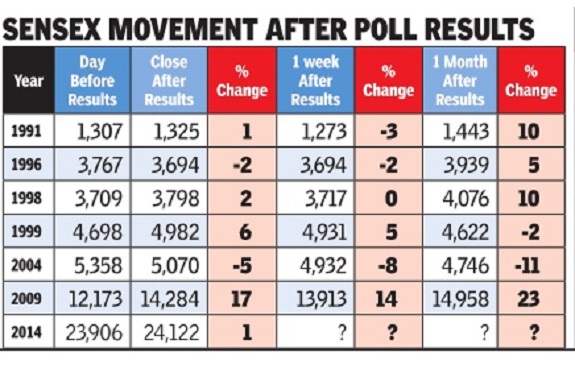
Sensex: on the morning after the results
Voter turnout: what does it signify?
High turnout doesn’t signal a wave
‘Long Queues Outside Booths Don’t Necessarily Mean Doom For Incumbent, Desire For Change’
Praveen Chakravarty The Times of India
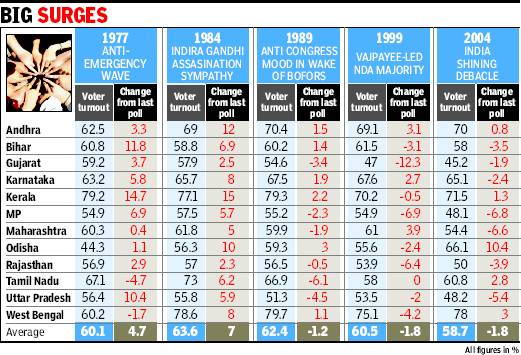
Television anchors, columnists and poll pundits have been taking the line that a high voter turnout in the current Lok Sabha elections is the result of a “wave” sweeping the country. The average turnout in the 438 constituencies that finished voting until April 30 reportedly shows an eight percentage point increase over the 2009 elections. As election chatter moves away from candidates, their wealth, wives and lineage to voter turnout and its significance, it is pertinent to ask two questions: Does high voter turnout correlate to any national trend? Does high voter turnout signal anti-incumbency?
This analysis (see box) studies five “wave” elections — 1977 (anti-Emergency), 1984 (Indira Gandhi assassination), 1989 (Bofors scandal), 1999 (Vajpayee wave) and 2004 (India Shining) and compares change in voter turnout vis-à-vis the previous election across the 12 largest states that account for 82% of all seats. The 1984 election after Indira Gandhi’s assassination, where a sympathy wave was said to turn the tide in favour of Congres, witnessed a seven percentage points increase in voter turnout in these 12 states versus the 1980 election, the highest-ever increase. And all 12 states saw an increased turnout in this election. The 1977 election, after Emergency was lifted, saw a 4.7 percentage point increase versus the previous Lok Sabha election (1971).
The other three supposed “wave” elections — 1989, 1999 and 2004 had a lower turnout than the polls immediately prior to them. Voter turnout numbers are not comparable and somewhat meaningless given the wild fl uctuations in voter lists across elections. It is not abundantly clear from data that higher voter turnout correlates with any national sentiment or wave.
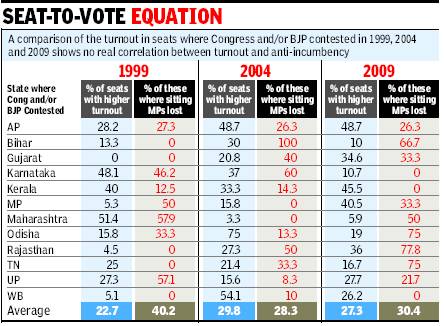
The other popular perception is that voter anger leads to higher voter turnout and hence anti-incumbency. We analysed 1,174 constituencies across three elections in the 12 largest states for the last three elections (1999, 2004 and 2009) where Congres and/or BJP had a candidate contesting. The results show that there is no significant correlation between higher turnouts and loss for an incumbent MP. (Higher turnout is defined as higher than the previous Lok Sabha election and higher than the average turnout in that state).
In the 1999 election, 40% of incumbents lost where there was a higher voter turnout, 28% in 2004 and 30% in 2009. In other words, not even half of incumbent MPs lost the election when there was a higher voter turnout in their constituency. Hence, it is not possible to draw a direct correlation between higher turnout and anti-incumbency. There is also substantial variation across the 12 largest states in terms of anti-incumbency (see box). For example, in the 2004 elections in Bihar, every incumbent MP lost in a constituency where turnout was higher but in Madhya Pradesh, none of the incumbent MPs lost where turnout was higher. Similarly, in the 2009 elections, 75% of incumbents in Orissa lost but none in Kerala. It is evident that regional context is a far bigger driver of anti-incumbency than mere voter turnout or national sentiment.
Voter turnouts across most democracies are a fascinating trend to observe and paint themes. It is even more interesting in large and old democracies such as India and the US where voting is not mandatory and hence the choice to exercise one’s vote during a particular election represents a certain motivation. The sheer size of India’s national elections and Election Commission data make it plausible to analyse and tell stories of how we vote, why we vote and who we vote for. If we believe what we see in our politics is who we are as a society, electoral data can be a true mirror to ourselves.
(The writer is founding trustee, IndiaSpend, a non-profi t data journalism initiative)
Women in the Lok Sabha
NO ROOM IN THE HOUSE FOR WOMEN
The Times of India May 17 2014
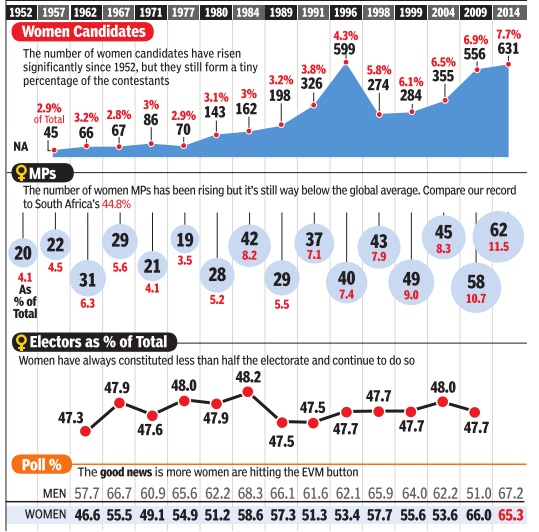
Women make up 49% of the population but only 7.7% of the total candidates (8,163) contesting in 2014 are female. One third of the 631 women candidates are independents. Congres had the largest number (57) while BJP fielded only 37. Women now often outnumber men in polling queues but clearly parties haven't woken up to this new scenario (Chart: Women in the Lok Sabha)
