Karnataka: Assembly elections
(→SC dominant constituencies) |
(→2008) |
||
| Line 106: | Line 106: | ||
''The constituency-wise position of the main political parties in the elections to the Karnataka Legislative Assembly in 2008- ST dominant constituencies'' | ''The constituency-wise position of the main political parties in the elections to the Karnataka Legislative Assembly in 2008- ST dominant constituencies'' | ||
| + | |||
| + | =2018= | ||
| + | ==The position of the main parties== | ||
| + | [[File: How Karnataka voted in 2018.jpg|How Karnataka voted in 2018 <br/> From: [http://www.thehindu.com/elections/karnataka-2018/live-results-analysis/ May 16, 2018: ''The Hindu'']|frame|500px]] | ||
| + | |||
| + | [[File: Karnataka 2018 results, assembly elections.jpg|Karnataka 2018 results, assembly elections <br/> From: [http://www.thehindu.com/elections/karnataka-2018/live-results-analysis/ May 16, 2018: ''The Hindu'']|frame|500px]] | ||
| + | |||
| + | '''See graphics''': | ||
| + | |||
| + | ''How Karnataka voted in 2018'' | ||
| + | |||
| + | ''Karnataka 2018 results, assembly elections'' | ||
Revision as of 09:14, 17 May 2018
This is a collection of articles archived for the excellence of their content. |
Contents |
Election-wise results
May 12, 2018: The Times of India
1978
The political map
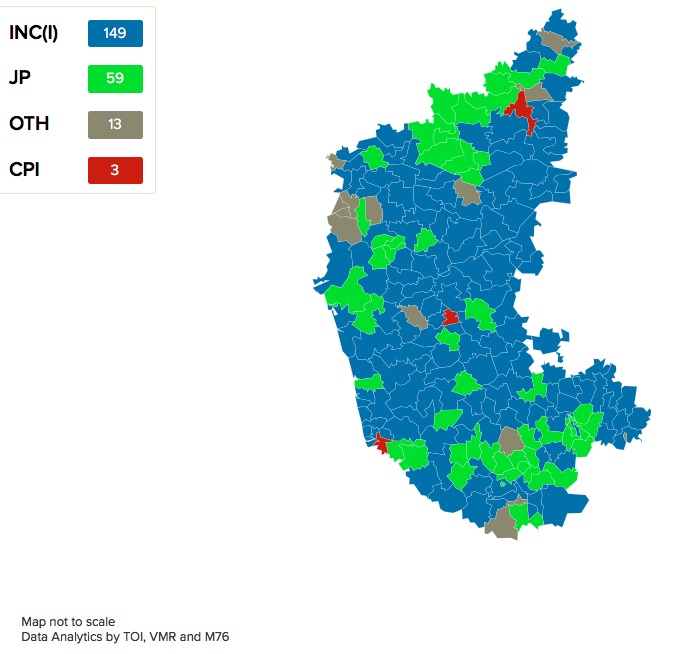
From: May 12, 2018: The Times of India
See graphic:
The constituency-wise position of the main political parties in the elections to the Karnataka Legislative Assembly in [1978]
1983
The political map

From: May 12, 2018: The Times of India
See graphic:
The constituency-wise position of the main political parties in the elections to the Karnataka Legislative Assembly in (1983)
1985
The political map
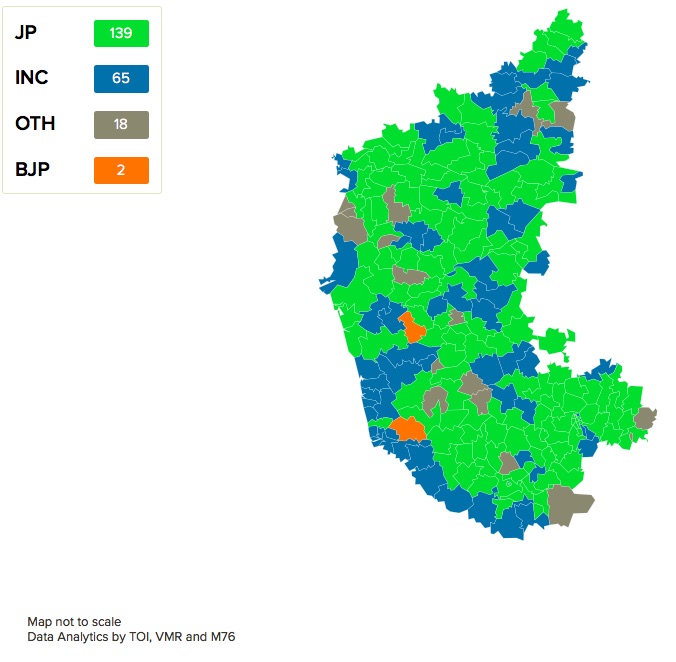
From: May 12, 2018: The Times of India
See graphic:
The constituency-wise position of the main political parties in the elections to the Karnataka Legislative Assembly in 1985
1989
The political map

From: May 12, 2018: The Times of India
See graphic:
The constituency-wise position of the main political parties in the elections to the Karnataka Legislative Assembly in 1989
1994
The political map
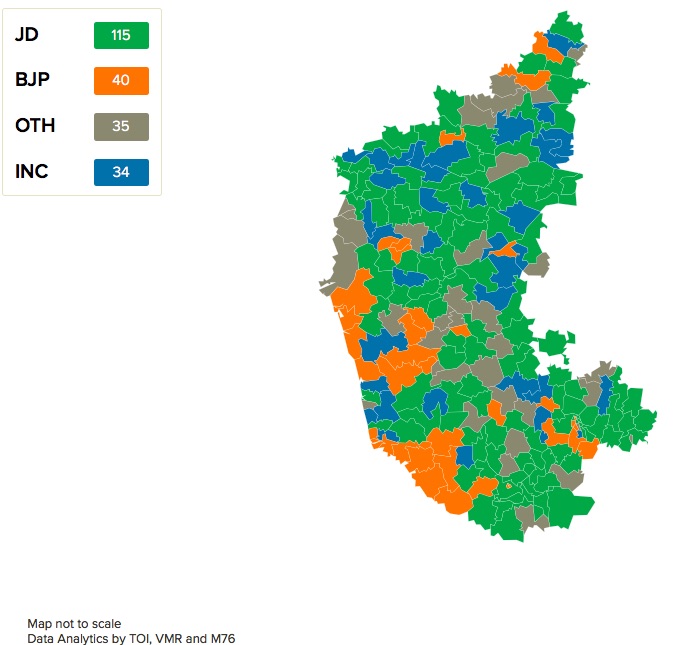
From: May 12, 2018: The Times of India
See graphic:
The constituency-wise position of the main political parties in the elections to the Karnataka Legislative Assembly in 1994
1994
The political map
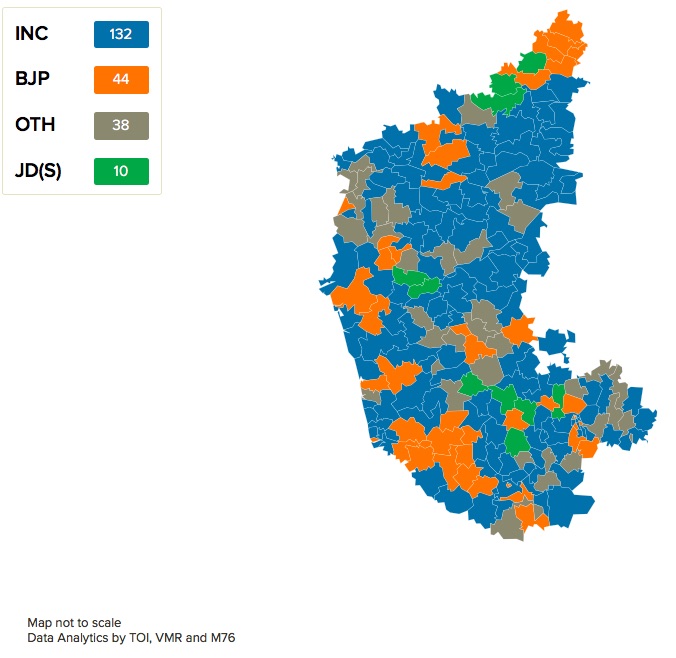
From: May 12, 2018: The Times of India
See graphic:
The constituency-wise position of the main political parties in the elections to the Karnataka Legislative Assembly in 1999
2004
The political map
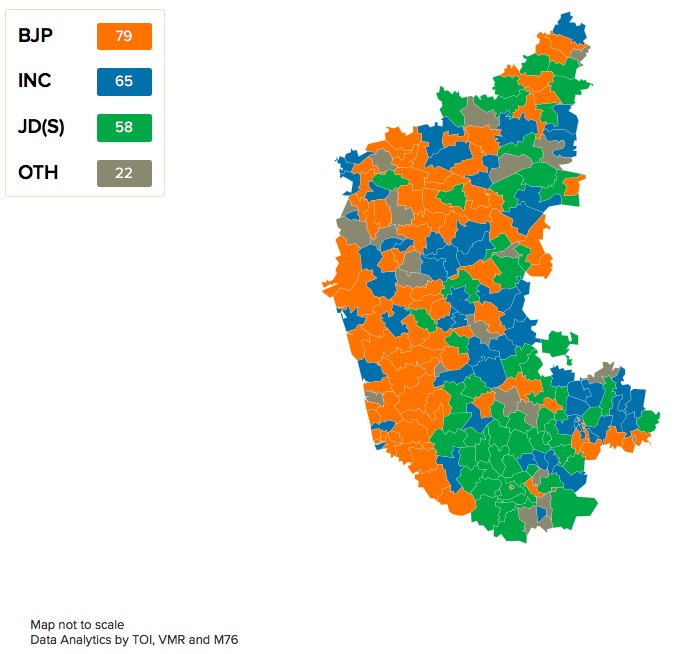
From: May 12, 2018: The Times of India
See graphic:
The constituency-wise position of the main political parties in the elections to the Karnataka Legislative Assembly in 2004
2008
The political map, community-wise
Lingayat dominant constituencies
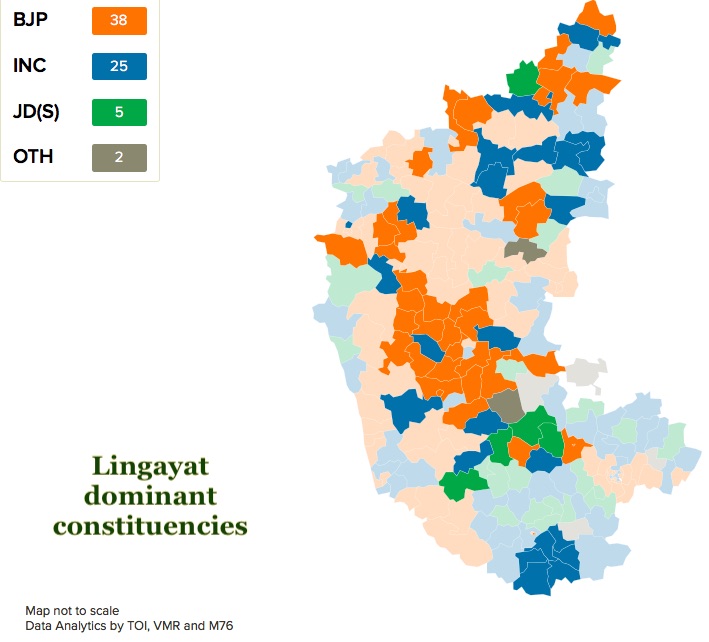
From: May 12, 2018: The Times of India
See graphic:
The constituency-wise position of the main political parties in the elections to the Karnataka Legislative Assembly in 2008- Lingayat dominant constituencies
Muslim dominant constituencies
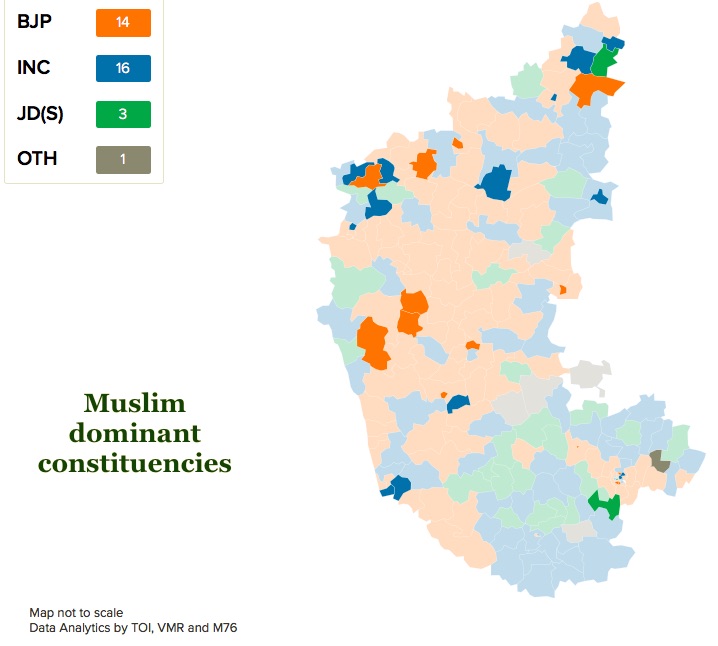
From: May 12, 2018: The Times of India
See graphic:
The constituency-wise position of the main political parties in the elections to the Karnataka Legislative Assembly in 2008- Muslim dominant constituencies
Vokkaliga dominant constituencies
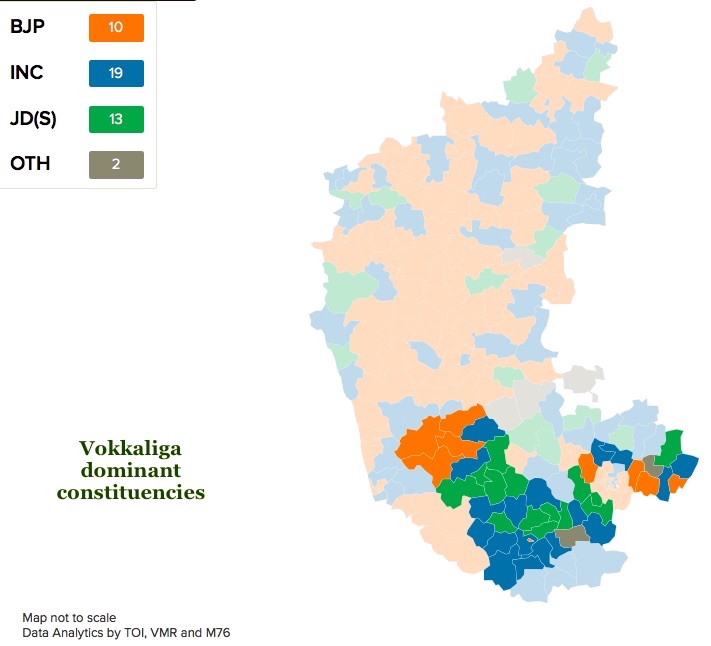
From: May 12, 2018: The Times of India
See graphic :
The constituency-wise position of the main political parties in the elections to the Karnataka Legislative Assembly in 2008- Vokkaliga dominant constituencies
SC dominant constituencies
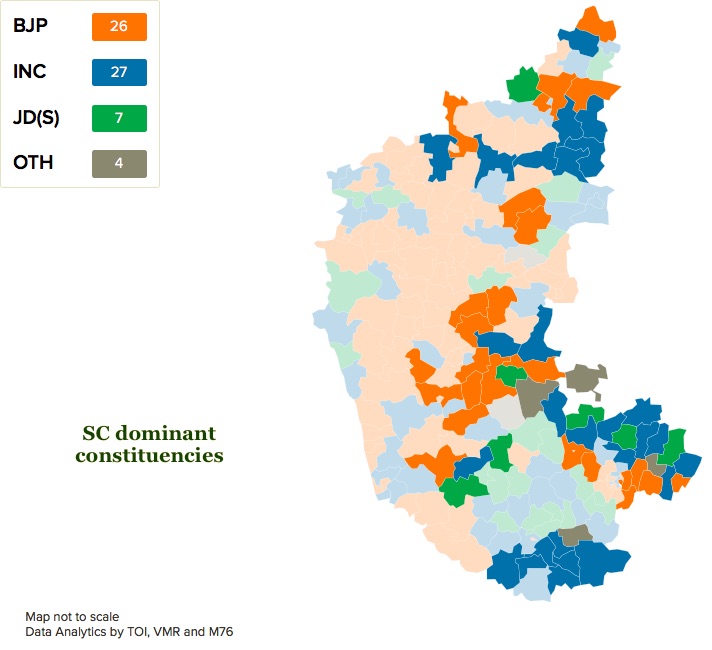
From: May 12, 2018: The Times of India
See graphic:
The constituency-wise position of the main political parties in the elections to the Karnataka Legislative Assembly in 2008- SC dominant constituencies
ST dominant constituencies
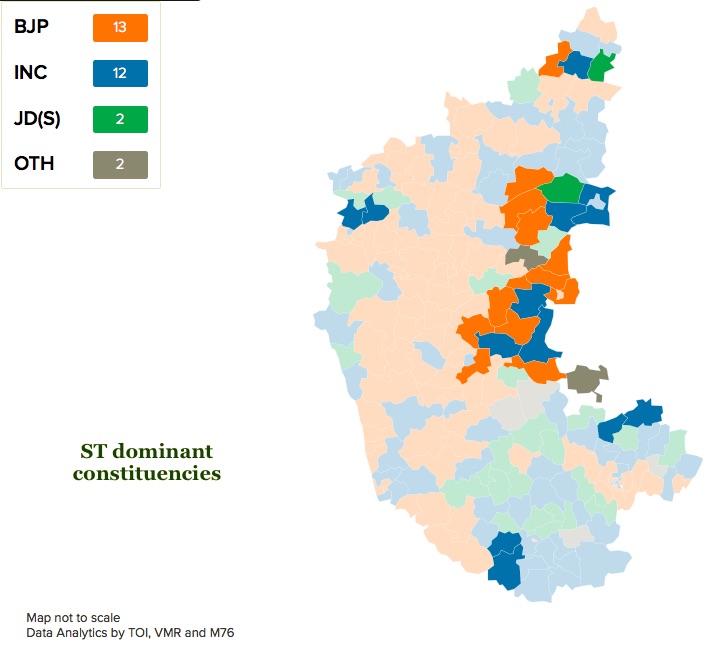
From: May 12, 2018: The Times of India
See graphic:
The constituency-wise position of the main political parties in the elections to the Karnataka Legislative Assembly in 2008- ST dominant constituencies
2018
The position of the main parties

From: May 16, 2018: The Hindu

From: May 16, 2018: The Hindu
See graphics:
How Karnataka voted in 2018
Karnataka 2018 results, assembly elections