Investments and savings (personal): India
This is a collection of articles archived for the excellence of their content. |
Contents |
India’s investable, personal wealth
2017: India was no.11 in the world
India’s personal wealth may grow at 13%: Report, October 9, 2018: The Times of India
The US leads the chart in terms of total personal wealth with $80 trillion in 2017, which is projected to touch $100 trillion by 2022. China is ranked second, with a total personal wealth of $21 trillion, which is expected to more than double to $43 trillion by 2022.
The report noted that India constitutes the second largest pool of wealth from emerging markets in the coming years, with $2.2 billion. It is the fifth largest Asian market in number of affluent, high net worth, and ultra high net worth individuals. There were 322,000 affluents, 87,000 high net worth individuals and 4,000 ultra high net worth individuals in the country in 2017, according to the report. It observed that nearly 70% of the country’s personal financial wealth would be accessible to wealth managers in 2022.
The 70% investable wealth in the country includes listed equity, bonds, investment funds, currency and deposits, and other smaller asset classes, while 30% non-investable wealth includes life insurance and pensions, unlisted equity and other equity.
Investment in stock markets, banks, mutual funds, gold
1995-2015
The Times of India, Nov 02 2015
Uma Shashikant
Much has changed in the way India invests since 1995, and mostly for the better
Everyone is celebrating 20-year milestones these days. The nice thing about history is that we can attempt to explain the present by looking at the past, with the benefit of hindsight. What then seemed tough, foolish and difficult, seems pathbreaking today. Then there are things that do not change, ever. It's my turn to do the 20-year flashback this week. Stock markets
In June 1994, a new wholesale market for debt was set up. Funded by institutions, it used the best satellite technologies and tried to create a market where institutions would buy and sell debt securities.But the debt markets in India were not ready for it. The leaders changed course and deployed the systems to create a new equity market. It wasn't easy .
Equity markets were already being served by 20+ stock exchanges, the oldest and largest in the same city as the new one. The new market went ahead nevertheless, permitting trades in equity shares listed on other exchanges on its satellite-linked electronic system.
In 1995, the experiment succeeded.The new market overtook the old in business. The National Stock Exchange (NSE) is an example of how a new entity can bring about positive change. How it can create a new system with higher efficiency , lower costs, wider participation, better technology and higher integrity .NSE modified how investors trade in India, creating a trading, clearing and settlement system on par with the best.
Banks
In January 1995, HDFC Bank opened its first branch in Mumbai. In March 1995, it offered shares to the public in an IPO priced at `10 per share, to mobilise `50 crore. The issue was oversubscribed 55 times and opened to trade at `40. The popular opinion was that the bank would soon merge with its illustrious parent.
All through the 1990s, public sector banks hogged the limelight for their equity offerings. No one gave private sector banks much of a bright prospect.
The PSU banks were well entrenched.They were bankers to the government and public entities. The cost of funds for the public sector banks was low, and the regulatory requirements was uniformly applicable to the new private banks too.If the new banks tried to bring in sophistication and technology , they had to face competition from foreign banks, that held a monopoly over the NRI and remittance businesses, apart from working with the large private corporate treasuries. Where was the room for new private banks? Twenty years on, private banks have built a new retail lending market that is large and growing. They have captured a large share of the institutional business. They offer superior technologies and service, and have managed to do so at a lower cost compared to their public sector counterparts, and have stronger, better and bigger balance sheets.
Mutual Funds
If one looked at mutual funds in 1995, UTI dominated with over 90% market share.While the other players were trying to find their feet, UTI was launching a slew of monthly income plans (MIPs) which promised double digit returns. The other public sector mutual funds were suffering the consequences of faulty product launches in 1991-92. They had sold 7-year closed end equity funds, with the promise of doubling and tripling the returns, and the NAVs were nowhere near target.
The new private sector funds did their best to market their products, but did not mobilise much money from investors who were worried about the lack of liquidity . Mutual funds had to list on the market and it was common for prices to be lower than the NAV . Approvals were tough to get. Banks and institutions were not selling funds, yet.
It was in 1995 the first wave of process innovation hit the mutual fund industry with open-ended funds with account statements and no certificates. Dividend and growth options were offered and banking distribution was tied up. But the struggle was with the idea of assured returns that investors clamoured after.
In 1995, when global investors were asking for depository and T+3 rolling settlement, what we had then seemed rudimentary . Today, the NSE has helped set up several stock markets across the world and is a model for risk management and settlement guarantees. In 1995, it seemed banking belonged to the public sector.Today , the success of private banks has established that PSU banks will have to restructure or fade away .
As for mutual funds, there is enough evidence to establish that a diversified portfolio over the long run beats all other investment options. But investors seem busy trading stocks and investing in bank deposits, and not engaging enough with funds. The plague of new schemes sold with inflated promises and performing schemes staying in the background has not changed. Not in 20 years.
2007-16
The Times of India, Feb 02 2017
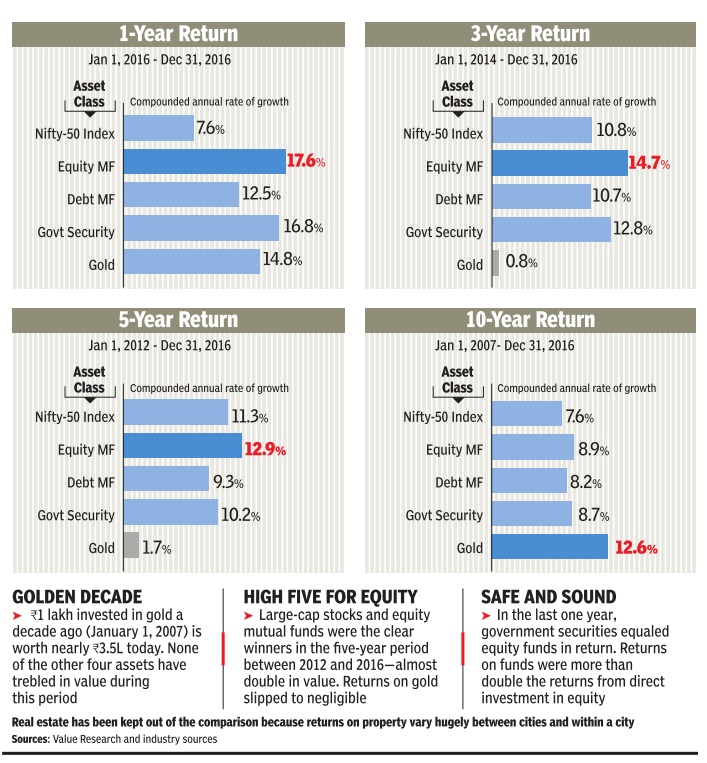

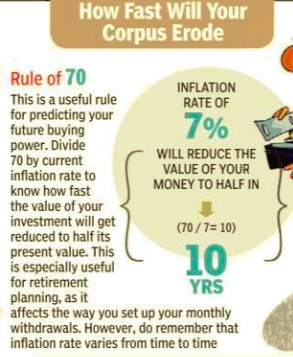
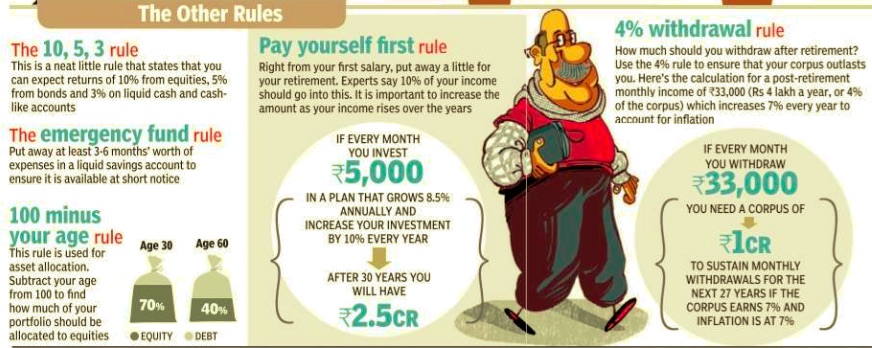

No one asset outperforms others consistently over time. In the past one year, equity mutual funds and government securities gave higher returns than other assets. Over 10 years, it's gold that beats all other asset classes. For consistent long-term gains, put your eggs in several baskets. Of course, returns is only one of the three criteria to look for before investing--safety and liquidity are the other two. Government securities, the safest investment option, matched returns from equity funds last year. But this is a rare occurence
2008, 2014-19

From: February 2, 2020: The Times of India
See graphic:
2008, 2014-19: household savings in India
2011-18: household savings
India’s household financial savings at a new high, November 30, 2018: The Times of India
From: India’s household financial savings at a new high, November 30, 2018: The Times of India
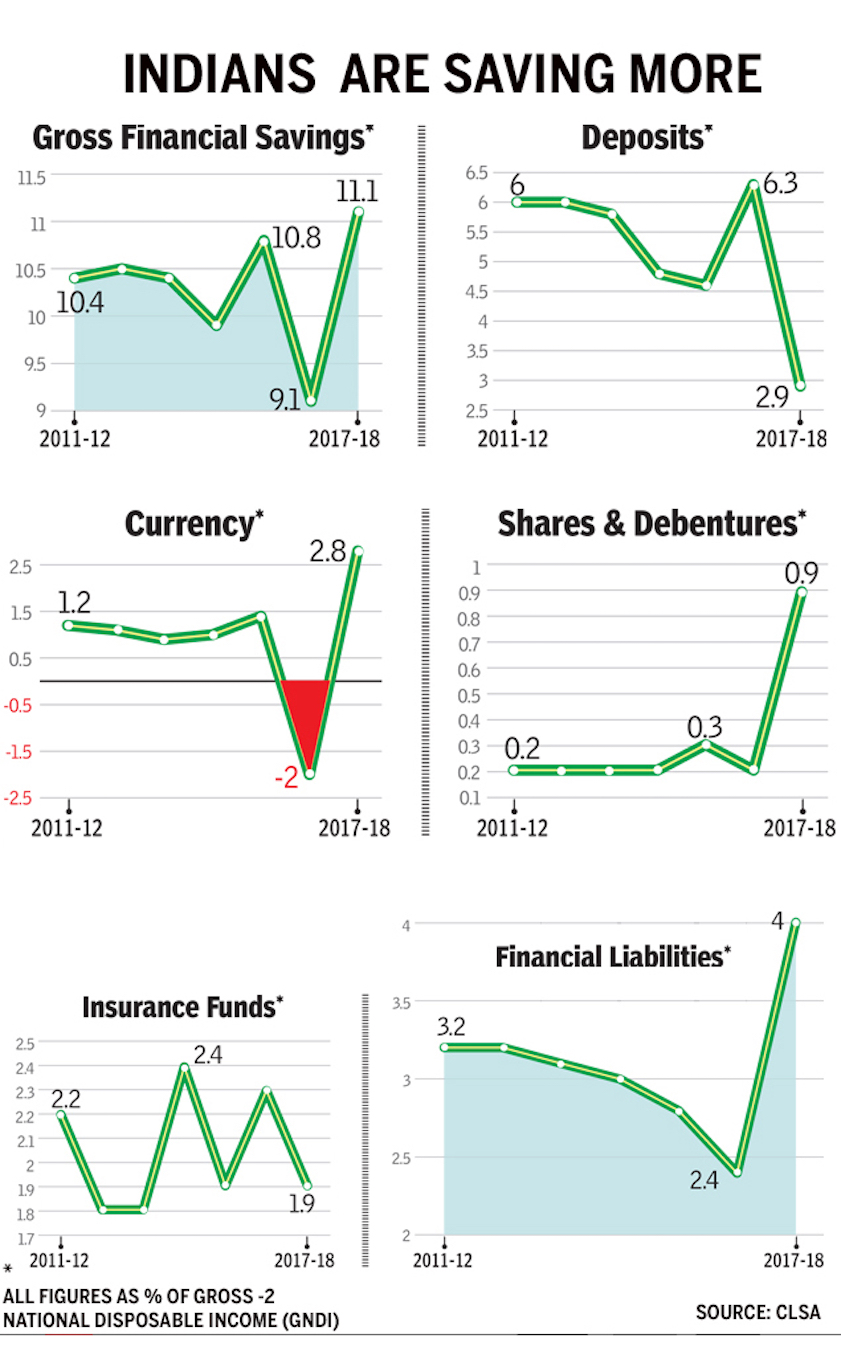
The share of financial savings by Indian households has touched a high of 11.1% of gross national disposable income (GNDI). However, the share of deposits, which rose to a high of 6.3% on the back of demonetisation in 2016-17, has shrunk to 2.9% of GNDI. But households are borrowing much more, as reflected in the financial liabilities, which has grown to a high of 4%.
2016: FDs top
FDs most preferred saving option: Survey, April 6, 2017: The Times of India

More than 95% households prefer to park their money in bank deposits, while less than 10% opt to invest in mutual funds or stocks. Life insurance was the second most preferred investment vehicle, followed by precious metals, post office savings instruments and real estate, a survey by Sebi showed. It also showed that mutual funds came in at the sixth place (9.7%), followed by stocks (8.1%), pension schemes, company deposits, debentures, derivatives and commodity futures (1%) as investment vehicles for the urban households. Respondents were allowed to select multiple options.
The survey , conducted across urban and rural areas of the country , showed that among rural households, not even 1% of the survey respondents were investors, while even the awareness about mutual funds and equities was dismal at just 1.4%.
However, 95% of rural survey respondents had bank accounts, 47% life insurance, 29% post office deposits and 11% saved in precious metals. On a positive note, the survey found the investor base in India increasing, as nearly 75% of the respondents said they had participated in securities markets for the first time in the last five years. The survey had a sample size of 50,453 households and using a bootstrapping methodology , it was estimated there were a total of 3.37 crore investor households in India. Of these, 70% reside in urban areas.
As in 2021 Jan
See graphic:
Investment in stock markets, banks, mutual funds, gold, in the period ending 2021 Jan
2017: 8 lakh crore equities and mutual funds
Indians invested more in stocks than in FDs in FY17, December 13, 2017: The Times of India
From: Indians invested more in stocks than in FDs in FY17, December 13, 2017: The Times of India
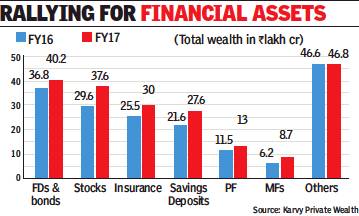
Indian investors are finally moving from bank fixed deposits (FDs), real estate and gold, the traditional investment products, to equities and mutual funds. In fiscal 2017, Indians invested Rs 8 lakh crore in stocks compared to Rs 3.4 lakh crore in FDs.
At the end of FY17, total investments by Indians in equities at Rs 37.6 lakh crore was just Rs 2.5 lakh crore short of total FDs, pegged at Rs 40.1 lakh crore. This is the closest that the total equity wealth of Indian investors have ever come to bank FDs, a report by Karvy Private Wealth showed. At the end of FY16, the difference was over Rs 7 lakh crore with Rs 36.8 lakh crore in FDs compared to Rs 29.6 lakh crore in stocks, the report showed.
The firm believes total investments by Indians in equities will surpass wealth in bank FDs by the end of the current fiscal. “After losing a bit of traction, financial assets have regained their pole position in FY17. Wealth creation through equities has not been restricted to big institutional investors as individual participation, too, saw a huge jump via the direct as well as mutual funds route,” said Abhijit Bhave, CEO, Karvy Private Wealth.
Returns
2006-15
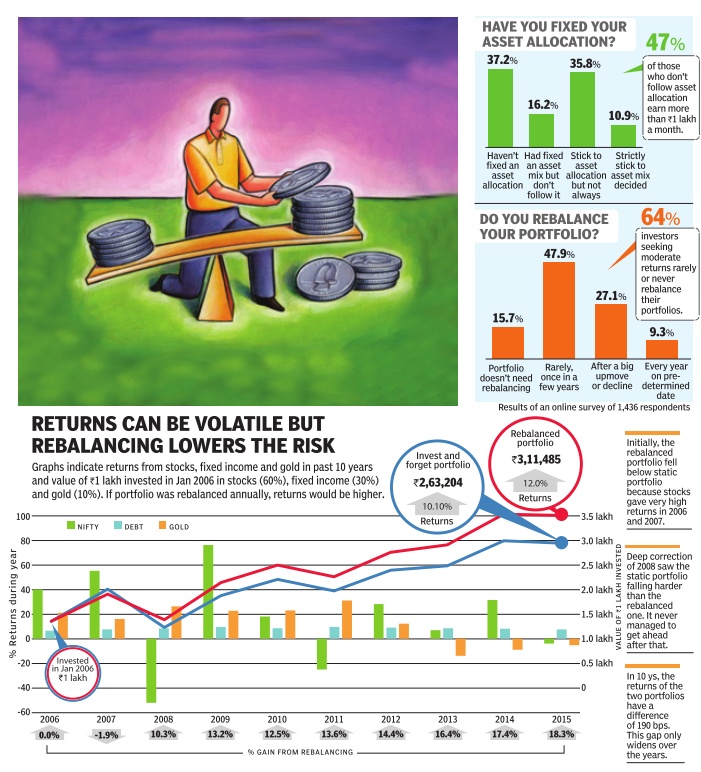
See graphic:
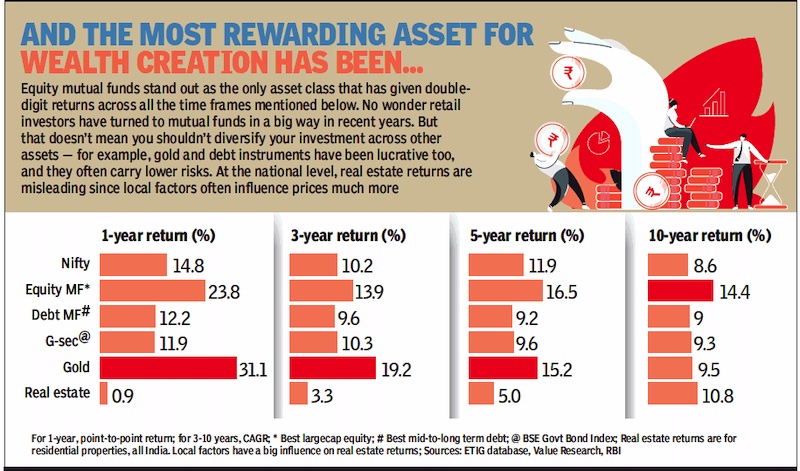
Returns from stocks, gold and fixed income in India, 2006-15
2007-2017
Safe investments vs. riskier ones
See graphic:
Returns on equity funds, gilt funds, gold ETFs and liquid funds, 2007-2017
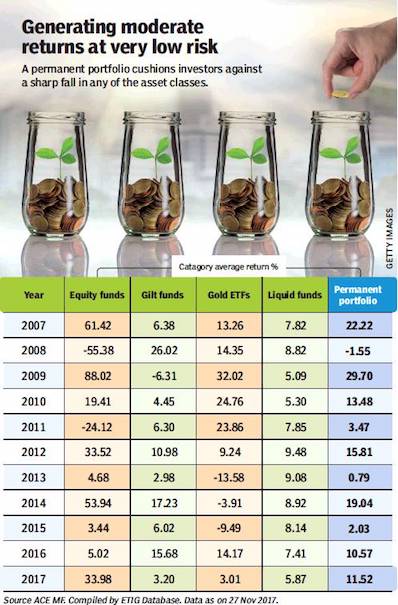
From: NARENDRA NATHAN, December 18, 2017: The Times of India
Saving habits
2011-16: Indians invest more in equity, debt
Allirajan M, Indians invest more in equity, debt, Sep 29 2016 : The Times of India
Indian households are increasingly putting more money in equities and debentures. Investments by households in shares and debentures jumped 72.2% year-on-year (yo-y) or by `38,491crore to `91,763 crore in 2015-16, Reserve Bank of India (RBI) data showed.
In contrast, their investments in bank deposits advanced by a mere 3.8% y-o-y or by `22,594 crore to around `6.16 lakh crore.
Household investments in shares and debentures have surged more than five times between 2012-13 and 2015-16. But their savings in bank deposits have moved up by a measly 7.1% during the timeframe, RBI data showed. Incidentally, households held a record `6.48 lakh crore in bank deposits in 2013-14. Household investments in life insurance products, another favourite, increased 9.8% y-o-y to around `2.72 lakh crore.
The interest in equities and debentures has been growing at a robust pace over the last three years. The steady decline in interest offered by banks for deposits following a series of rate cuts by the RBI has acted as a dampener for those looking to invest in traditional instruments such as FDs. Though there have been corrections, equity markets have risen steadily in last three years with benchmark indices hitting new highs.
2011-18
August 31, 2018: The Times of India

From: August 31, 2018: The Times of India
Indian families held a record share of their income in the form of cash in 2017-18. Preference for cash is usually a sign of risk aversion. But in the same year, share of savings in stocks grew over 4 times, reflecting higher risk acceptance. Since Indians are also investing more in pensions and keeping much less of their incomes in deposits than before it’s safe to assume that spike in cash is a temporary effect of the cash drought caused by demonetisation in 2016-17. Overall, Indians are saving more, and better, than before
2013-15: Saving habits
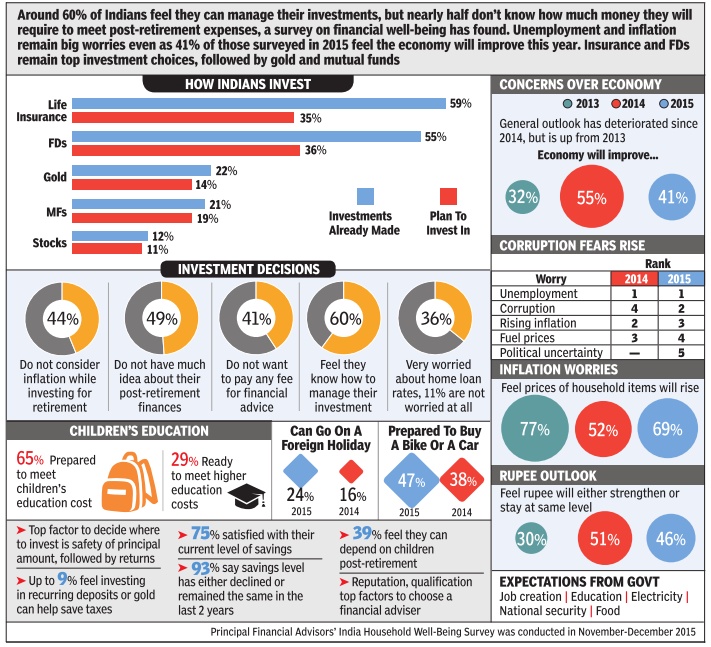
See graphic:
Some facts about investment patterns in India
2014-18, state-wise
September 4, 2018: The Times of India

From: September 4, 2018: The Times of India
See graphic:
The saving habits of Indians, 2014-18, state-wise
Investors in Gujarat are biggest risk-takers with 42% of their mutual fund money going into equities. Investors in Bengal, with 38% of their money in equities, are not far behind and do better than Delhi (36%), Karnataka (36%) & Maharashtra (32%)
2017: even the poor and young want real estate, gold
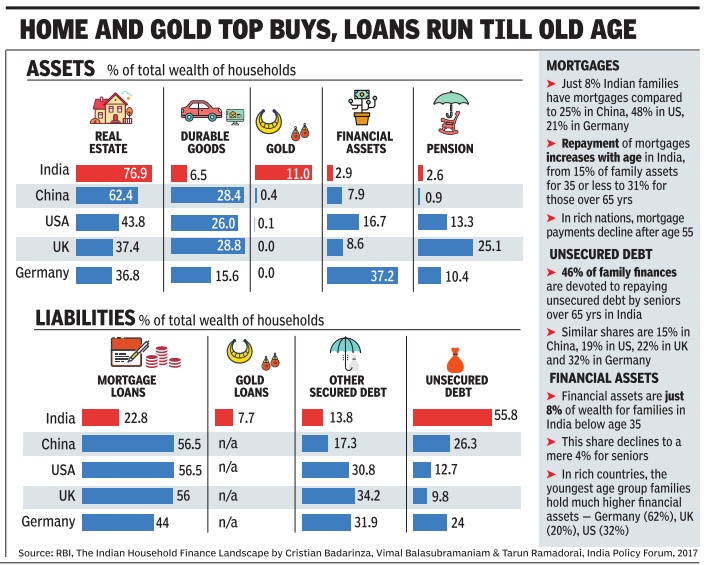
Indian families borrow and invest in very different ways than families in the US, UK or Germany , and even those in China. The depth of these differences, across all ages and economic levels, is revealed in a recent report on household finances prepared by the RBI.
It shows that a major proportion of household wealth in Indian families is kept as real estate or gold, even among younger families, and even by the poorest 40% of population.
This is not the case in other countries. Institutional borrowings by Indian families are low in early life and go on increasing leaving many retired persons with a debt overhang, unlike advanced countries where mortgages reduce after retirement.And, pensions are virtually absent in India while in most Western countries they are a major asset in old age.
More than three quarters of family wealth is invested in real estate (land and dwelling units) by an average Indian family compared to just 44% in the US, and 37% in UK and Germany . In China, about 62% of wealth goes into real estate. Even among the poorest 20% of the population, 59% have some land or dwelling unit in India, while in China, the similar proportion is 61%.
But in the rich countries a minuscule share of the poorest quintile has real estate -4% in US, and less than 1% in UK and Germany .
This may sound bizarre considering India's poverty but here is the thing: average value of the main residence in the poorest Indian households is Rs 22,000, while it is Rs 15 lakh in Germany and Rs 3.7 lakh in the US.
The RBI report is talking of proportion of different types of family wealth. Their absolute values are obviously very different.
Besides real estate, the other main target of investment in India is gold. About 11% of family wealth goes into buying gold. Families in other countries spend virtually nothing on this, with the Chinese spending a mere 0.4% of their wealth on gold. Indian families also have gold loans amounting to about 8% of their total liabilities, again a feature not found anywhere else.
“Most households use debt to cope with emergency expenses, such as hospitalisation, or property damage due to a natural disaster. The interest rates on unsecured debt are very high. Therefore, households prefer to put their savings in real estate and gold, which can also be used as collateral,“ RBI's Household Finance Committee chairman Tarun Ramadorai of Imperial College, London, told TOI. Detailed data on countries drawn from various surveys is available in a paper by Ramadorai and coauthors published in 2017.
Although 73% of families in India have financial assets like cash, bank accounts and pension accounts, they hold very small amounts adding up to just 5% of their total wealth, he added.
Medical emergencies, especially among the elderly , are one of the main reasons why families in India seek loans at usurious rates from money lenders. Such unsecured loans make up nearly 56% of all liabilities for Indian families, much higher than China at 26%, US (13%) and Germany (24%). The RBI report notes that “some of these risks could be mitigated through strengthening the public provision of health and social welfare services.“
Indian families are also exceptional in that housing loans are low in early life and rise beyond retirement ages.In other countries such loans rise in middle age but fall off at retirement. This happens because Indian families borrow later in life and it is customary to bequeath property to future generations who in turn look after the elderly.
These traditional structures are increasingly under pressure from shifting demographic patterns, social norms, and changing economic conditions, introducing risks to economic well-being especially as households age, the report says.
Small savings
Small savings rates
April 2015- August 2016
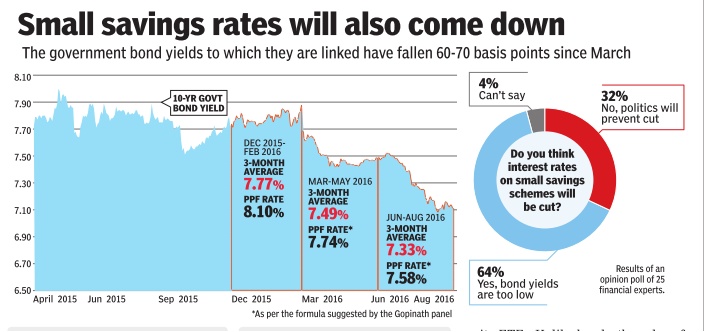
See graphic, 'Small savings rates, April 2015- August 2016'
Gold Bonds
2019: benefits of different types of bonds
July 2, 2019: The Times of India

From: July 2, 2019: The Times of India
You can now hold gold in either its physical form or on paper — through gold bonds or through mutual funds that trade in gold. What should you do? The answer depends on what you are looking for. If you want liquidity, and are planning to take a loan against your stock of gold, then physical gold is your best bet. But, remember, you will need to pay a capital gains tax when you sell physical gold. But if you are looking at gold as a long-term investment, then a gold bond is what you might want to go for. Not only are you spared capital gains tax when you redeem these, you also earn a small interest. A look at the different options that are now available
Systematic investment plans
2016>18: a 53% increase in inflows
Allirajan M, MF SIP kitty crosses $10bn mark in FY18, April 18, 2018: The Times of India

From: Allirajan M, MF SIP kitty crosses $10bn mark in FY18, April 18, 2018: The Times of India
Sees 53% Jump From FY17, Mobilises Record $1Bn In Mar
There is no stopping the mutual fund SIP juggernaut. Investors have committed about $10.3 billion (Rs 67,190 crore) through SIPs (systematic investment plans), the bedrock of inflows into equity MFs, in 2017-18, a massive 53% increase over the previous financial year. This is the highest ever mobilisation in a financial year.
Inflows into SIPs stood at around $1.1 billion (Rs 7,119 crore) in March alone, the highest ever for a month. MF SIP accounts stood at 2.11 crore at the end of March, data with the Association of Mutual Funds in India (AMFI) showed. Incidentally, the total number of SIP accounts crossed the 1 crore mark only in August 2016.
SIP is an investment option offered by fund houses where one could invest a fixed amount in an MF scheme periodically at fixed intervals—say once a month instead of making a lump-sum investment. The SIP instalment amount could be as small as Rs 500 per month. SIP is similar to a recurring deposit where you deposit a small /fixed amount every month.
The MF industry added 9.70 lakh SIP accounts on average each month during 2017-18 against an average of 6.27 lakh SIP accounts added each month during 2016-17. AMFI data showed. The average SIP size was about Rs 3375 per SIP account.
SIPs are done almost entirely in equity schemes. The fixed income segment contributes only about 5% in volume terms and about 2% in value terms to overall SIPs. SIP is a convenient method of investing through standing instructions to debit the investor’s bank account every month, without the hassle of having to write out cheques.
“SIPs account for 50% of new MF accounts. They have become a brand of their own,” says Raghav Iyengar, executive vice president, ICICI Prudential MF. “SIPs have been getting traction as investors are not trying to time the market,” says Srikanth Meenakshi, co-founder and COO, Fundsindia.com, an investment platform for MFs.
“The fast pace of growth (in SIPs) is due to the network effect. People are buying MFs through SIPs as most others are doing so,” he explains. “This is the one of the easiest ways to start a new investment,” Raghav says.
Upgrades, downgrades
2016> 2018
Nearly ₹3L-cr bonds downgraded in FY18, April 3, 2018: The Times of India
From: Nearly ₹3L-cr bonds downgraded in FY18, April 3, 2018: The Times of India
Default Rate May Go Up In Current Financial Year On Higher Interest Cost, Says ICRA
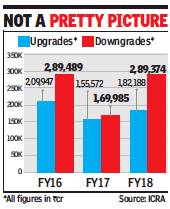
The quality of Indian debt soured considerably in FY18 with Rs 3 lakh crore worth of bonds being downgraded compared to Rs 1.7 lakh crore in FY17. Over half the downgrades were of papers issued by lenders, of which 70% pertained to bonds issued by public sector banks (PSBs).
Going by the number of entities upgraded versus the number of downgrades, FY18 presents a positive image with 646 upgrades by rating agency ICRA versus 418 downgrades. But the volume reveals the overall quality of total outstanding debt in the country.
As against the Rs 3 lakh crore of downgrades, the volume of debt upgraded in FY18 was only Rs 1.8 lakh crore — up 17% from Rs 1.5 lakh crore in the previous year. The largest proportion of debt rated by ICRA (65%) continues to remain concentrated in the sub-investment grade category. A bulk of the ratings have an ‘ICRA B’ rating, while the median rating category is ‘ICRA BB’. Fund managers consider BBB and above as an investment-grade rating, while those with lower ratings are considered speculative.
PSBs, which were hit by bad debt provisions as the RBI tightened income-recognition norms, accounted for a third of downgrade volumes. According to ICRA, the overall quality of Indian debt could worsen in FY19. ICRA head of credit policy Jitin Makkar said in a webinar, “The default rate could go up in fiscal year 2019 on higher interest cost, deteriorating business conditions and likely difficulty in getting bank funding, given the challenges in the banking system.” ICRA said, looking ahead, credit quality pressures will “take longer to dissipate” as hardening interest rates and banking sector woes will create hindrances for businesses.
According to ICRA, telecom, chemicals and healthcare saw weakening performance along with greater number of downgrades than upgrades.
