Household expenditures: India
This is a collection of newspaper articles selected for the excellence of their content. |
Contents |
Poor in villages live on Rs 17 a day, in towns on Rs 23 a day: 2012
Mahendra Singh, TNN | Jun 21, 2013
Poor in villages live on Rs 17 a day, in towns on Rs 23 a day: Survey
The average monthly spending on all-India basis was around Rs 1,430 for rural India and around Rs 2,630 for urban India, a government survey has revealed. NEW DELHI: The poor in rural areas spend only Rs 17 per day while those living in cities and towns spend Rs 23 a day, a government survey has revealed.
Top and bottom 5%
The bottom 5% of the population had an average monthly per capita expenditure of Rs 521.44 in rural areas and Rs 700.50 in urban areas, according to National Sample Survey (NSS) data for 2011-12 (July-June).
The top 5% of the population had an average monthly spending of Rs 4,481 per month in rural areas and Rs 10,282 in urban areas.
While there is no upper limit for spending for the top 5% segment, the maximum spending by those falling at the bottom of the ladder is Rs 616 a month (Rs 20.5 a day) in rural areas and Rs 827 (Rs 27.5) in urban areas.
The average monthly spending on all-India basis was around Rs 1,430 for rural India and around Rs 2,630 for urban India. This means those living in cities are spending about 84% higher than their rural counterparts.
Food
In cities and towns, food accounted for 42.6% of the value of household consumption which included 9% on beverages, refreshments and processed food, 7% on milk and milk products, and 6.7% on cereals and cereal substitutes. Education accounted for 6.9%, fuel and light 6.7%, conveyance 6.5%, and clothing and footwear 6.4%.
In rural India, food accounted for 52.9% of the value of consumption that included 10.8% on cereals and cereal substitutes, 8% on milk and milk products, 7.9% on beverages, refreshments and processed food, and 6.6% on vegetables.
Non-food items
Among non-food items, fuel and light for household purposes (excluding transportation) accounted for 8%, clothing and footwear for 7%, medical expenses for 6.7%, education for 3.5%, conveyance for 4.2%, other consumer services (excluding conveyance) for 4% and consumer durables for 4.5%.
Even in rural areas, spending on cereals has seen a declining trend as it came down from 18% in 2004-05 to 12% in 2011-12. In urban India, it came down from 10.1% in 2004-05 to 7.3% in 2011-12.
Apart from beverages, none of the food items such as grams, pulses, milk, fish, vegetables showed any noticeable increase in share in both rural and urban India. The spending on pan, tobacco and intoxicants fell noticeably over the years since 1993-94 though the decline appears to be flattening out.
The spending on "miscellaneous goods and services" category (including education, medical care and entertainment) has grown significantly — from 23.4% in 2004-05 to 26% in 2011-12 in rural areas and from 37.2% in 2004-05 to nearly 40% in urban areas.
As far as states are concerned, consumption expenditure in villages of Odisha and Jharkhand were the lowest, followed by Bihar, Madhya Pradesh and UP. In urban areas, Bihar had the lowest expenditure followed by Chhattisgarh, Odisha, Jharkhand and UP.
Income disparity: India
Income disparity between rich & poor growing rapidly
In ’12 Urban Rich Earned 15 Times More Than Poor
Subodh Varma TIG
The Times of India 2013/07/28
Everybody knows that there is a chasm between the rich and the poor. But can it be measured? And, more importantly, is this disparity growing or coming down?
Consumption expenditure between 2000 and 2012: India
New data based on consumption expenditure surveys shows that income disparity is growing and at a rapid clip. Spending and consumption by the richest 5% zoomed up by over 60% between 2000 and 2012 in rural areas while the poorest 5% saw an increase of just 30%. In urban areas, the richest segment’s spending increased by 63% while the poorest saw an increase of 33%. The effect of inflation was removed while making these comparisons.
Here’s another way you can look at these disturbing results: in 2000, the average spend (or income) of the richest group in urban areas was 12 times that of the poorest group; in 2012, it had increased to 15-fold. In rural areas, the disparity between the haves and the have-nots increased from 7 times to 9 times in these 12 years.
These stark findings emerge from a comparison of data on household spending patterns for 1999-2000 and 2011-12. These are collected by the National Sample Survey Organisation. Consumption spending — that is, all possible expenditure done by an individual in a household on all aspects of life — is the closest measure of incomes available in the country.
Clearly, economic policy that resulted in high GDP growth for most of this period has not trickled down to the neediest. Rather, it appears to be benefitting the already affluent sections more. ===Growth highest for richest 10%, lowest for poorest 10% ===
Many experts argue that spending and hence income of the uppermost 5% is not completely reflected in NSSO surveys because those who do their surveys hardly manage to meet and fill out questionnaires of the super-rich households. In other words, the incomes of the super-rich are probably more than what is reflected in this data.
The richest 10% of Indian society have seen highest growth while the poorest 10% have seen the slowest increase in incomes. The remaining 80% of the people have seen roughly the same levels of growth ranging between 35% and 40% in rural areas and between 40% and 50% in urban areas over 12 years. That means that for 90% of people, annual growth in income was just over 3% in rural India, and just over 4% in urban India.
In 2012, a person of the poorest segment in rural areas was spending just Rs 521 per month. So, a family of four would spend about Rs 2,084 per month. In the richest segment, a person spent Rs 4,481 per month which would translate into a monthly spend (or income) of Rs 17,925 for a family of four. In urban areas, monthly spending by the poorest segment was Rs 700 per person or Rs 2,802 for a family of four and for the richest group it was Rs 10,282 per person or Rs 41,128 for a four-member family.
Expenditure per person on food
Details of spending on different items provided by the report show that in urban areas, monthly expenditure per person on food was less than Rs 1,000 for 50% of the population while in the richest segment every person on an average spent Rs 2,859.
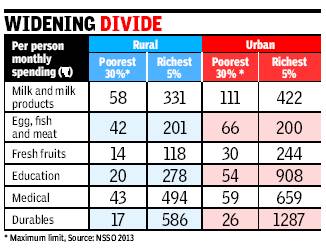
Some of the food items showing vast disparity between rich and poor included vegetables, fruits, eggs, fish and meat, and milk products.
The data blows the myth that poorer sections are consuming more of fruits, eggs, etc.
A similar multi-fold difference is seen in other key items of expenditure like education, medical and durable goods.
Community-wise disparities
Muslims have lowest living standard in India: Govt survey
PTI | Aug 20, 2013
Muslims were at the bottom in rural areas, with an average monthly per capita expenditure of Rs 833, followed by Hindus at Rs 888, Christians at Rs 1,296 and Sikhs 1,498. NEW DELHI: Among various religious groups, Muslims have the lowest living standard with the average per capita expenditure of just Rs 32.66 in a day, says a government survey.
At the other end of the spectrum, Sikh community enjoys a much better lifestyle as the average per capita spending among them is Rs 55.30 per day, while the same for Hindus is Rs 37.50. For Christians it is Rs 51.43.
"At all-India level, the average monthly per capita expenditure (MPCE) of a Sikh household was Rs 1,659 while that for a Muslim household was Rs 980 in 2009-10," said an NSSO study titled 'Employment and Unemployment Situation Among Major Religious Groups in India'.
The average household MPCE is a proxy for income and reflects that living standards of a family.
According to the study, the average MPCE for Hindus and Christians were Rs 1,125 and Rs 1,543, respectively.
The survey said that average monthly per capita consumption at all-India level was Rs 901 in villages and Rs 1,773 in cities. Overall, the average MPCE was Rs 1,128.
Muslims were at the bottom in rural areas, with an average MPCE of Rs 833, followed by Hindus at Rs 888, Christians at Rs 1,296 and Sikhs 1,498.
In urban areas, Muslims' average MPCE was also the lowest at Rs 1,272 followed by Hindus at Rs 1,797, Christians Rs 2,053 and Sikhs at Rs 2,180.
Rural and urban spending
Gujarat slides in both rural & urban spending
Data Raises Doubt Over Devpt Model
Subodh Varma TIMES INSIGHT GROUP
The Times of India 2013/07/22
How are people in their states actually faring? How does one know whether one ‘development model’ is better than another?
One way is to look at how much a person spends on an average every month; this gives an indication of how much people are earning. Comparing recently released data on consumer expenditure with data from a decade ago provides a fair idea of which state governments are delivering and which are sliding. There’s a surprise lurking there.
Gujarat slides down
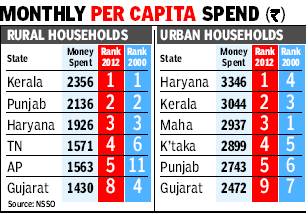
Gujarat has slid from fourth to eighth in the ranking of states for rural spends, and from seventh to ninth in urban expenditure, according to a comparative analysis of data on monthly per capita spending between 2011-12 and 1999-2000, both of which are put out by the National Sample Survey Organisation.
Amartya Sen backs Bihar’s growth model
Nobel laureate Amartya Sen on Sunday backed Bihar’s growth strategy arguing that growth was not independent of social transformation.
“What is needed is an integrated approach for development and growth,” Sen said at a book release event. The noted economist suggested that without education and proper health facilities, it was difficult to achieve balanced growth. “Educated labour force is the biggest guarantor. Education and healthy labour force is able to produce everything from IT to auto parts,” Sen said.
At the same time, he recognized the impressive growth rate, of over 11%, recorded by the eastern state during the 11th five-year plan (2007-2012) and said it was an important indicator.
Sen’s praise for the Bihar model is significant because the build-up to the general elections has also been framed as a duel between competing models of growth. One is the inclusive growth model which UPA and Bihar claim to represent, which won praise from Sen. The other, Gujarat’s emphasis on higher rate as the solution to poverty reduction, is backed by the likes of Jagdish Bhagwati and Arvind Panagariya.
While the state ranks poorly on most human development indicators, its performance has improved in recent years, which economists say is driven by better administration and steps to improve literacy and health facilities. Bihar is demanding special state status — to access more central funds and offer tax incentives to attract investment to bolster its growth and development. Chief minister Nitish Kumar has been at the forefront of the demand and even organized a rally in the national capital to press for the tag.
Renowned economist Nicholas Stern, who has co-edited the book with Rajya Sabha member N K Singh, pushed for a special status tag. “From the point of view of poverty, distribution of income and point of view of demonstrating change, a special category status would be appropriate,” he said.
Andhra, TN climb on progress graph
Gujarat may be the poster boy of development and economic growth, but is one of the few states that have slid in economic rankings. Consumption expenditure of people in Gujarat is growing at a slower rate than the national average, according to a comparative analysis of data on monthly per capita spending between 2011-12 and 1999-2000, both of which are put out by the National Sample Survey Organisation (NSSO)
Andhra, The best-performing state
The best-performing state is Andhra, which has dramatically improved from 11th place in 2000 to fifth in 2012 in rural households and from 11th to sixth in urban households.
Another state that has shown major movement in rankings is Tamil Nadu, moving down from second to seventh place in urban per capita expenditure but improving from sixth to fourth in rural.
Kerala, Punjab, Haryana, TN and AP are the top five states in rural households; Haryana, Kerala, Maharashtra, Karnataka and Punjab are the top five in urban households.
Growth rates of household expenditures
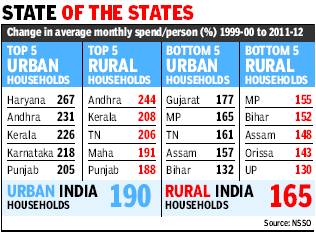
The same reality is reflected in growth rates of household expenditures over the period. At the national level, average per person spends grew by 165% in rural areas and 190% in urban areas between 2000 and 2012. Among the states with MPCE growth of urban households lower than the national average, Gujarat (177%) lies tied with Rajasthan, lower than Uttar Pradesh and West Bengal but higher than Assam and TN.
Among rural households, per capita spend in Gujarat grew by 165%, again below the national average of 170%. Most of the poorer states like UP, Bihar, MP and Odisha were also below the national benchmark. In Haryana too rural incomes are barely above the national average.
At the other end, the states with high expenditure growth were AP, Kerala, Punjab, Maharashtra in both rural and urban areas, with TN only joining the leaders for ruralhouseholds.


