Karnataka: Assembly elections
This is a collection of articles archived for the excellence of their content. |
Contents |
Constituencies consistently dominated by certain parties
2008-18: seats where victor polled more than 50% of the votes
Harikishan Sharma, April 3, 2023: The Indian Express
As many as 92 of the 224 members of the Karnataka Assembly got more than 50 per cent of the total votes polled in their constituencies in the 2018 elections, up from 65 in 2013 and 50 in 2008.
An analysis of the results of these three elections shows that it’s not the big two, the BJP and Congress, who have had complete and consistent dominance in their constituencies. It’s the third wheel of the Karnataka elections, the Janata Dal (Secular), that has done so, indicating its command over its strongholds. It is also the only one of the three parties with consistent rise in the number of seats where it won with more than 50 per cent of the votes.
Of the 92 candidates who won with more than half the total votes polled in 2018, 48 were from the BJP, 27 from the Congress, and 17 were JD(S) leaders.
2008; Total tally: BJP 110 seats, Cong 80, JD(S) 28
Of the 50 candidates elected with more than 50 per cent of the votes in their constituencies in the 2008 elections, 30 were from the BJP (of its total of 110), 13 from the Congress (of its total 80), six from the JD(S) (which won 28 seats in all) and one Independent.
These 50 constituencies were spread over 23 districts, with the district of BBMP (Bruhat Bengaluru Mahanagara Palike) accounting for most such constituencies (11) followed by three each in Mysuru and Udupi.
The emphatic victories of the JD(S) came in the districts of Ramnagar, Hassan, Mysuru and Belagavi. The BJP’s 30 were spread over 18 districts, while the Congress’s 13 came from 7 districts.
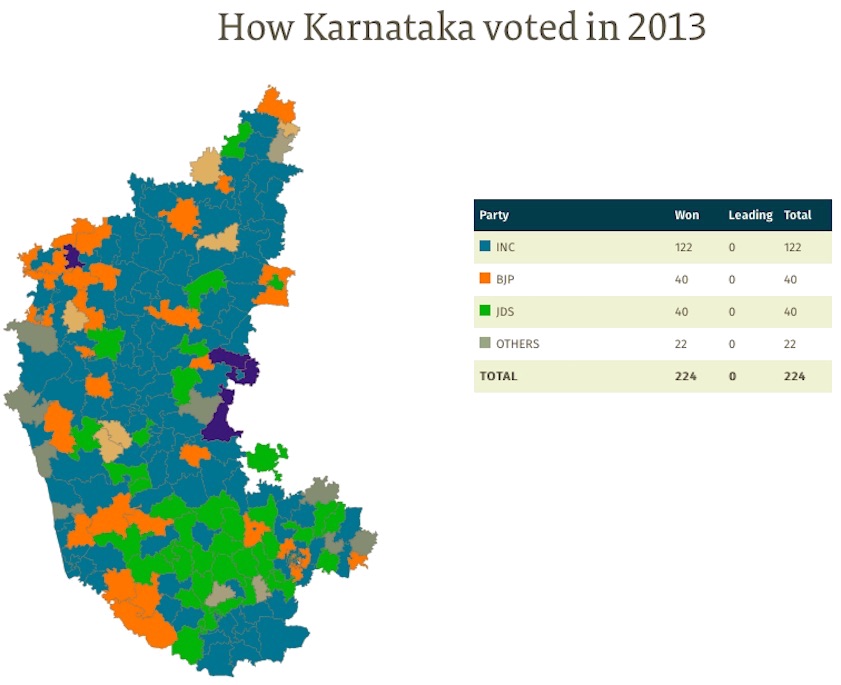
2013; Total tally: BJP 40 seats, Cong 122, JD(S) 40
Five years later, when 65 seats saw winners who had got over 50 per cent of the votes, these were again spread over 23 districts. Of these 65 seats, 40 were won by the Congress, nine by the JD(S), eight by the BJP, four by Independents, three by the Badavara Shramikara Raitara Congress (a party founded by BJP rebel B Sriramulu), and one by the Karnataka Janata Paksha (KJP).
However, only 21 of these 65 seats were among the 50 that had seen a similar emphatic result in 2008. Besides, in 21 of those 50 seats, the incumbents lost in 2013 despite their impressive wins in 2008.
The BJP, which had won 30 of these 50 constituencies in 2008, could retain only 12 of them, and the Congress 11 of its 13. The JD(S) though retained all but 1 of its 6 seats with similar big wins, apart from increasing its tally of such seats.
The JD(S) big victories again came from a small set of districts as in 2008 — BBMP, Hassan, Kolar, Mysore, Raichur and Ramanagar.
2018; Total tally: BJP 104 seats, Cong 78, JD(S) 37
While the 2018 results would lead to constant horsetrading and eventual change of government within a year, the Assembly elections saw as many as 92 winners with over 50 per cent of the votes.
Of these 92 seats, the BJP won 48, the Congress 27 and the JD(S) 17. The results hence showed a massive rise in sweeps by the BJP and JD(S) in seats, and a steep fall in similar performance by the Congress.
Only 35 of the 65 candidates who had won in 2013 by more than half the votes polled in their constituencies, won in 2018. Of these 35, 22 belonged to the Congress, followed by 6 each of the BJP and JD(S), and 1 Independent.
This means the JD(S) again managed to retain most of the seats it had won in the 2013 elections with equally big margins.
The JD(S) sweeps came across eight districts this time — Bangalore Rural, BBMP, Gulbarga, Hassan, Mandya, Mysore, Ramnagar, and Tumkur districts.
Election-wise results
1957-2018: The two top parties
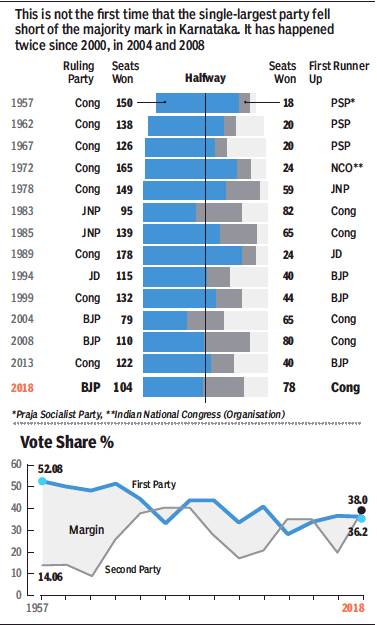
From: May 16, 2018: The Times of India
See graphic:
The two parties that won the highest number of seats in the Karnataka Assembly elections, 1957-2018
1978
The political map
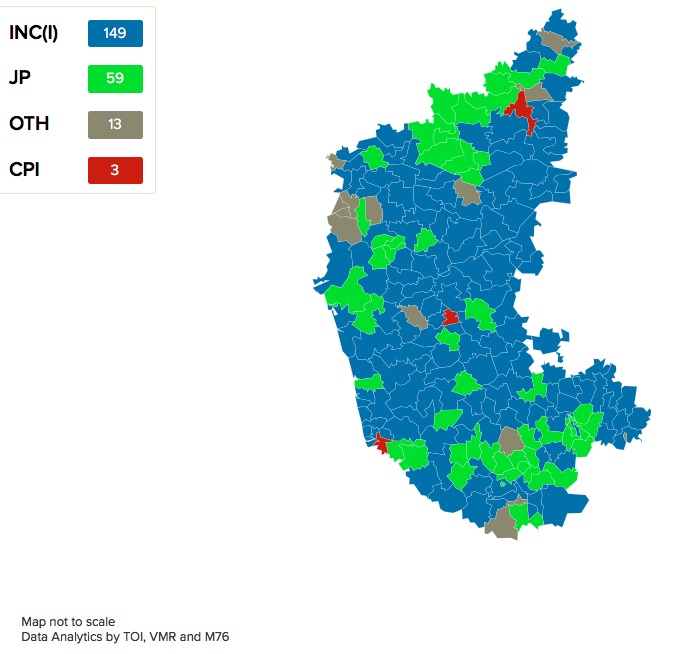
From: May 12, 2018: The Times of India
See graphic:
The constituency-wise position of the main political parties in the elections to the Karnataka Legislative Assembly in [1978]
1983
The political map

From: May 12, 2018: The Times of India
See graphic:
The constituency-wise position of the main political parties in the elections to the Karnataka Legislative Assembly in (1983)
1985
The political map
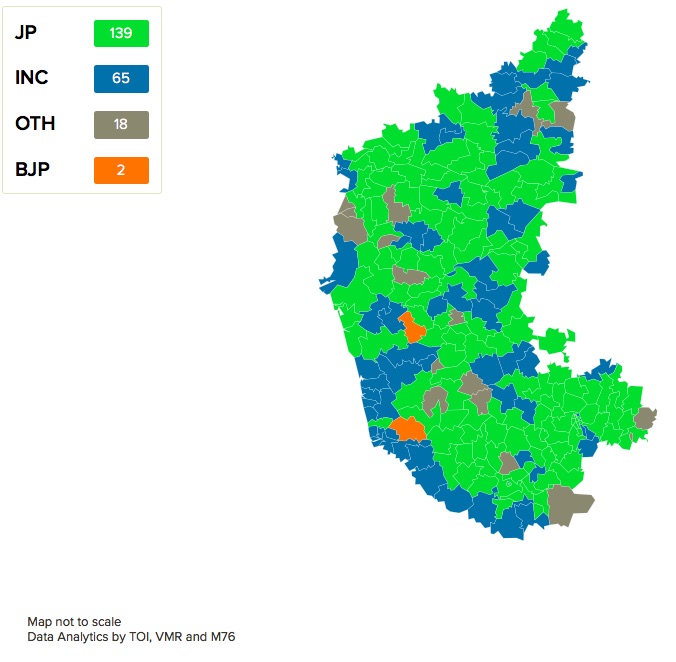
From: May 12, 2018: The Times of India
See graphic:
The constituency-wise position of the main political parties in the elections to the Karnataka Legislative Assembly in 1985
1989
The political map

From: May 12, 2018: The Times of India
See graphic:
The constituency-wise position of the main political parties in the elections to the Karnataka Legislative Assembly in 1989
1994
The political map
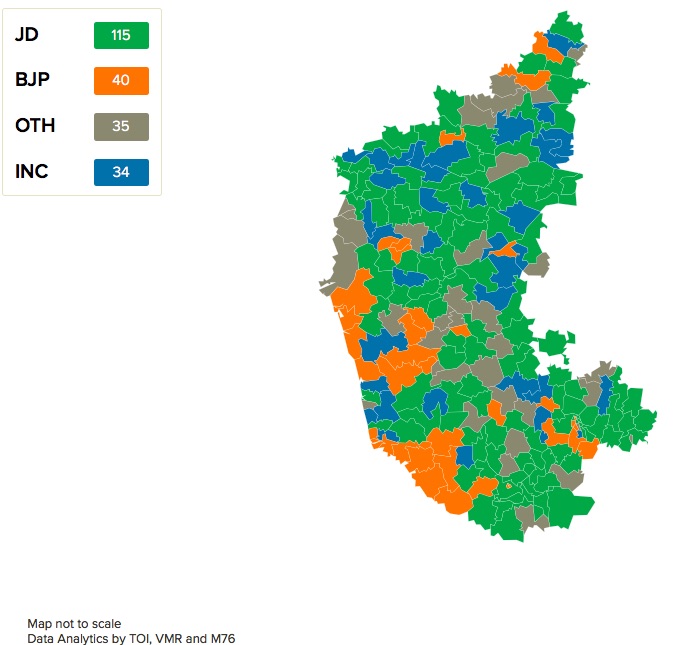
From: May 12, 2018: The Times of India
See graphic:
The constituency-wise position of the main political parties in the elections to the Karnataka Legislative Assembly in 1994
1994
The political map
From: May 12, 2018: The Times of India
See graphic:
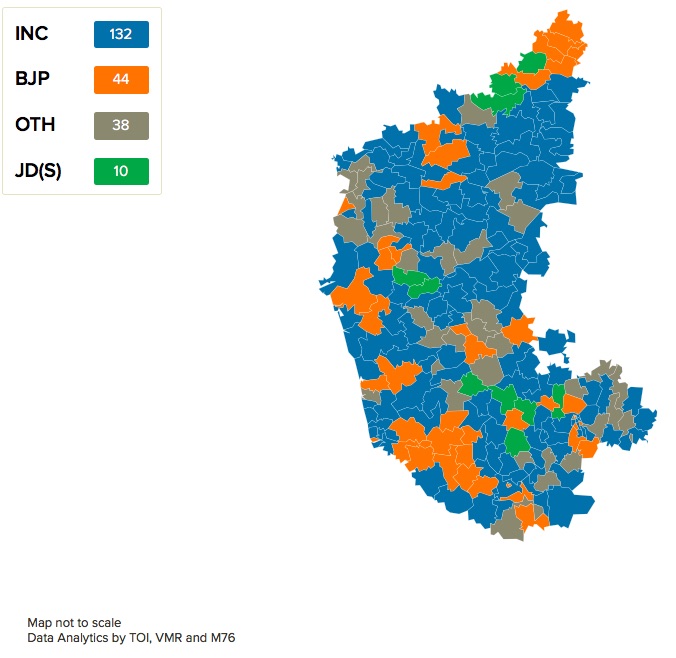
The constituency-wise position of the main political parties in the elections to the Karnataka Legislative Assembly in 1999
2004
The political map
From: May 12, 2018: The Times of India
See graphic:
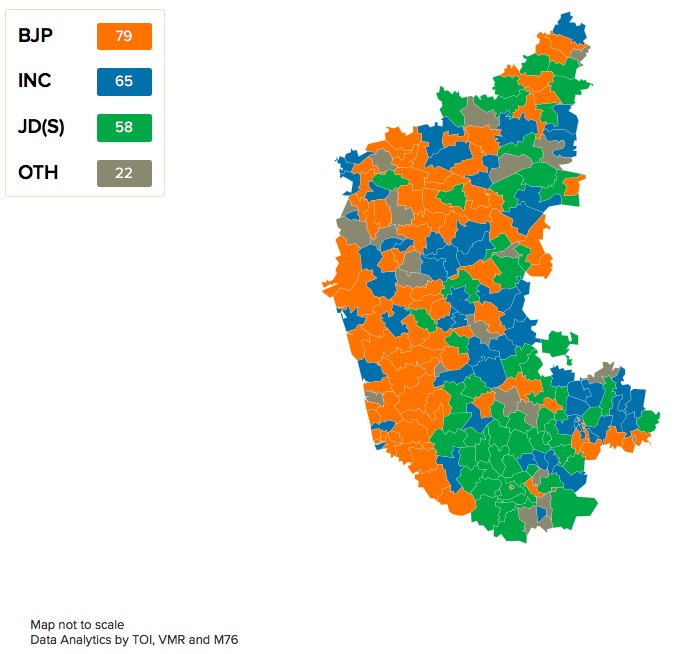
The constituency-wise position of the main political parties in the elections to the Karnataka Legislative Assembly in 2004
2008
The political map, community-wise
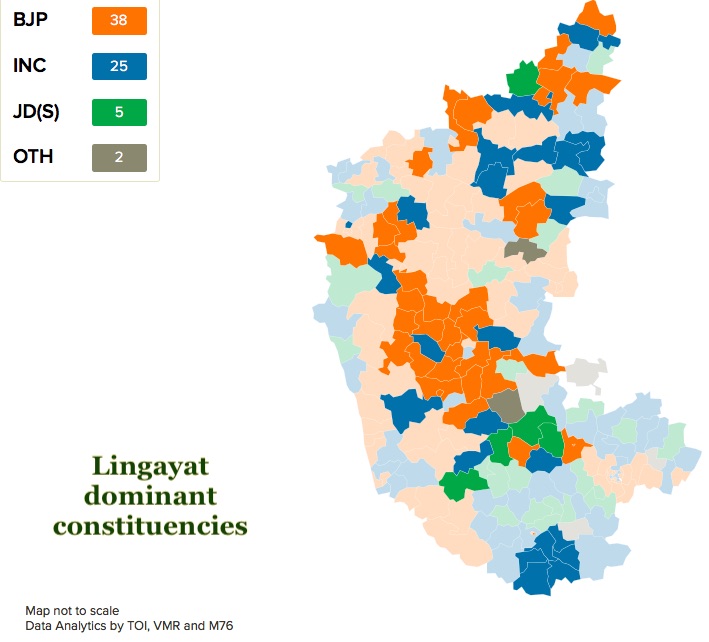
Lingayat dominant constituencies
From: May 12, 2018: The Times of India
See graphic:
The constituency-wise position of the main political parties in the elections to the Karnataka Legislative Assembly in 2008- Lingayat dominant constituencies
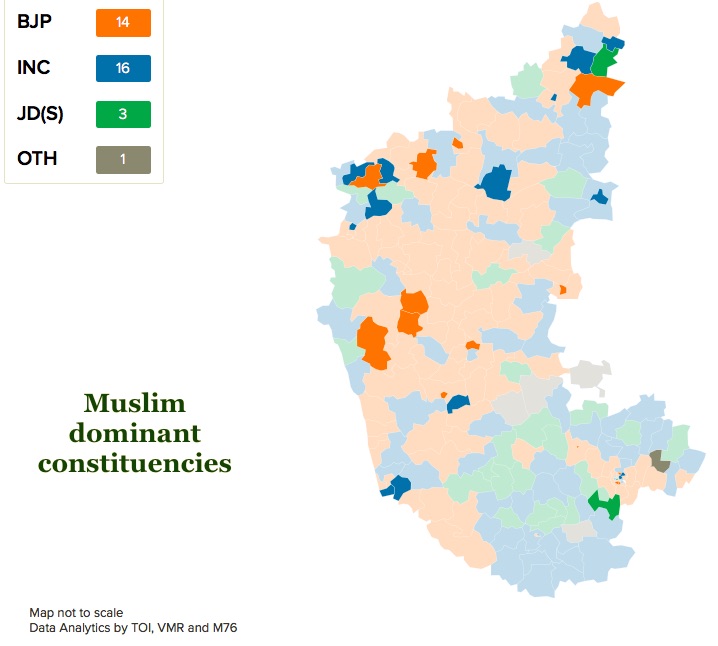
Muslim dominant constituencies
From: May 12, 2018: The Times of India
See graphic:
The constituency-wise position of the main political parties in the elections to the Karnataka Legislative Assembly in 2008- Muslim dominant constituencies
Vokkaliga dominant constituencies
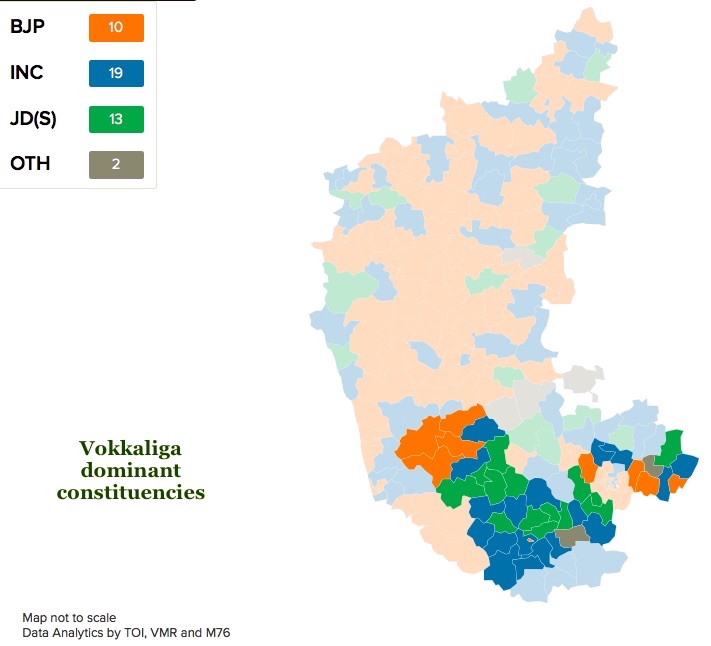
From: May 12, 2018: The Times of India
See graphic :
The constituency-wise position of the main political parties in the elections to the Karnataka Legislative Assembly in 2008- Vokkaliga dominant constituencies
SC dominant constituencies
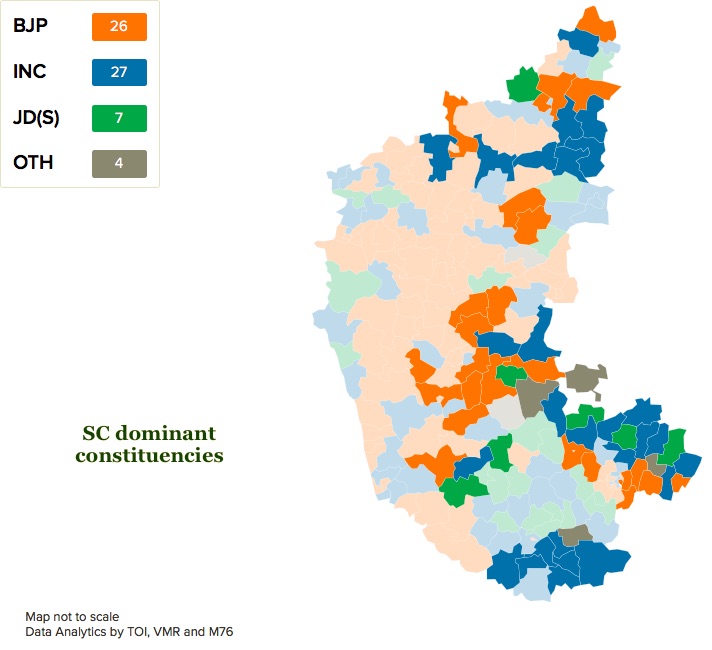
From: May 12, 2018: The Times of India
See graphic:
The constituency-wise position of the main political parties in the elections to the Karnataka Legislative Assembly in 2008- SC dominant constituencies
ST dominant constituencies
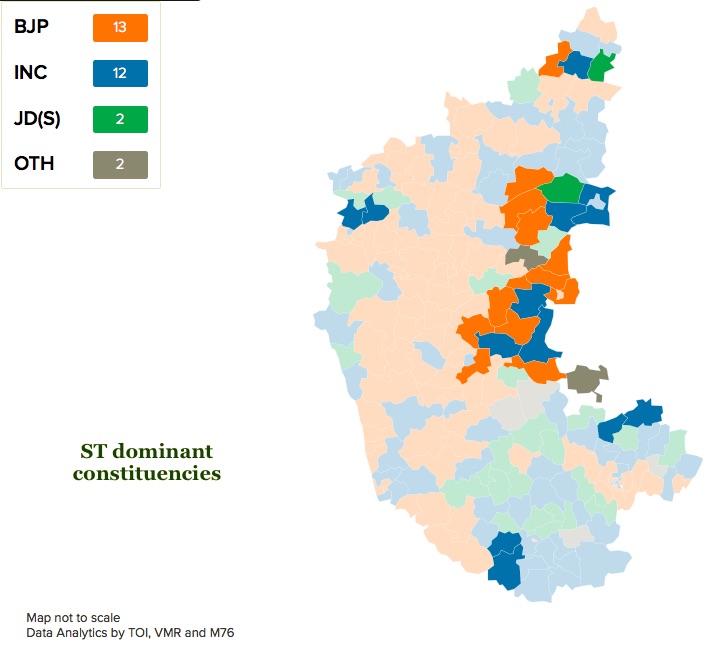
From: May 12, 2018: The Times of India
See graphic:
The constituency-wise position of the main political parties in the elections to the Karnataka Legislative Assembly in 2008- ST dominant constituencies
2013
The position of the main parties
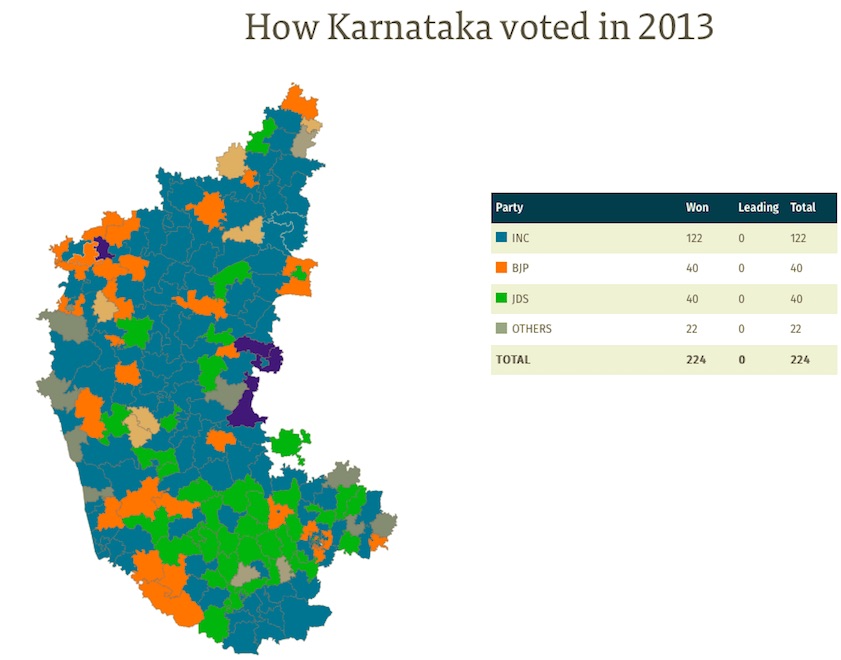
From: May 16, 2018: The Hindu
See graphic:
How Karnataka voted in 2013-party-wise
From: May 16, 2018: The Hindu
2018
Please see:
Karnataka: Assembly elections, 2018
See also
Karnataka: Assembly elections
Karnataka: Assembly elections, 2018
Karnataka: caste, mutts and elections