Greenhouse gases: India
This is a collection of articles archived for the excellence of their content. |
Contents |
Theextent of the problem
Andhra Pradesh: GHG double between 2005-14
According to an internal assessment by the Andhra Pradesh government, there has been a sharp rise in the greenhouse gas emissions (GHG) from 54 million tonnes of CO2 equivalent in 2005-06 to 103 million tonnes of CO2 equivalent in 2013-14. This is a compound annual growth (CAGR) of 8.4%. Per capita GHG emission increased from 1.16 tonnes in 2005-06 to 2.06 tonnes in 2013-14 in AP.
However, the per capita GHG emissions at all-India level were 1.35 tonnes in 2005 and 1.58 tonnes in 2010. According to the report, agriculture and industry are the major contributors for the GHG. Another major reason is the loss of green cover. Forests have declined from 25% to 13%. An adequate green cover could have helped reduced GHG emissions.
Combining all the components of the energy sector, the total GHG emissions from the energy sector (in CO2 Eq) increased from 43,178 2005-06 to 81,526 2013-14 at a CAGR of 8.27 %. According to documents with TOI, the agriculture sector emitted 17.5 million tonnes of CO2 equivalent, of which 13.2 million tonnes is methane and 4.3 million tonnes nitrous oxide. Enteric fermentation constituted 47% of the total CO2 equivalent emissions. Around 24% of the emissions came from crop soils. Rice cultivation was responsible for 22% emissions. Seven per cent of the emissions were attributed to livestock manure management and burning of crop residue.
The report suggested that LED bulbs initiave is expected to save 30-40% energy and slash electricity bills. This will reduce CO2 emission by 50 million tonnes. Similarly, farmers can replace their inefficient pumps free of cost with the new BEE star rated energy efficient sets. These pumps have smart control panel and a SIM card, giving farmers the ability to remote control these devices from their mobile phones. This will reduce CO2 emission by 45 million tonnes yearly. The waste recycling and waste to energy generation policy would reduce domestic and industrial solid waste. The government is going to press into action 50,000 solar water pumps for agriculture purposes.
The sectors responsible
2014:
Mar 23 2015
Vinayashree Jagadeesh
Urban homes emit more greenhouse gases than industry
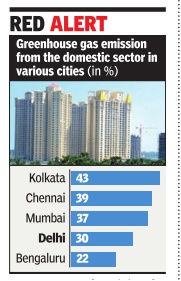
The industrial sector has been taking the flak for emitting high levels of hazardous gases over the years but it might ultimately be our homes that are responsible for the highest emission of greenhouse gases. A study by the Centre for Ecological Sciences of the Indian Institute of Science, Bengaluru, found that the domestic sector in seven cities was one of the highest contributers to greenhouse gases, which are responsible for global warming.
When the cities were considered individually , the domestic sector was the highest contributor in Chennai, Ahmedabad, Kolkata and Mumbai, and second highest contributor in Delhi, Hyderabad and Bengaluru.
Major sources of energy consumption in the domestic sector were electricity for lighting and household appliances and fuel for cooking.The fuels considered during the study were liquefied petroleum gas, piped natural gas and kerosene. Delhi's domestic con sumption accounted for the highest greenhouse gas emissions with 26.4% of the total, fol lowed by Chennai in second place with 19.5% and Grea ter Mumbai with 19.1%, ac cording to a study conduct ed in seven cities by the Centre for Ecological Sci ences of the Indian Insti tute of Science, Bengaluru. The study quantified GHG emissions after considering the following sectors: electricity generation or consumption, domestic and commercial sectors, transportation, industrial, agricultural, livestock and waste. The study also analysed the GHG footprint -total amount of greenhouse gases emitted directly or indirectly and expressed in equivalent tonnes of carbon dioxide -in each of the seven cities. The study's findings were based on data gathered during 2009-10. T V Ramachandra of Energy and Wetlands Research Group, Centre for Ecological Sciences, who headed the study, believes the situation has only become worse over the years.
In Bengaluru, he says, power usage in the domes tic sector has risen. “Poor architecture with an in creasing number of highrise and glass buildings across cities has led to increased energy consumption -14,000 units per person per year,“ he says.
Environmentalists point out that buildings must be designed to min imise use of artificial cool ing and heating.Another reason for increased consumption could be utilising electricity for bathing purposes, they say , pointing out that solar energy must be the first option for citizens.
India contributes more than 5% of the total global emission of greenhouse gases. “While Beijing may be the big brother, the cities here could be smaller brothers,“ says Ramachandra.
According to the study , Delhi has the highest GHG footprint with 39 million tonnes of carbon dioxide equivalent emissions, while the least emissions are in Ahmedabad with nine million tonnes.
