Tourism: India (foreign tourists)
This is a collection of articles archived for the excellence of their content. |
Number of international tourists
1995 to 2014
INDIA SECOND FASTEST GROWING TOURIST DESTINATION , Sep 28 2016 : The Times of India
ii) Tourist arrivals in India, China and other major countries in 2014.
The Times of India
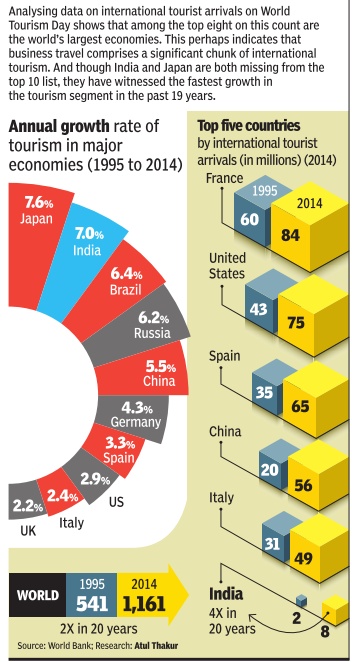
Analysing data on international tourist arrivals on World Tourism Day shows that among the top eight on this count are the world's largest economies. This perhaps indicates that business travel comprises a significant chunk of international tourism. And though India and Japan are both missing from the top 10 list, they have witnessed the fastest growth in the tourism segment in the past 19 years.
See graphic:
i) The growth of tourist arrivals in India, China and other major countries, from 1995 to 2014.
ii) Tourist arrivals in India, China and other major countries in 2014.
1995- 2017

From: July 13, 2019: The Times of India
See graphic, ' Foreign tourist arrivals in India, 1995- 2017'
1997-2014
The Times of India Jan 16 2015
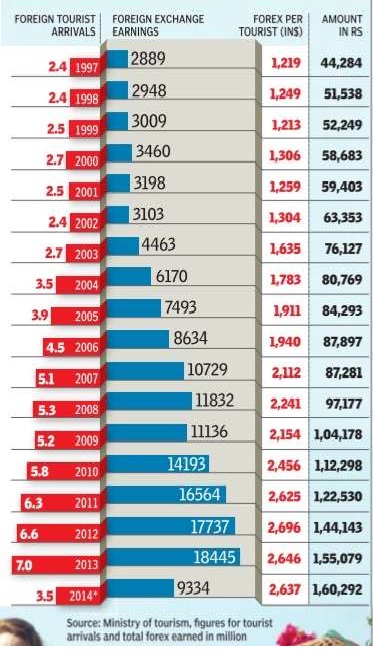
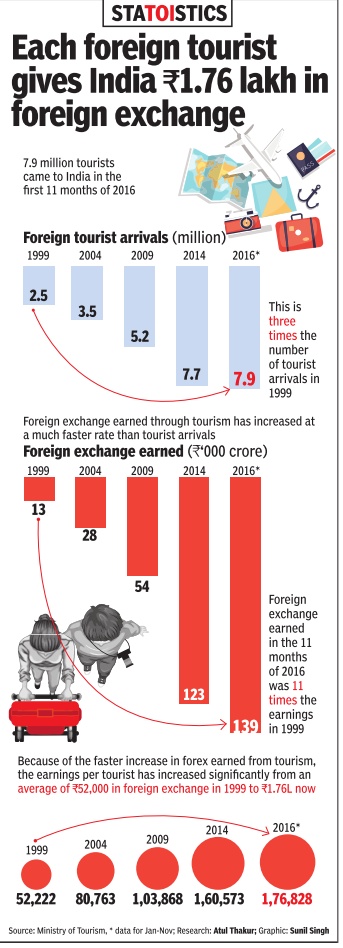
There has been a steady increase in the arrival of foreign tourists in India. In 2013, India was visited by 7 million foreigners, roughly three times the number in 1997. Over this period, foreign exchange earnings from tourism increased by more than six times. What the data shows is that in 1997, the average earning for India per foreign tourist was a little over Rs 44,000, which went up to Rs 1.5 lakh in 2013. Between January and June 2014, the latest period for which data is available, the figure was a tad higher still at about Rs 1.6 lakh per tourist.Studies suggest this might be linked to the relatively long periods for which foreigners stay in India.
See graphic.
1999-June 2016
From: The Times of India, Jan 19, 2017
See graphic:
Foreign tourists arrived and foreign exchange earned in India, 1999-June 2016
2009-18

The Top Ten countries from which India received tourists in 2018.
The Top 5 Indian states that received tourists in 2018.
Indians who travelled abroad, 2009-18.
The Top Ten countries that Indian tourists visited in 2018.
From: March 18, 2020: The Times of India
See graphic:
Tourist arrivals in India, 2009-18
The Top Ten countries from which India received tourists in 2018.
The Top 5 Indian states that received tourists in 2018.
Indians who travelled abroad, 2009-18.
The Top Ten countries that Indian tourists visited in 2018.
2006-16
From: The Times of India, June 22, 2017

From: The Times of India, June 22, 2017
See graphics:
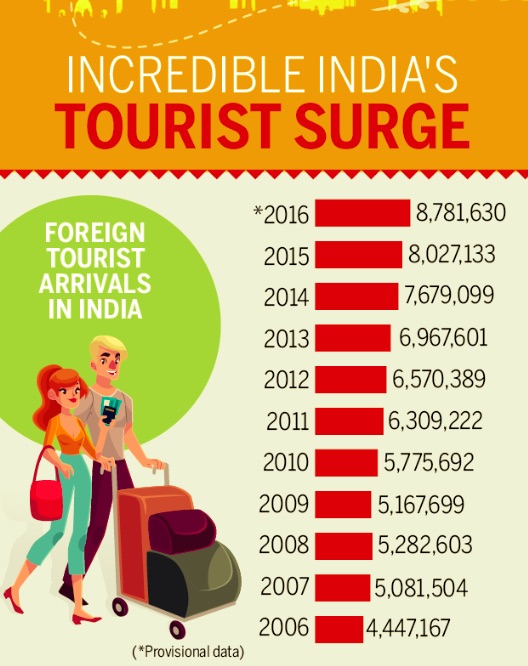
Foreign tourist arrivals in India, 2006-16, year-wise
Number of foreign tourists arriving in India, 2006-16
2015
See graphic.
Jasjeev Gandhiok, For foreign tourists, Delhi is the real gateway of India, The Times of India, May 18, 2017
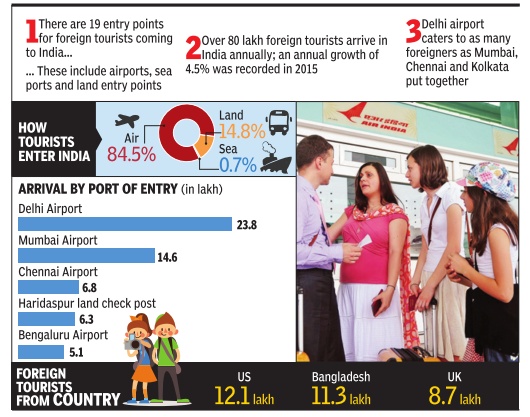
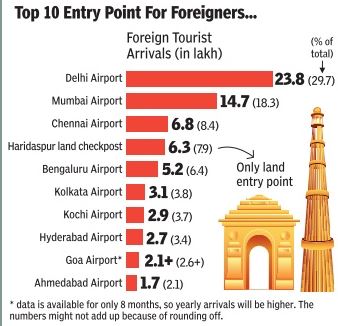
Indira Gandhi International (IGI) Airport continues to be foreign travellers' most preferred gateway into India. According to Indian Tourism Statistics 2015, IGI was used by 23.8 lakh foreigners (29.6%), almost equal to the combined count for the Mumbai, Chennai and Kolkata airports.
According to the report, over 80 lakh foreigners visited the country in 2015, a growth rate of 4.5% compared to 2014. While 84.5% of the foreign travellers arrived through air, 14.8% through land and the rest through sea. The provisional data for the first six months in 2016 show slightly over 41 lakh foreigners came to India, an 8.9% increase over the same period in the previous year.
Among the foreign countries, USA remained on top with 12.14 lakh arrivals in 2015, followed closely by Bangladesh (11.34 lakh) and the United Kingdom (8.68 lakh). Close to 30% of the foreigners used IGI as the landing point before moving to other parts of the country .
“After modernisation, Delhi's IGI has become the busiest airport in the country in terms of passenger and freight movement. We are proud to transform the airport experience not just for flyers but also for the entire airport com munity ,“ said I Prabhakara Rao, CEO, Delhi International Airport Ltd (DIAL).
IGI airport also crossed the 5-crore passenger mark in 2016, handling 5.5 crore flyers, with Mumbai airport coming second at 4.4 crore. According to the DIAL data, IGI saw a jump of 21% from the 4.6 crore flyers it had handled in 2015.
Constant upgrade in faci lities and infrastructure combined with economic airfare rates will bring more foreigners to the country , said an official. While India stands at the 11th position in terms of foreign tourist arrivals in the Asia and Pacific region, its ranking in the world is 40th, reveals the 2015 report.
IGI Airport, currently served by 11 domestic and 51 foreign carriers, connects to 128 destinations, 68 international and 60 domestic.
2017: Jan-June
India sees over 15% growth in foreign tourist arrivals, August 17, 2017: The Times of India
HIGHLIGHTS
A total of 1.19 lakh tourists came on e-visa last month as compared to 0.68 lakh in July 2016
The highest number of tourists arrived from Bangladesh (20.12 per cent), followed by the US (16.26 per cent)
Foreign Tourist Arrivals from January to July, 2017, were 56.74 lakh, recording a growth of 15.7 per cent from last year
NEW DELHI: India has registered a growth of over 15 per cent in foreign tourist arrivals+ from January to July this year, with many opting for e-visa facility+ , the tourism ministry said in a statement.
The highest number of tourists arrived from Bangladesh (20.12 per cent), followed by the US (16.26 per cent), the UK (10.88 per cent) and France (3.01 per cent), said the statement which was released on Wednesday.
Foreign Tourist Arrivals (FTAs) from January to July, 2017, were 56.74 lakh, recording a growth of 15.7 per cent as compared to 49.03 lakh in the corresponding period last year, it said.
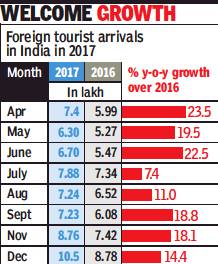
A total of 7.88 lakh foreign tourists arrived in India in July, an increase of 7.4 per cent as compared to the same month last year, it said.
A total of 1.19 lakh tourists came on e-visa last month as compared to 0.68 lakh in July 2016, registering a growth of 73.3 per cent.
From January to July this year, a total of 8.36 lakh tourists arrived on e-visa as compared to 5.40 lakh during the corresponding period last year, recording a growth of 54.7 per cent, the statement said.
The UK's share was highest among the tourists availing e-visa facility at 12.9 per cent, followed by the US (12 per cent), the UAE (7.2 per cent), France (6.4 per cent), Oman (6.1 per cent) and China (5.4 per cent).
2017: 1 crore mark reached
From: Swati Mathur, Foreign tourist arrivals in 2017 hit a high of 1 crore, January 17, 2018: The Times of India
Earnings From Foreign Visitors At $27 Billion
In happy tidings for India’s tourism sector, 2017 ended on a high with the number of foreign tourist arrivals (FTAs) crossing the 10-million (1crore ) mark, which pushed the country’s earnings to over $27 billion.
The sector is looking to ramp up tourist arrivals this year with new and niche projects. “I think our sector is doing very well. But am I happy with the numbers? I want these numbers to increase dramatically because India is an incredible place and we have everything for everybody. So we are trying to bring in lot more people,” Union tourism minister KJ Alphons said in Kochi on Tuesday.
The minister also said the sector is contributing 6.88% to India’s GDP and had a 12% share of jobs in the total employment figures in 2017.
The increase in numbers has helped India ramp up its overall ranking on the Tourism Competitiveness Index, 2017. It jumped 25 places from 65 in 2013 to 40 in 2017. Ministry sources attributed the improvement to the government’s renewed focus on developing infrastructure besides promoting theme-based and religious circuits under the Swadesh Darshan scheme. “Eleven projects have been sanctioned under this scheme in 2017-18 alone, taking the total number up to 67 projects. The plan is for holistic development of pilgrimage destinations, the Buddhist circuit being a case in point,” a ministry official said.
Sources in the ministry also said that the government is “looking East” in the tourism sector to promote India’s north-eastern states. As part of the efforts to introduce new concepts to engage the larger world, India’s golf courses have found mention in the ministry’s ‘Incredible India’ campaign alongside the heritage monuments.
Officials said while they plan to invite foreign tourists to tee off from India’s manicured golf courses, the effort is also to push niche products — women’s Polo — by popularising for tourists visiting India. “The women’s polo team from Manipur has won critical acclaim for its performance. After the United States Polo Association (USPA) team played against the state’s women’s polo team, the sport has got an additional boost. The plan is for the ministry to rope in the Manipur players to popularise the sport from a tourism point of view,” an official said.
2017: US visitors decline by 7%
Saurabh Sinha, September 16, 2018: The Times of India
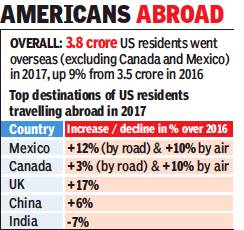
From: Saurabh Sinha, September 16, 2018: The Times of India
The dip in Indian travellers to the US witnessed in 2017 after a gap of eight years is not one-way.
2017 also saw 7% decline in number of US residents travelling to India over 2016, according to the US department of commerce’s National Travel and Trade Office (NTTO). In fact, India was the only big country in the list of top 15 foreign destinations for US residents that saw a decline in their visits 2017 over the previous year.
The NTTO data shows 3.8 crore US residents travelled overseas (not including Canada and Mexico) in 2017, 9% more than the 3.5 crore a year earlier. However, India saw 11.11 lakh of these travellers, down 7% from 11.95 lakh in 2016. Sharat Dhall, CEO of travel portal Yatra, feels a stronger rupee in 2017 may have made Indian an expensive destination then due to which Americans chose other places.
“In 2016, the rupee-dollar exchange rate was averaging at Rs 67-68. In 2017, it was averaging at Rs 64,” Dhall said. The rupee’s devaluation started happening earlier this year and accelerated from April onwards.
The top pull in Asia for US residents was China, followed by Japan and India. The bulk of foreign travel by Americans happens to Mexico and Canada. The overseas destinations are led by countries like UK, France and Spain. In a report on inbound tourism to India, CAPA Centre for Aviation has pointed out that “even amongst the top 10 source markets for leisure travel, India’s share of their outbound traffic remains small.”
2018-21
Oct 4, 2022: The Times of India

From: Oct 4, 2022: The Times of India
The tourism industry that adds billions of dollars to the Indian economy every year was hit hard by lockdowns and travel curbs during the pandemic, but Atul Thakur’s analysis shows it is on the path to recovery
Contribution to GDP
As in 2016

From: July 21, 2020: The Times of India
See graphic:
The Contribution of Tourism to the GDPs of India, China, France, Germany, Italy, Japan, Mexico, Spain, the UK and the USA, As in 2016.
Countries from which tourists come to India
2006 and 2015
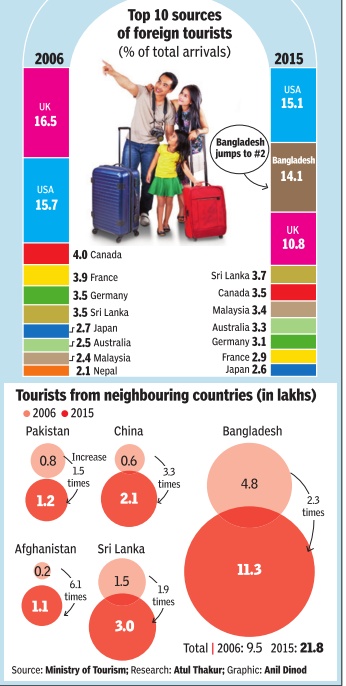
See graphic, ' Countries from which tourists came to India, 2006 and 2015 '
Crimes against foreigners
In 2014
See graphic
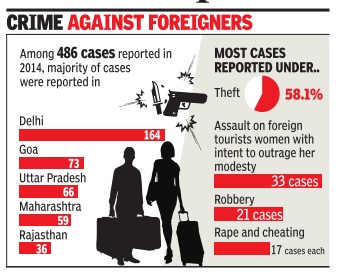
2012-14
The Times of India, Mar 22 2016
Himanshi Dhawan
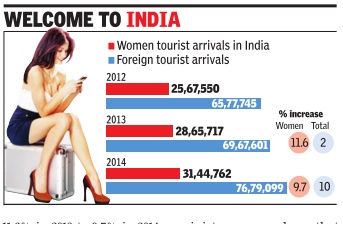
After the Nirbhaya gang rape in December 2012, India's dubious distinction of being unsafe for women got even more strengthened. Industry leaders spoke about women tourists from overseas shying away from the country. However, its impact on tourism can only be gauged now, with government data revealing how growth in women tourist arrivals dropped from 11.6% in 2013 to 9.7% in 2014.This may not appear to be a sharp slide, but it will be useful to note that the total foreign tourist arrivals increased by 10.2% in 2014 as compared to 2% in 2013.
Data from the tourism ministry reveals that 25,67,550 women tourists arrived in India in 2012. This increased to 28,65,717 in 2013 (an increase of 11.6%) and 31,44,762 in 2014 (registering a lower 9.7% increase). At the same time, foreign tourist ar rivals increased from 65,77,745 in 2012 to 69,67,601in 2013 (a mere 2%) to 76,79,099 in 2014 (10.2%). The ministry has also found that the country's number one attraction, the Taj Mahal, is losing its sheen. The number of foreign tourist arrivals to the monument has been steadily dropping, from 7,42,256 in 2012 to 6,95,702 in 2013 and 6,48,511 in 2014. This amounts to a 12.6% decline between 2012 and 2014.
According to the National Crime Records Bureau (NCRB), 384 cases of crime against women tourists from overseas were registered in 2014. Of these, the maximum number of cases were registered in Delhi (135), followed by Goa (66) and Uttar Pradesh (64). NCRB data for pre vious years is not available.The ministry has in recent months introduced some measures to counter the impression that the country is dangerous for women travellers. This includes a 24hour multi-lingual helpline and deployment of tourist police at popular destinations.
The helpline is available in 10 international languages, including Arabic, French, Japanese, Russian and Spanish. The ministry has also issued guidelines to states to devise measures to better protect tourists.
In addition, the ministry has also popularised some tips for travellers, which include taking a picture of a taxi's number plate before boarding it.
2020
Sep 17, 2021: The Times of India
Delhi reported the highest number of crimes against foreigners last year, according to the National Crime Records Bureau. Charge sheets, however, were filed in only 29% of the cases. As for crimes committed by foreigners in the city, most were related to selling drugs or fraud online.
In 2020, Delhi reported 62 cases of crime against foreigners, a drop from the 123 cases reported in 2019 and the 189 in 2018. The reduction in the number of cases can be attributed to the Covid lockdown when flights from abroad were banned or restricted for a while.
On why only 29% of the cases eventually reached the charge-sheet stage, a police officer explained that in many cases the victims of the crime returned to their home countries, making it difficult to pursue the case to its logical end. “However, the cases are always given priority and the chargesheets filed within the stipulated time,” the officer added.
Meanwhile, around 168 foreigners were booked for participation in crimes in the capital. This figure too was a decline from the previous two years. In 2019, 264 foreigners were booked for various crimes and 203 in 2018. Chargesheets were filed in 98% of these cases.
“Most of the foreigners caught were either illegally staying in India and were booked under relevant provisions of the law, while many were arrested under the Narcotic Drugs and Psychotropic Substances Act,” said a police officer. “Other crimes included defrauding of people online, murder and other offences. During the lockdown many foreigners duped people with fake offers on credit card points, etc.”
Destinations, top
2014: graphic
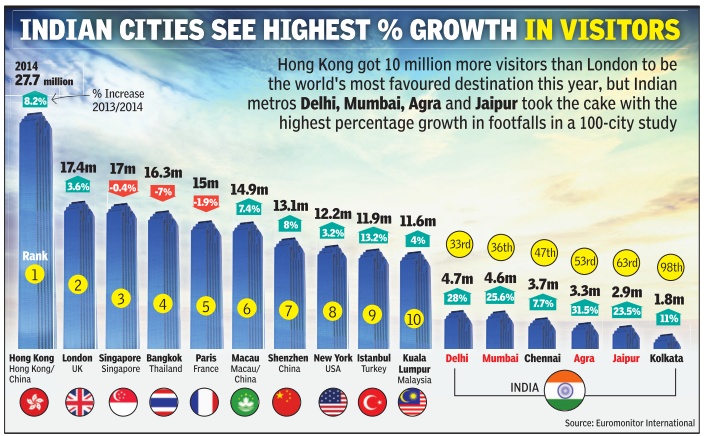
See graphic, ' In 2014, Delhi, Mumbai, Agra and Jaipur had the highest percentage growth (over 2013) among the 100 cities surveyed '
2015: TN, Maharashtra, UP, Delhi top 4
The Times of India, Jul 01 2016
Himanshi Dhawan
Tamil Nadu has topped the popularity charts for both domestic and foreign tourists for the second year in a row, beating Maharashtra and other favoured destinations like Goa and Kerala.
TN received 4.68 million foreign tourists in 2015, a tad higher than 4.66 million in 2014. Domestically , it continued its winning streak since 2013 with 333.5 million Indians visiting in 2015, according to tourism ministry data. Tamil Nadu's rise as a top-ranker for Indian and foreign travellers is surprising and could possibly be attributed to Indians working and studying abroad and non-resident Indians coming to visit family and relatives,“ an industry source said.
Maharashtra came second with 4.41 million foreign tourists, thanks mainly to Mumbai's busy airport that acts as a gateway for India. Uttar Pradesh, with the famous Taj Mahal, attracted 3.1 million tourists and is in the third place while Delhi with 2.38 million foreign tourists came in fourth.
Others states that are in the top 10 included West Bengal (1.49 million), Rajasthan (1.48 million), Kerala (0.98 million), Bihar (0.92 million), Karnataka (0.64 million) and Goa (0.54 million).Goa returned to the top 10 after a year's gap.
The contribution of top 10 states was about 88.4% to the total number of foreign tourist visits in the country during 2015.
Domestic tourists by far overshadowed foreign tour ists' flow with 1432 million tourists in 2015 as compared to 1282 million in 2014, registering a growth of 11.63%.
Besides Tamil Nadu, the top 10 states that Indians travelled to include Uttar Pradesh, Andhra Pradesh, Karnataka, Maharashtra and Telangana.
2016: Tamil Nadu, UP, Andhra Pradesh, MP: top 4
TN top draw for foreign tourists, Goa gets 9th slot, June 24, 2017: The Times of India
Tamil Nadu has bagged the top spot as the country's most popular tourist destination among foreign and domestic tourists in 2016.Uttar Pradesh has emerged as the second most popular destination among domestic tourists and third in foreign tourist visits. For foreign tourists, Maharashtra is the second most popular choice, after Tamil Nadu.
Surprisingly , Goa has failed to make it to the top 10 list of popular destinations for domestic tourists, but it has bagged the 9th place on foreign tourists' popularity charts. Gujarat, despite its aggressive marketing campaigns, failed to impress enough foreign tourists. It is, however, the 9th most favoured holiday destination for domestic tourists.
Tourist arrival data, compiled by the Market Research Division of the ministry of tourism, also suggests 2016 was a happy year on the tourism front, where domestic tourism saw a 12.68% jump, while the foreign arrivals increased by 5.92%. The top ten states in terms of number of domestic tourist visits during 2016 were Tamil Nadu, followed by Uttar Pradesh, And hra Pradesh, Madhya Pradesh, Karnataka, Maharashtra, Telangana, West Bengal, Gujarat and Rajasthan. The ministry's survey also suggested the Top 10 performing states contributed to about 84.21% of the total domestic tourist visits during 2016.
India has improved its performance on the World Tourism Index, where, according to the latest UNWTO Barometer for March 2017, India's ranking in international tourist arrivals in both 2014 and 2015 rose to 24 in comparison to its previous ranks of 41 and 40 in 2012 and 2013, respectively . The number of foreign tourist arrivals in May , 2017 were 6.30 lakh as compared to 5.27 lakh in the same period last year registering a growth rate of 19.5%.
2018: the preferred states, their infrastructure

From: Dec 13, 2019: The Times of India
See graphic:
2018: the preferred destination states, their infrastructure
2021–22: monuments visited most by domestic and foreign tourists
Anuja Jaiswal, Oct 27, 2022: The Times of India

From: Anuja Jaiswal, Oct 27, 2022: The Times of India
NEW DELHI: Though two of Delhi’s World Heritage Sites, the Qutub Minar and the Red Fort, were among the top 10 most popular ticketed and Archaeological Survey of India-protected monuments visited by foreigners in 2021-22, the rush of tourists was far less than in pre-Covid days. However, in this financial year, the footfall of foreign tourists has gone up.
According to available data from the Union tourism ministry, there was a 90%decline in foreign tourist footfall at the World Heritage Sites in Delhi in 2021-22 when compared with 2019-20. ASI's Delhi Circle has around 174 monuments, including Qutub Minar, Red Fort and Humayun's Tomb.
According to ASI, 8,456 foreigners visited Qutub Minar in 2021-22 against 2.5 lakh earlier. Similarly, 5,579 foreigners visited Red Fort in 2021-22 against 91,364 in 2019-20. Humayun’s tomb also witnessed a 97.5% decline in foreigners with just 4,892 tourists visiting the monument last year against two lakh tourists in the pre-Covid period.
However, in the six months April to September this year, ASI says 27,317 foreigners visited Qutub Minar, 14,679 went to Red Fort and 13,974 enjoyed the environs at Humayun’s Tomb.
Indian Association of Tour Operators president Rajiv Mehra said, “In-bound tourism still hasn’t picked up, but we are expecting a third of pre-Covid business by March 2023.” He added that overseas promotion was required to make India visible across the globe.
Those in the tourism business say that delay and difficulty in procuring Indian visas from countries like the UK and Canada were deterring visitors. IATO urged the tourism ministry and prime minister to restore e-visas and focus on overseas promotion of India for revival of the industry. As Mehra said, “If this situation continues, foreign tour operators will stop selling Indian tour packages, which can lead to a big loss for the inbound tourism business.”
Red Fort and Qutub Minar occupied the second and third spots among the 10 most popular centrally protected, ticketed monuments for domestic visitors in the last financial year. While Purana Qila received more domestic visitors (4.7 lakh) than Humayun’s Tomb (3.9 lakh), only 848 foreign tourists visited Purana Qila in 2021-22.
In the first wave, the Covid pandemic led to the closure of monuments in March 2020. They reopened in July after restrictions were eased, but were shut again during the second wave in 2021 before reopening in June. In January this year, the monuments were closed for public visit following a surge in Covid-19 cases triggered by the Omicron variant of the virus.
Entry points for foreign tourists
2015
The Times of India, January 29, 2016
E-visa
1,040% growth in 2015
The Times of India, Jan 15 2016
E-visa a hit: 1,040% jump in tourist inflow
Over 4.45 lakh tourists arrived in India in 2015 through the online visa scheme registering a growth of 1040.4%. The highest number of tourists came from the UK followed by the United States and Russia. Though the growth figures are high, tourists using online facilities are still a small fraction of the total foreign tourist arrivals. India attracted about 70 lakh tourists in 2015 at a growth of 4.5%. During December, 2015, a total of 1,03,617 tourists arrived on e-tourist visa as compared to 14,083 during December, 2014, registering a growth of 635.8%.
Between January-December, 2015 a total of 4,45,300 tourist arrived as compared to 39,046 during January-December, 2014 registering a growth of 1040.4%, according to tourism ministry data.The facility for applying for visas online was started in November 2014.
“This high growth may be attributed to introduction of e-tourist visa for 113 countries... the ministry said in a statement.
One of the immediate impact of the decision has been that India has moved 13 positions ahead -from 65th to 52nd rank -in the Tourism and Travel Competitive Index as per the World Economic Forum report.
According to tourism ministry data 23.81% of tourists came from the UK, 19.59% from the US, followed by Russia (9.33%), Australia (5.44%) and Germany (4.86%). Other countries include France (4.44%), Canada (4.40%), China (3.10%), Republic of Korea (1.83%) and Ukraine (1.67%).
The maximum number of arrivals were predictably at New Delhi airport where 36.23% of the foreign tourists landed. This was followed by Mumbai airport (21.90%), Goa airport (16.54%), Bengaluru airport (5.54%) and Kochi airport (4.68%). Other airports that drew foreign travellers included Chennai (4.21%), Kolkata (2.74%), Hyderabad (2.68%), Trivandrum (2.05%) and Ahmedabad (1.79%).
There were initial teething problems with the online visa facility , initially called “visa-on-arrival“.
Many tourists landed in the country only to be turned back for inadequate documentation. Inundated by complaints, the ministry changed the nomenclature to e-tourist visa. Starting with 40 countries the facility has now bee extended to 113 countries. The tourism ministry now plans to extend it for medical visas as well.
2018: 40% of foreign tourists used e-visa
December 5, 2018: The Times of India
With 21 lakh e-visas issued this year till November 3, electronic visas now constitute around 40% of the total number of visas issued to foreigners, home secretary Rajiv Gauba said.
“The number of e-visas issued has seen a tremendous growth during the last four years from 5.17 lakh in 2015 to 21 lakh this year till November 30,” Gauba said while addressing a conference “Streamlining of India’s Visa Regime”.
“The number of visas issued through e-visa system is now approximately 40% of the total number of visas issued and the figure is soon expected to cross the 50% mark, which is an indication of its popularity. Our e-visa regime is one of the best in the world,” he said.
The home secretary said in order to facilitate arrival and stay of foreign travellers into the country, the government is working on creating a simple and hassle-free visa regime.
He said the e-visa facility now covers 166 countries and foreigners can obtain online visa within 72 hours for travel related to tourism, business, health, medical and conference purposes.
He said India had the potential to become a global education and tourism hub but there is a need for change in the mindset at the ground level to make foreigners feel welcome in the country.
Reasons for visiting India
2002-15 survey

From: February 26, 2018: The Times of India
See graphic:
Reasons foreigners have for visiting India, 2002-15
Mumbai, Delhi score on culture (2017)
From: March 7, 2019: The Times of India
See graphic:
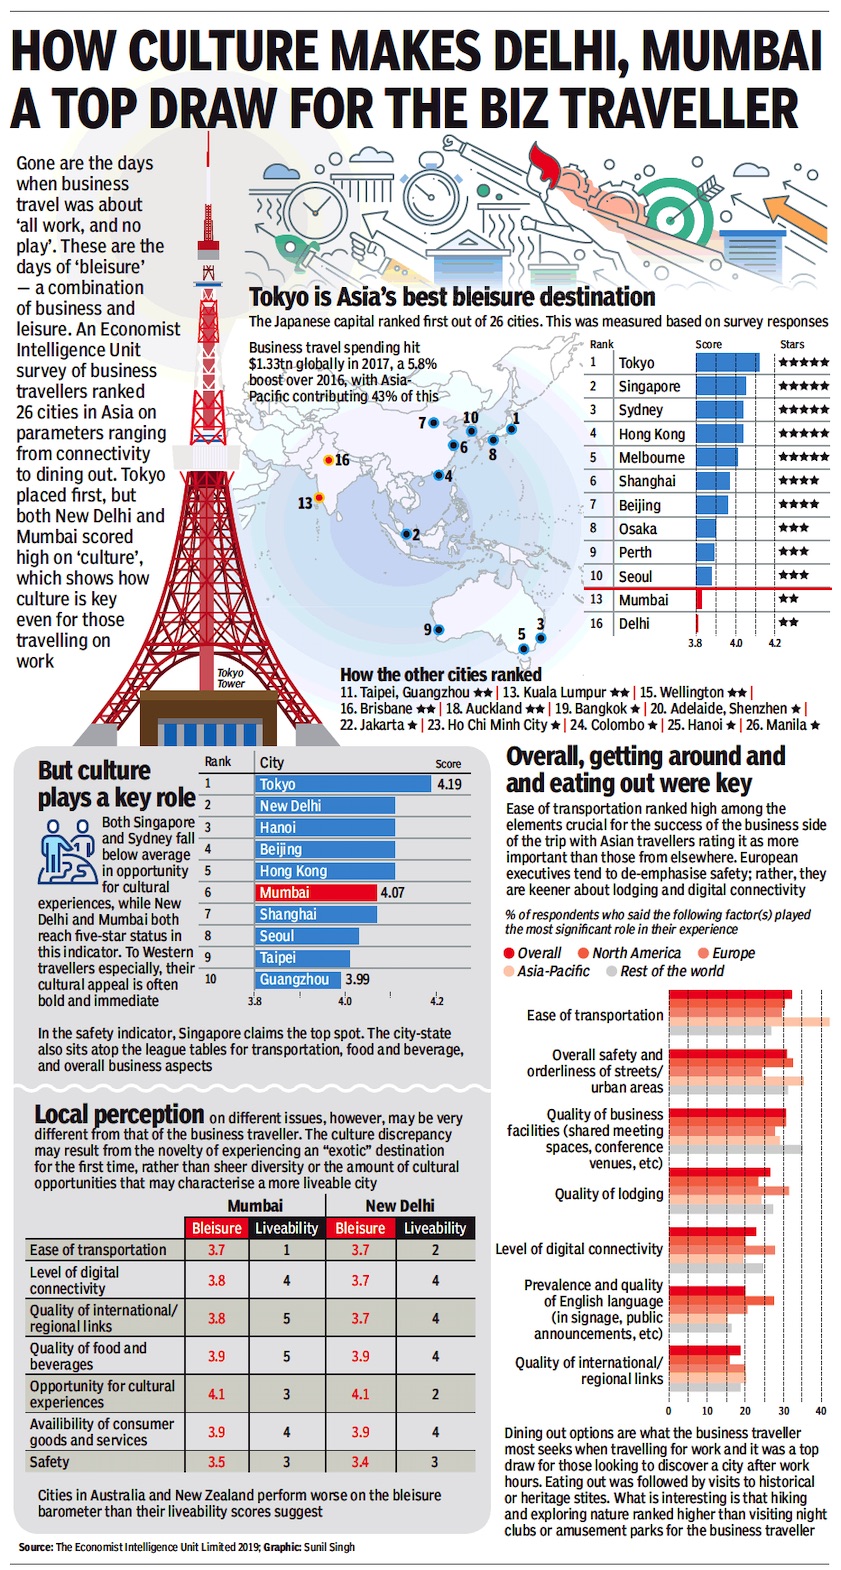
Mumbai, Delhi were India’s top leisure destinations, presumably as in 2017
Receipts from tourism: India vis-à-vis other countries
1995-2013
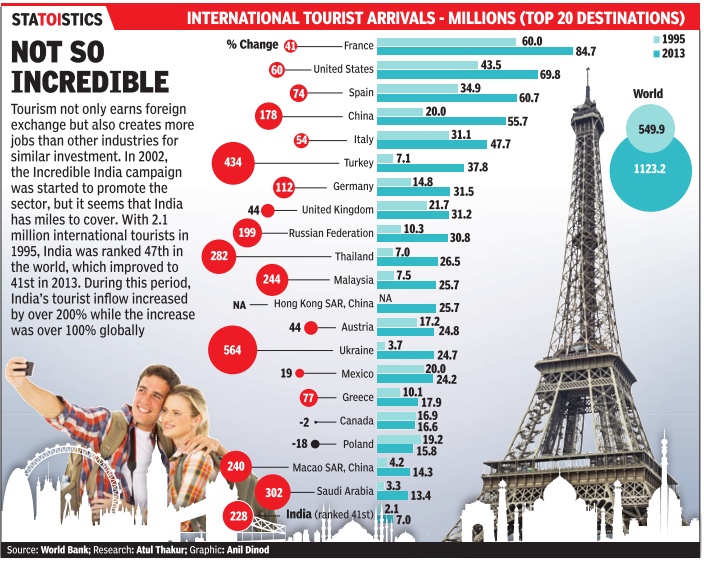
See graphic, 'India and the world: Increase in tourist arrivals between 1995 and 2013, and India’s global rank
1997-2014
See graphic, '1997-2014: Foreign tourist arrivals and foreign exchange earnings, India '
2008-17: foreign exchange earned, no. of tourists
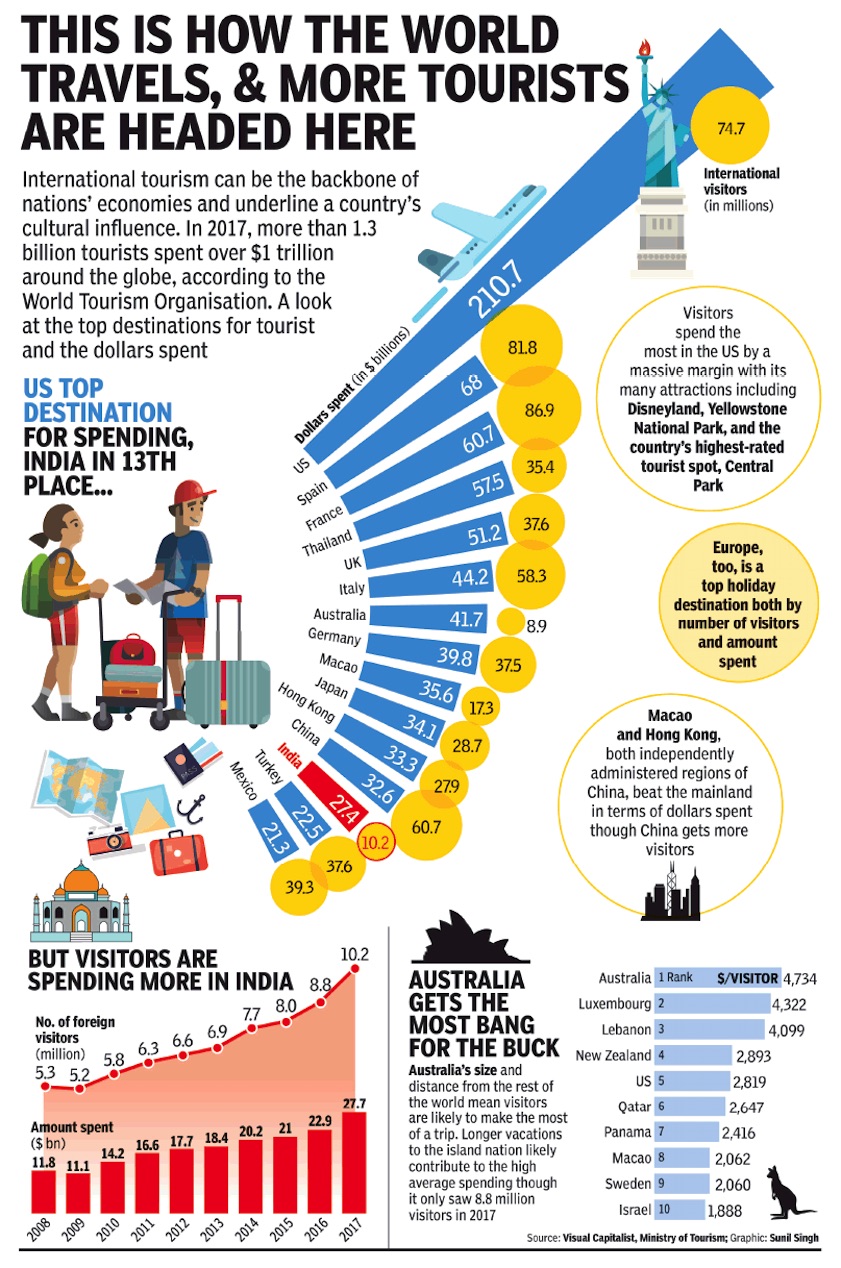
2017; Indian tourism’s rank in the world
From: October 6, 2018: The Times of India
See graphic:
2008-17: foreign exchange earned by India from tourism, and the number of tourists
2017; Indian tourism’s rank in the world
2010-12: Numbers: 41st; per-capita spend: 1st; total earnings: 16
Foreign tourists spend more per-capita and stay longer
India draws tourists with deep pockets
Ranks 41st in number of tourists received but 1st in per-capita spend by them
Ruchika Chitravanshi | New Delhi
business-standard February 17, 2014
India is not on top in numbers of foreign tourist arrivals but the average amount of money spent by international travellers here, on a per-capita basis, is more than anywhere else. Also, according to the United Nations World Tourism Organization (UNWTO) data, though the country is ranked 41st in terms of inbound tourist arrivals, it is 16th in total tourism receipts.
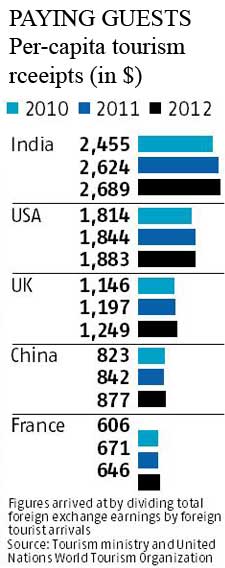
Major tourist destinations like the US, China, the United Kingdom and France see far higher annual foreign tourist arrivals, but their per-capita receipts from inbound foreign travellers is much lower than India. According to experts, this is mainly because of a large number of business visitors to India and longer duration of their stay.
Data from the tourism ministry and UNWTO show international tourists' per-capita spend in India as at the end of 2012 stood at over $2,600, while it was $1,900 in the US, $900 in China and $646 in France.
The difference in India's ratings for number of tourist arrivals and total receipts suggests that the country has been able to draw high-spending travellers. In 2013, it managed to earn $18 billion foreign exchange with only 6.8 million foreign tourists. Comparable 2013 figures for other countries are not yet available.
Other key tourist destinations like the US and China are ranked higher on both parameters. While the US was first in total receipts in 2012 ($126.2 billion), it was ranked second in the number of tourists visiting the country. China, which earned $50 billion from tourists in the year and was ranked fourth, stood third in annual foreign tourist arrivals. France, which received the highest number of foreign travellers (83 million in 2012), has been third in tourism receipts for the past three years.
The share of business travellers in inbound tourism has gone up from 15 per cent in 2009 to 23 per cent in 2012. Globally, during the year, 52 per cent of inbound tourists were for leisure and 14 per cent for business. In India, on the other hand, 27 per cent came for leisure, while 23 per cent travelled for business, according to tourism ministry data.
Besides, India also gets the advantage of being a longer-leisure destination. The average duration of stay for a foreign tourist in India is one week to a fortnight. Given a wide variety of tourist destinations the country offers, several European and American tourists stretch their stay even beyond a month. "We are not a country that a tourist just thinks of, packs a bag and lands. It is not an impulse spot; one needs to plan much in advance. This is why we are not a weekend destination like many of our neighbouring countries," says a spokesperson for Cox & Kings.
Over the past decade, India's rank in total earnings from foreign travellers has risen 20 notches - from 36 in 2000 to 16 in 2012. A depreciation in the value of the rupee has also made India an attractive option for foreign tourists. Besides, in spite of an economic slowdown, the rate of growth in tourist earnings has been higher than the global average. For instance, in 2012 when world tourism receipts grew by 3.2 per cent, India's earnings went up by seven per cent.
The country received the highest numbers tourists from the US, while Chinese nationals were the 12th-largest in terms of number of visitors.
2012-15
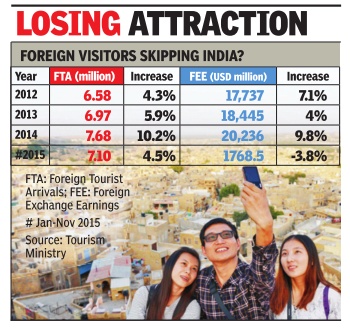
See graphic, ' Foreign tourist arrivals in and foreign exchange earnings, 2012-15 '
Seasons preferred
2015
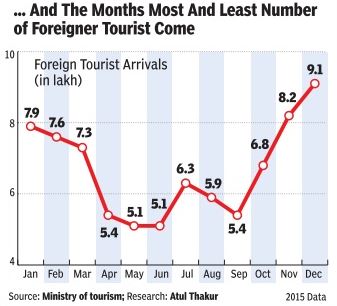
Delhi airport leads airports across the country in terms of foreign tourist arrivals. This might be linked to the fact that Delhi-Agra-Rajasthan is perhaps the most popular tourist destination among visitors from abroad. The national capital is followed by Mumbai, India's financial capital, and Chennai. Interestingly, the fourth highest tourist arrivals have been recorded at the Haridaspur land checkpost on the India-Bangladesh border.
Travel and Tourism Competitiveness Index
2017: India rises 12 ranks to 40
`Swachh' India up 12 notches on travel competitive index, May 4, 2017: The Times of India
India rises in UN's tourism rankings, May 19, 2017: The Times of India
Released by World Economic Forum
India is among the 15 most-improved countries on the global index and has moved up 12 notches from 52 in 2015 to 40 in 2017.Spain remains on top of the index, while Yemen brings up the rear ranked 136.
2017: India rises from 40 ranks to 24
In a boost to India's efforts to increase tourist inflow into the country, the UN World Tourism Organisation's (UNWTO) report showed that India had improved its ranking on the World Tourism Barometer to 24, up from its previous best of 40 in 2015. According to UNWTO, international tourist arrivals (ITAs) have two components -foreign tourist arrivals (FTAs) and non-resident national arrivals. On the World Tourism Barometer, UNWTO ranks countries on the basis on their ITAs. India had so far only compiled FTA figures. This year, though, the tourism ministry has started compiling data of arrivals of NRIs. A ministry release said, “Due to this inclusion, India's improved rank reflecting the true and comparable scenario has now been acknowledged by the UNWTO.“
2015-19: India rises 18 ranks to 34
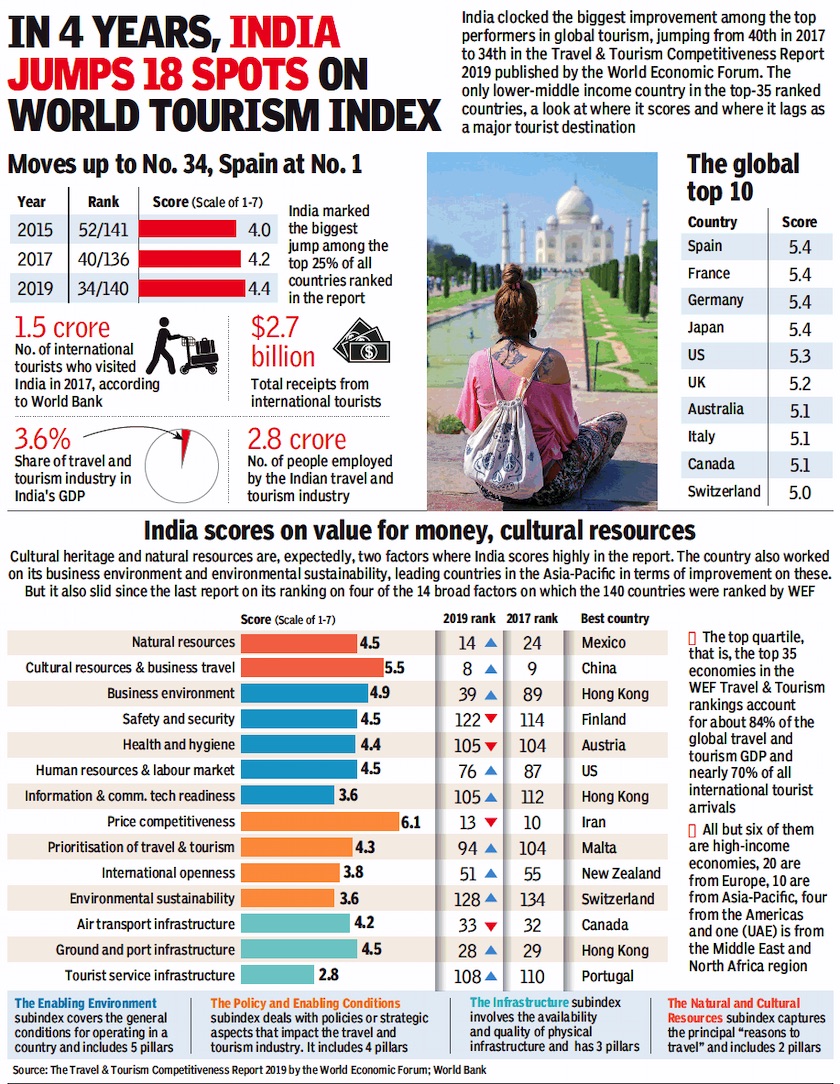
From: Sep 12, 2019: The Times of India
See graphic :
How India compared with other countries on the Travel and Tourism Competitiveness Index in 2019.
See also
Indian Railway Catering and Tourism Corporation (IRCTC)
Manipur: Hospitals/ Medical Tourism
National Capital Region (India): Heritage and Tourism
Tourism: India (foreign tourists)
