National Capital Region (India): Demographic Profile and Settlement Pattern
This article has been sourced from an authoritative, official readers who wish to update or add further details can do so on a ‘Part II’ of this article. |
Contents |
The source of this article
Draft Revised Regional Plan 2021: National Capital Region
July, 2013
National Capital Region Planning Board, Ministry of Urban Development, Govt. of India, Core-4B, First Floor, India Habitat Centre, Lodhi Road, New Delhi-110003
National Capital Region Planning Board
Demographic Profile and Settlement Pattern
BACKGROUND
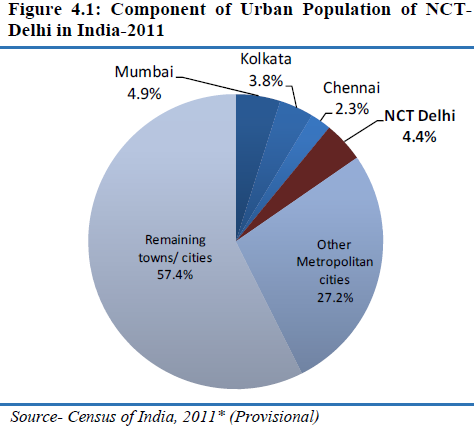
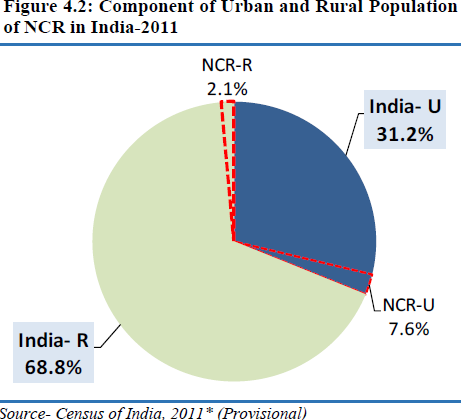
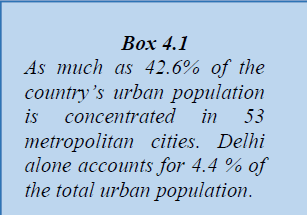
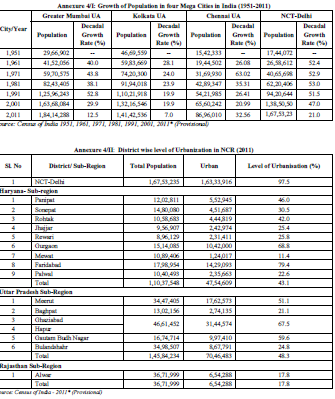
As per Census 2011, India’s population is 1210 million, of which the urban population is 377 million. The level of urbanization has gone up from 27.8% in 2001 to 31.2% in 2011. As much as 42.6% of urban population is concentrated in 53 metropolitan cities. The four major metropolitan cities in India, namely, Mumbai, Kolkata, Chennai and Delhi together account for 15.4% of the total urban population of India (Fig 4.1). The NCR contains about 7.6% of India’s urban population and 2.1% of the total rural population of India (Fig 4.2). About 4.4 % of the India’s urban population resides in NCT Delhi alone.
DEMOGRAPHIC PROFILE
4.2.1 Distribution and Density of Population
The NCT-Delhi has the largest share of population (36.4%) followed by Uttar Pradesh sub-region (31.7%) and Haryana sub-region (24.0%). Rajasthan sub-region has the lowest share of 8.0%. In 2011, NCR had a total population of 460.5 Lakh. Since 1981, share of population in Haryana and Rajasthan sub-regions has almost remained constant; however it increased from 31.4% in 1981 to 36.4% in 2011 in NCT-Delhi and in U.P sub-region it declined from 35% to 31.6% during the same period.
22 Regional Plan 2021
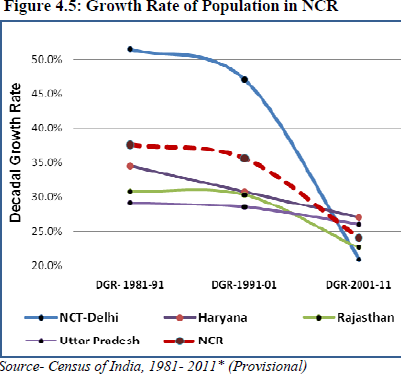
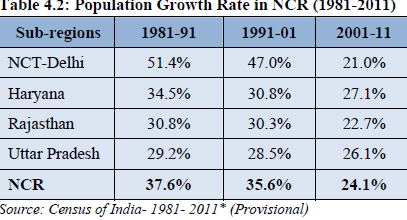
The growth rate of population in NCR has
declined from 37.6% in 1981-91 to 24.1% in
2001-11(Table 4.2). During the last 3 decades,
trends show that the growth rate of population in
all the sub-regions has been declining (Fig 4.5.)
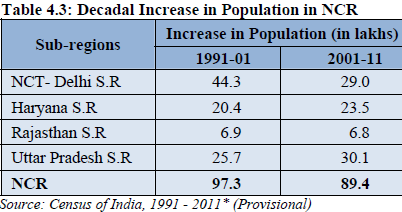
Although the growth rate is declining, there has been a substantial increase in absolute numbers in all the
sub-regions.
During the last decade (2001-11) as much as 29 Lakh persons were added in Delhi’s population. Uttar
Pradesh and Haryana sub-region added 30.1 Lakh and 23.5 Lakh population respectively during the same
period. Rajasthan sub-region also added 6.8 Lakh persons (Table 4.3).
Share of urban population in NCR has however been rising from 50.2% in 1991 to 62.5% in 2011 and the rural population declined in the same proportion (Fig 4.6). In NCR excluding NCT-Delhi the share of urban population has increased from 16.9% in 1981 to 27.0% in 2011.
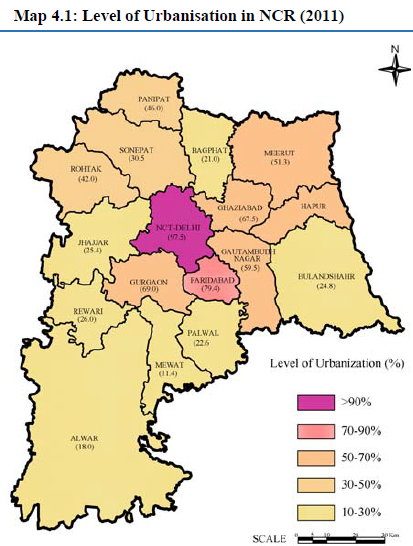
At district level, Faridabad and Gurgaon have urbanization level of more than 50%. Panipat, Sonepat and Rohtak districts have 30 and 50 percent urbanization, while other districts have low level of urbanization in Haryana Sub-Region (Below 30 %).
Similarly, in Uttar Pradesh Sub-Region Meerut, Ghaziabad (incl. Hapur) and Gautam Budh Nagar districts are highly urbanized (more than 50%) while other districts are less urbanized.
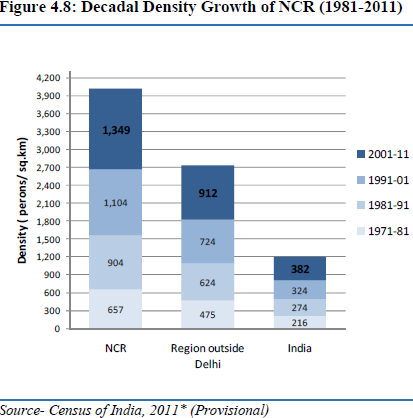
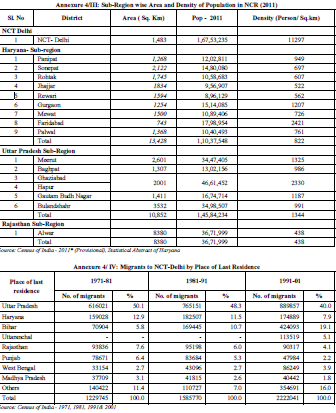
Density of population in NCR has more than doubled from 657 Persons per sq.km in 1981 to 1349 persons per sq.km in 2011 in the last three decades (Fig 4.8). The density of population in rest of NCR excluding NCT Delhi is 912 persons per sq km. Density of population is 1349 persons per sq km in NCR as against the All India average of 382 persons per sq km in 2011. The Sub-region wise density of population is shown in Fig 4.9.
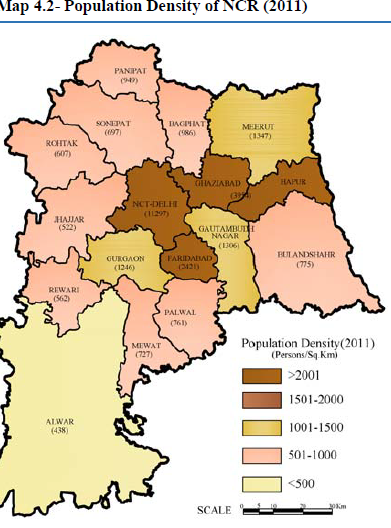
NCT- Delhi has the highest density of population of 11,297 persons per sq.km followed by Uttar Pradesh sub-region with 1344 persons per sq.km. Haryana sub-region has a relatively lesser density of 822 persons per sq.km whereas Rajasthan sub-region has the lowest density of population of 438 persons per sq. km. in the Region. (Map 4.2)
Over the years, density of population has been increasing every decade in all the sub-regions (Table 4.5). At district level, Ghaziabad has the highest density of population of 3967 persons per sq.km followed by Faridabad (2421), Meerut (1326), Gautam- Budh Nagar (1187) and Gurgaon (1207). Other districts have relatively lesser densities below 1000 person / sq.km. (Annex 4/III)
4.2.2 Sub-region wise Growth of Population
A. NCT-Delhi
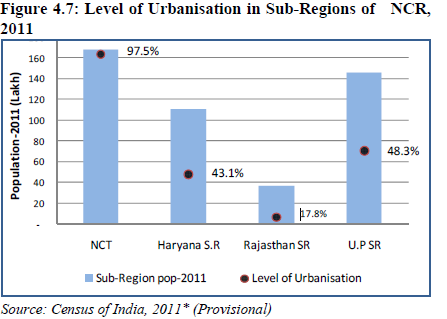
NCT-Delhi is highly urbanized with 97.5% of its population living in urban areas as against the national average of 31.2% in 2011 (Fig 4.10). The decadal growth of population in the National Capital Territory of Delhi during the period 1951-1991 has been consistently above 50%, but in the last two decades, it has steadily declined from 47.0 % in 1991-2001 to 21.0 % in 2001-2011. (Table 4.6) In absolute terms, the population increase was 29.0 lakh during 2001-11, as against 44.3 lakh in the previous decade.
Density of population in NCR as
well as in its Sub-regions has
more than doubled during the
last three decades. It is 1371
person/sq.km in NCR as against
382 person/sq.km at national
level.
Urban
97.5%
Rural
2.5%
26 Regional Plan 2021
The percentage of urban population in NCT-Delhi has been consistently increasing except in 1991 (Table- 4.7). The share of urban population has gone up from 82.4 % in 1951 to 97.5% in 2011. In absolute terms urban Delhi has increased by more than 11 times in the last six decades from 1951-2011.
The total population of NCT-Delhi as well as the
urban population is growing but with declining rates.
During 2001-11, the total population of NCT-Delhi
grew by 21% while urban population grew by
26.6%. (Table 4.6)
The rapid decline in rural population during 2001-2011 is due to the fact that most of NCT Delhi has now been earmarked as ‘Urbanisable’ area as per Master Plan for Delhi-2021. The number of villages have declined from 209 in 1991 to 158 in 2001, probably due to their inclusion in the urban agglomeration and through re-classification or up gradation as urban or census town.
(Census data for rural areas for 2011 is still awaited from Census of India.)
Components of Growth in NCT-Delhi
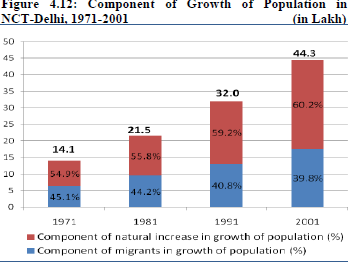
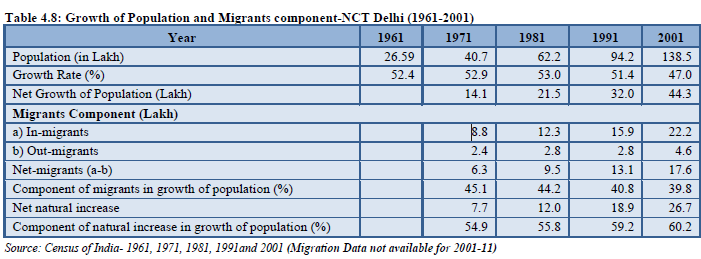
The main components of the population growth are natural growth and in-migration. The share of natural growth during the last four decade during 1961-2001 has been from 50-60 percent. Over the years component of natural growth has increased and share of net migration has declined.
On an average 1.2 to 1.5 Lakh migrants were added per annum in the net growth of Delhi’s population during last 30 years from 1971- 2001 (Fig 4.12).
The share of out-migration from Delhi has also increased from 2.42 Lakh in 1961-1971 to 4.58 Lakh during 1991-2001. Delhi has been witnessing a high rate of in-migration, although there was a decline in the percentage share of net migrants in the decadal growth of population in NCT Delhi from 45.1% in 1961-71 to 39.8% in 1991-01. However, in absolute terms, the number of migrants continuously increased.
The percentage share of migration from NCR States viz. Haryana, Rajasthan and Uttar Pradesh to NCT Delhi consistently declined in the last three decades. Total share of migrants from the above three states declined from 70.65% in 1971-81, to 65.76% in 1981-91 and further declined to 57.09% during 1991-2001 (including Uttarakhand:5.11%) (Annexure 4/IV).
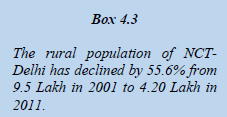
Box 4.3 The rural population of NCTDelhi has declined by 55.6% from 9.5 Lakh in 2001 to 4.20 Lakh in 2011.
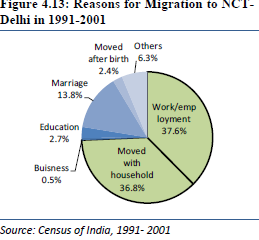
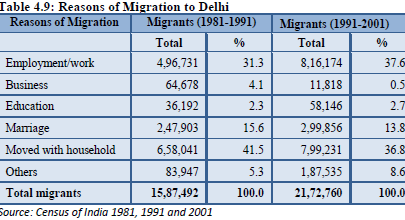
According to Census 2001, the main reasons for migration to Delhi are better employment opportunities
and shifting of residence (Fig 4.13). Both these factors account for 74.4 % of the total migrants to Delhi
during the decade 1991-2001 as shown in Fig 4.13 and Table 4.9.
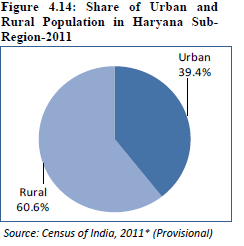
B. Haryana Sub-region: The share of urban and rural population in Haryana sub-region is 39.4% and
60.6% respectively in 2011. Although growth rate is declining, there is substantial increase in the absolute
number. The absolute increase in population of the Haryana sub-region in the decade 2001-2011 was
23.5 Lakh, as against 20.43 Lakh in the previous decade.
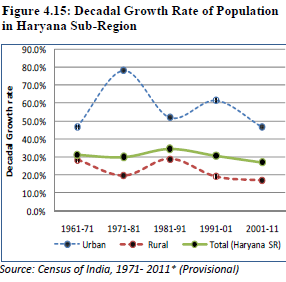
The growth rate of Haryana sub-region has declined
during the last three decades (Table 4.10). During
1981-91, decadal growth rate of population was 34.5%,
which declined to 30.8% during 1991-2001 and further
dropped to 27.1% during the last decade 2001-2011.
There has been a steep decline in growth rate in rural
population. During 1981-91, rural population registered a
growth rate of 28.9% that fell down to 19.0% during
1991-2001 and further declined to 9.8% during 2001-11.
The growth of urban population was phenomenal at a rate of 78.1%, which declined to 52.1% during 1981-91. Further, it increased to 61.5% during the decade 1991-2001 and remained almost constant at 60.4% during the last decade 2001-11.
C. Rajasthan Sub-region- The share of urban and rural population in Rajasthan sub-region is 17.8% and 82.2% respectively. In 2011 (Fig. 4.16), growth of population of Rajasthan Sub-region has been steady, ranging between 25 and 30 percent since 1971. However, during the last decade, the growth of population declined from 30.3% in 1991-2001 to 22.7% in 2001-11 (Table 4.11).
The absolute increase of population in the Rajasthan Sub-region in the decade 2001-2011 was 6.8 Lakh, as against 6.9 Lakh in the previous decade.
The growth of urban population however depicts a different trend. During the period from 1971 to 1991 growth rate of urban population increased from 44.4% in 1971 to 63.2 % in 1991. There was a drastic slip in growth rate of urban population during 1991-2001 registering at 35.8% but further it picked up at 50.4% during 2001-11. Growth of rural population showed an upward trend during 1981- 2001, but declined sharply at 18.0 % during the last decade 2001-11 (Fig. 4.17).
Demographic Profile and Settlement Pattern 29
C. Uttar Pradesh Sub-Region
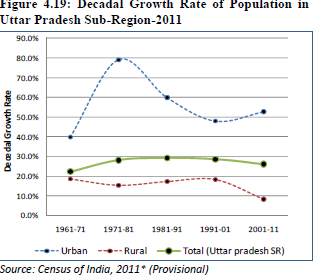
The share of urban and rural population in Uttar Pradesh sub-region is 48.3 % and 51.7% respectively in 2011 and the decadal growth rate increased from 22.20% in 1961-71 to 29.2 % in 1981-1991 (Table 4.12).
Thereafter it marginally declined to 28.5% during 1991-2001 and further declined to 26.1% during 2001- 2011. In spite of declining trends in growth rate there has been an absolute increase of population in Uttar Pradesh Sub-region during 2001-2011, it increased by 30.1 Lakh, as against 25.7 Lakh in the previous decade.
The growth of urban population was very high at 79.1% during 1971-1981 but it declined to 60% during the decade 1981-1991 and further declined to 48% during 1991-2001. After that it increased to 52.7% during 2001-2011. The growth of rural population in U.P Sub region has however sharply declined from 18.2% during 1991-2001 to 8.4% during 2001-2011 (Fig. 4.19).
4.2.3 Sex Ratio
Sex Ratio in NCR is 869 females per 1000 males (2011), which is much below the national average of 940. In 2011, at sub-regional level sex-ratio is lowest in NCT-Delhi at 866 followed by Haryana subregion at 870, UP sub-region at 878. Rajasthan sub-region has a sex-ratio of 894, which is the highest in the region but still below the national average. The lower sex ratio may be attributed to in migration of male population to the region.
In urban area of NCR the sex ratio is 870, which is higher than the rural area. However at sub-regional level the urban sex ratio is the lowest in Haryana Sub-region having 866, closely followed by NCT-Delhi with 867, Rajasthan sub-region with 871 and Uttar Pradesh sub-region with 898. In respect of NCR rural the situation is not better. The Sex ratio varies from 847 in NCT-Delhi to 899 in Rajasthan sub-region. In Haryana and UP sub-regions it is 873 and 879 respectively. Mewat is the only district in NCR where sexratio is 906, while in all other districts it is below 900.
4.3 Population Projections for 2021
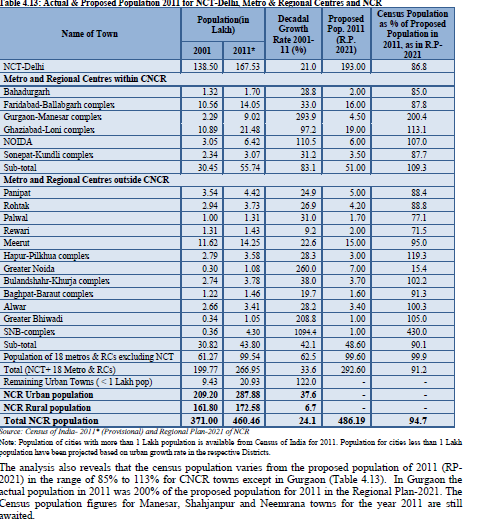
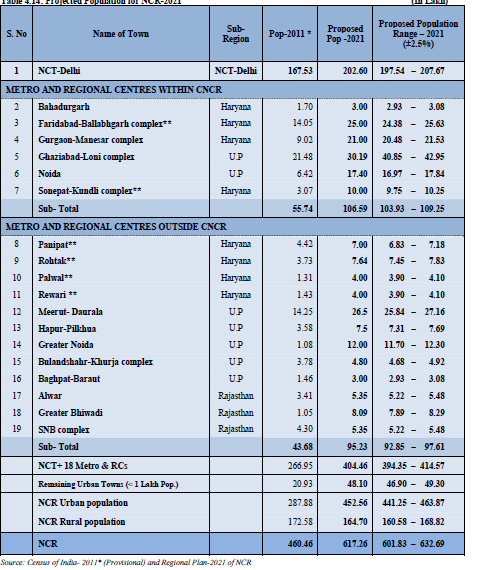
A comparative analysis of the Census 2011* population figures with the proposed population in notified RP-2021 was done to review the trends of population growth in NCR. The analysis indicates that the population of NCR as per Census 2011* is 94.7% of the proposed population as per Regional Plan-2021 for 2011. (Table 4.13) The population of NCT-Delhi and 18 Metro & Regional centres have as much as 92.7 % of the urban population of NCR and the remaining urban settlements/ towns only contribute the remaining 7.3% in 2011.
Note: Population of cities with more than 1 Lakh population is available from Census of India for 2011. Population for cities less than 1 Lakh population have been projected based on urban growth rate in the respective Districts.
The analysis also reveals that the census population varies from the proposed population of 2011 (RP- 2021) in the range of 85% to 113% for CNCR towns except in Gurgaon (Table 4.13). In Gurgaon the actual population in 2011 was 200% of the proposed population for 2011 in the Regional Plan-2021. The Census population figures for Manesar, Shahjanpur and Neemrana towns for the year 2011 are still awaited.
Demographic Profile and Settlement Pattern 31
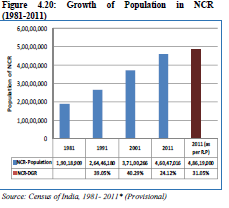
The scenario for Metro and Regional Centres, excluding NCT-Delhi, within CNCR and outside CNCR differs slightly. Metro and Regional Centres within CNCR grew to 55.74 Lakh as per Census 2011, which is 109.3% of the proposed population (51 Lakh) for 2011 as per the Regional Plan -2021. For Metro and Regional Centres outside CNCR, the actual population is 43.80 Lakh as per Census 2011 as against the proposed population of 48.60 Lakh which is 90.1 % of the proposed population. However, the cumulative Census population of all 18 Metro and Regional Centres is almost 100% of the proposed population of 2011. The difference between the proposed population of both NCR and NCT-Delhi vis-à-vis the actual Census population of 2011 (provisional) is about 25.5 Lakh. It may be attributed to the fact that NCT-Delhi grew at a slower rate than anticipated. Figure 4.20 and 4.21 given below depict growth trends of population in NCR and NCT-Delhi.
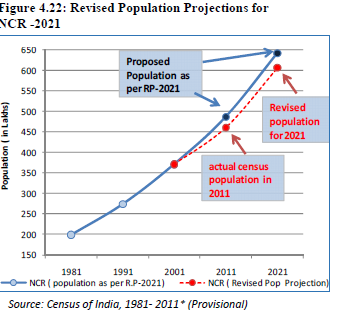
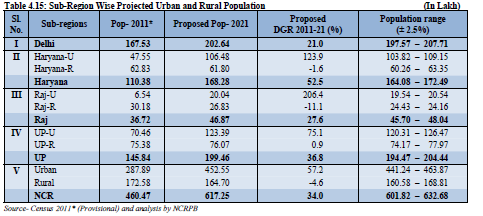
The population projections of 617.25 Lakh for the year 2021 were finalized by the Study Group and subsequent discussions with the participating states (Fig 4.22). The breakup of projected population at sub-regional level include 202.6 Lakh for Delhi subregion, 168.28 Lakh for Haryana Sub-Region, 46.87 Lakh for Rajasthan sub-region and 199.46 Lakh for U.P. sub-region. The proposed population is in the range of ±2.5% (Table 4.14).
1981 1991 2001 2011 2011 (as per R.P) NCR- Population 1,90,18,909 2,64,46,180 3,71,00,266 4,60,47,016 4,86,19,000 NCR-DGR 39.05% 40.29% 24.12% 31.05% 0 1,00,00,000 2,00,00,000 3,00,00,000 4,00,00,000 5,00,00,000 6,00,00,000 Population of NCR
Box 4.4
Earlier population projections in the Regional
Plan -2021 were given in fixed numbers,
however now proposed population has been
given in the range of ±2.5% also.
32 Regional Plan 2021
- Note: These Metro/Regional centres could not attain proposed population of Regional Plan-2021 because some large infrastructure projects
such as RRTS, Metro Rail, Western/ Eastern Peripheral Expressway, etc. are still in the process of implementation. As such, proposed population for these towns in the Regional Plan-2021 has been retained.
The Sub-Region wise break-up of proposed urban & rural population is given in Table 4.15.
4.3.1 Policy Issues
The review of the Regional Plan-2021 as well as the results of the Census 2011 reveals that the actual population in 2011 is 94.7% of the proposed population as per Regional Plan-2021. The proposed population for Metro and Regional Centres within Central NCR towns was 51 Lakh, while the Census population reached 56 Lakh in 2011 which is 109% of the proposed population. In the case of Metro and Regional Centres outside Central NCR, proposed population was 48.6 Lakh, while Census population is 43.68 Lakh which is 90.1% of the proposed population. The analysis shows that the Metro and Regional centres within CNCR have grown much faster than proposed while the Metro and Regional Centres outside CNCR could not grow as anticipated to achieve the target population of RP-2021. The emphasis therefore should be on developing the Metro and Regional centres outside CNCR by providing fast and efficient connectivity, boost to economic activities and development of infrastructure.
4.4 SETTLEMENT PATTERN
4.4.1 Urban Settlements
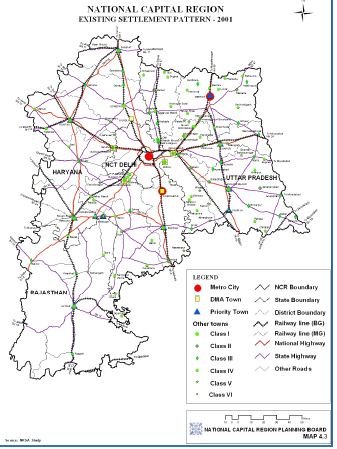
Number of urban settlements in the region has increased from 94 in 1981 to 108 in 2001. Composition of urban centres included 17 UA/Class-I cities, 9 Class-II towns, 27 Class-III, 38 Class-IV, 15 Class-V and 2 Class-VI towns in 2001 (Table 4.16). However as per census 2011, there are 20 UA/ Class I towns. In 2011, the Class-I cities accommodated more than 92.7% of the total urban population of the region and the remaining 7.3% is distributed in 88 towns of Class-II to Class-VI size. The details of urban settlements below 1 lakh population as per Census 2011 are awaited.
- Note: For Census 2011 only the population for cities with more than 1 Lakh is available. The analysis/picture of settlement pattern will change
after the census data on all urban settlements in NCR is made available for 2011.
Regional Plan 2021
There are 35 urban settlements in Haryana Sub-region, 9 in Rajasthan Sub-region and 63 in Uttar Pradesh Sub-region. Outside NCT-Delhi, there are 8 Class-I urban centres in Haryana Sub-region, one Class-I urban centre in Rajasthan Sub-region and 7 Class-I urban centres in Uttar Pradesh Sub-region (refer Map 4.3). (Detailed Census 2011 data is awaited.) The number of metropolitan cities (more than 10 Lakh) in the region increased from three cities in 2001 to four cities in 2011.
4.4.2 Rural Settlements
According to the Census 2001, there were 7,528 rural settlements of various sizes in the National Capital Region. Of these, 158 were in NCT of Delhi, 2,471 in Haryana, 1,954 in Rajasthan and 3,185 in Uttar Pradesh subregions. The rural population of NCR which was 44 % of the total population, increased from 162 Lakh in 2001 to 172.60 Lakh (Provisional) in 2011. The proportion of rural population to total population has however declined. It was 44% in 2001 which has gone down to 37.5% in 2011. Census data for Rural Settlements for 2011 is awaited.
4.4.3 Proposed Hierarchy of Settlements
Regional Plan-2021 proposed a six-tier settlement system i.e., Metro Centre, Regional Centres, Subregional Centres, Service Centres, Central Village and Basic Villages. The same settlement pattern is proposed to be continued and is represented in Table 4.17.
Metro Centre
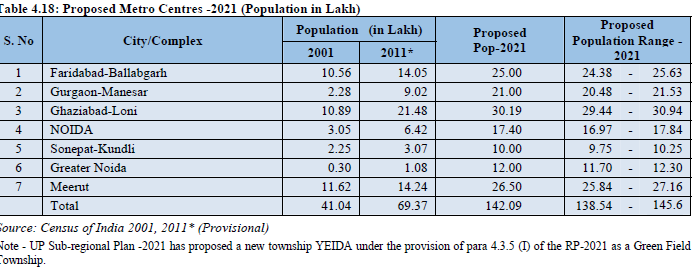
As per the Census 2011, in NCR outside Delhi already three towns/complexes namely Ghaziabad-Loni complex, Faridabad-Ballabgarh complex and Meerut have crossed the one million population mark. Additionally, the participating States have planned urban centres with million plus population in their respective sub-regions. Towns envisaged/planned with million plus population by 2021 are listed in Table 4.18.
Note - UP Sub-regional Plan -2021 has proposed a new township YEIDA under the provision of para 4.3.5 (I) of the RP-2021 as a Green Field Township.
These settlements can, however, act as powerful growth nodes to attract capital functions and activities and help in population dispersal from the national Capital. Given their special functional status and size, a
Box 4.5 Metro and Regional Centres within CNCR have grown much faster than the Metro and Regional Centres outside CNCR, which could not grow as anticipated in the
high level of physical, social and economic infrastructure better than that in the Capital is required to be
developed in these towns/complexes. This would include efficient intra-urban mass transportation system
as well as strong transport and communication linkages with Delhi, other Metro centres and NCR towns.
The respective participating States and their agencies would be required to create the necessary infrastructure themselves in these Metro Centres and also be required to facilitate the private sector investment therein.
B. Regional Centre
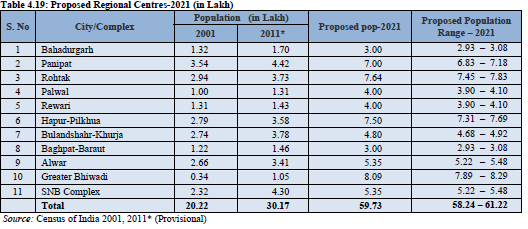
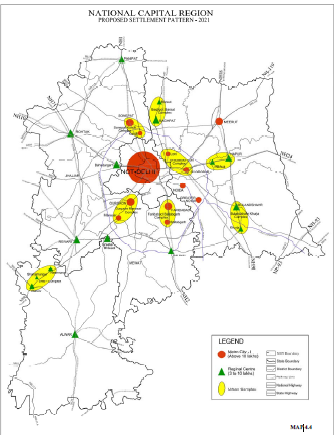
Being second tier settlement it is the well-established urban centre in the region, marked by highly specialized secondary and tertiary sector activities and providing job opportunities, which normally cannot be performed by other lower order centres. These centres will be developed for advanced industrial and other economic activities and will have concentration of administrative and higher order service functions, which are expected to exert an increasingly dynamic influence on attraction of investment and creation of conducive living and working environment. The Regional Centres proposed in the Plan are as under (Table 4.19).
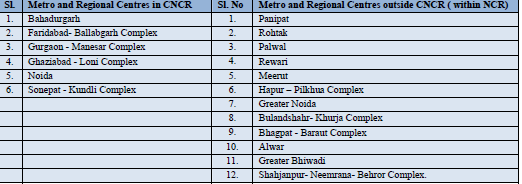
There are 6 Metro and Regional Centres in CNCR, whereas there are 12 Metro and Regional centres outside CNCR (Map 4.4) which are as follows:
The functions of other lower order centres in the hierarchy of settlement are touched briefly in the
Regional Plan. Identification of these centres and their role would be spelt out in the Sub-regional Plan in
detail.
C. Sub-Regional Centre
The Sub-regional Centre shall generally be medium sized towns or intermediate city performing a variety of roles, particularly in promoting and supporting a more balanced distribution of urban population and in providing functional linkages between the smaller towns and Regional/Metro Centres. The Sub-regional Centres are proposed to undertake the urban economic and service functions and will have sound infrastructure like transport, power, water, credit banking, marketing, managerial services etc.
D. Service Centre
The Service Centre shall be a small town or a large village having linkages with immediate rural hinterlands. These centres would cater to the rural hinterland as agro-service centre in collection and distribution of agricultural goods and services with processing, marketing, warehousing and storage facilities.
E. Central Village
The Central Village is the higher order village having central location and potential for development within its catchment area, with relatively better services and facilities in terms of education, health, communication, accessibility and has the capacity to serve a group of Basic Villages. This centre is proposed to provide basic social facilities for population engaged in agriculture and other primary activities.
F. Basic Village All other Census villages with a population of less than 5,000 have been classified as Basic Villages and would be provided with basic facilities like link roads, water supply and electricity, paved streets and lowcost common sanitary facilities as well as the minimum required social infrastructure as per planning norms.
4.4.4 Strategies for Development of Settlement System
Strategies for the development of settlement system would be to harness the growth impulses of Delhi and adjoining towns and to integrate the urban and rural settlements in the region. This could be attained by developing balanced settlement structure and mutually reinforcing system of urban and rural centres. Strategies to achieve these objectives would be as under:
A. Development of a well-knit regional settlement system wherein Delhi and other towns in the region would be allowed to grow as per their carrying capacity so as to harness the development potential within the broad frame of the Regional Plan.
B. In order to make a significant impact of the large growing centres to act as catalyst for development in the National Capital Region, it is proposed to identify new ‘Metro Centres/ Regional Centres/ Investment Regions/ other New Townships’ for intensive development for attracting investment, generation of employment, creation of high-quality infrastructure, robust transport and communication linkages, development of high-quality residential areas, industrial and commercial complexes. The proposed new townships would be growth nodes along the key transport corridors, proposed expressways, orbital rail corridors and other suitable locations either on virgin land or as extension of existing settlement.
C. Development of small and medium towns in the region as Sub-regional centres or service centres. These towns would play an important role in supporting the socio-economic development in their rural hinterland by providing access to education and health facilities, agricultural extension services and agro-based industries depending on local resources.
D. Rural development would be encouraged by providing facilities and services in appropriate hierarchy of service centres, to help stimulate production and increase the income of the rural population. This will help facilitate diversification of the economy.
