Wages, salaries: India
This is a collection of articles archived for the excellence of their content. Readers will be able to edit existing articles and post new articles directly |
Definitions
Special allowance part of basic wages: SC
Dhananjay Mahapatra, Spl allowance part of basic wages: SC, March 1, 2019: The Times of India
In what will have financial ramifications for establishments, the Supreme Court on Thursday ruled that employers cannot segregate ‘special allowance’ from basic wages and must include it for calculation of provident fund (PF) deductions from employees and their matching contribution.
A bench of Justices Arun Mishra and Naveen Sinha dismissed appeals filed by many companies questioning the Provident Fund Commissioner’s decision to club basic pay with special allowances for the purpose of deduction of PF and matching contribution by employers.
‘Cos pass off basic salary as allowance to dodge PF rules’
The Supreme Court ruling is unlikely to impact those with basic salary and special allowances above Rs 15,000 a month, former PF commissioners and consultants said.
The question placed before the bench for adjudication was whether special allowances paid by an establishment to its employees will fall within the expression ‘basic wages’ under Section 2(b)(ii) read with Section 6 of the PF Act for computation of deduction towards PF.
Writing the judgment for the bench, Justice Sinha said, “The wage structure and the components of salary have been examined on facts, both by the authority and the appellate authority under the Act, which have arrived at a factual conclusion that allowances in question were essentially a part of the basic wage camouflaged as part of an allowance so as to avoid deduction and contribution accordingly to the PF account of the employees.
“There is no occasion for us to interfere with the concurrent conclusions of facts. The appeals by the establishments therefore merit no interference. Conversely, for the same reason, the appeal preferred by the Regional Provident Fund Commissioner deserves to be allowed.” Explaining the verdict, the bench of Justices Mishra and Sinha said, “No material has been placed by the establishments to demonstrate that the allowances in question (special allowance) being paid to its employees were either variable or were linked to any incentive for production resulting in greater output by an employee and that the allowances in question were not paid across the board to all employees in a particular category or were being paid especially to those who avail of the opportunity.
“In order that the amount goes beyond the basic wages, it has to be shown that the workman concerned had become eligible to get this extra amount beyond the normal work which he was otherwise required to put in,” he added.
PF ruling may not cover salary over ₹15k/month
Sidhartha, PF ruling may not cover salary over ₹15k/month, March 1, 2019: The Times of India
The Supreme Court ruling on provident fund contribution by employers and employees is unlikely to impact those with basic salary and special allowances above Rs 15,000 a month, but could result in a higher outgo in case of foreigners working in India. “The order will be applicable to those with a basic salary and allowances up to Rs 15,000 as PF contribution. Beyond that, PF is not mandatory,” said a former central provident fund commissioner (CPFC).
K K Jalan, another CPFC, said that the order had been issued as many employers were not deducting PF beyond the statutory minimum wage. “So, we suggested enforcement action in cases where the total payout was higher but the basic was lower and was the basis for PF deduction,” he said. As a result, the order may result in a lower take home salary for some employees but the number will be less.
Kuldip Kumar, a partner at consulting firm PwC India cited a case between Marathwada Gramin Bank employees and the management, where the Supreme Court had ruled that PF authorities could not force an employer to contribute beyond the statutory liability and PF authorities did not go for review petition.
“This ruling lays down the test for excluding a particular allowance from definition of ‘wages’ for PF contribution, where it is variable or incentive in nature and is not paid across the board to all employees in a particular category or paid especially to those who availed the opportunity. Where any such allowances are to be included in wages by virtue of this ruling and wages go beyond Rs 15,000 a month, whether PF authorities will force employers to contribute on this higher amount? In May, 2014, PF authorities issued instructions to its field officers that they should not force employers to contribute over and above the statutory wage ceiling (of Rs 15000) following decision of the apex court in the Marathwada Gramin Bank case,” he added.
While special allowances have been a cause for heartburn for many employees, who believe that their PF payments and post-retirement savings are impacted, several do not want higher deductions as it would reduce their takehome salary. “There is always a predicament,” said Jalan.
Backward groups, castes
2005-2012

From: Radheshyam Jadhav, For backward groups, regular jobs double the salary than casual work, September 4, 2018: The Times of India
Wages Up From FY05 To FY12, But Disparities Persist: ILO
Access to regular work or salaried employment meant almost double the wages or more for schedules caste (SC) and other backward classes (OBCs) compared to those engaged in casual work. For scheduled tribes (ST), regular employment almost tripled their wages compared to earnings from casual work, which was the lowest among all social groups. Women casual workers are at the bottom of the wage disparity pyramid, irrespective of social group and location.
This was revealed in the International Labour Organisation’s (ILO) India Wage Report which looked at wage data from 2004-05 and 2011-12. According to the report, even though wages of all categories of workers had increased, disparities across social groups persisted. It called for strengthening inclusive strategies to provide equal opportunities for access to education, employment and skill development for disadvantaged social groups.
Regular SC and OBC workers, both men and women were paid between 2 and 2.4 times more than casual workers in urban areas. But for the STs the difference is even higher, ranging from 2.8 to 3.2 times more for male and female workers. Even among upper castes, transition from casual to regular meant a three-fold increase in income. This could be attributed to the significantly higher average wages for upper castes in regular employment as they have access to better paid jobs than other social groups.
STs and SCs have a much lower share of regular workers in comparison to their share in the total workforce, the report added. Between castes, irrespective of gender and location, wage difference is more pronounced in regular work than casual work.
In rural and urban areas, men from scheduled tribes in regular employment had higher average wages compared to SCs. “This could be partly due to affirmative action which allowed them to gain entry into low-wage regular employment” stated the report.
Wage differentials between social groups clearly show that SCs and STs are well behind upper castes in both rural and urban areas. “The Indian labour market is segregated on the basis of social background, that is, caste. Some disadvantaged groups, like SCs and STs, have been historically marginalized with regard to unequal access to education, employment opportunities, and opportunities to develop skills in certain sectors, thereby widening income inequality” the report observed.
Growth in salaries, sector-wise

From: Radheshyam Jadhav, Netas, managers got the biggest pay hikes since 1993, September 21, 2018: The Times of India
Wage Gap Between Men, Women Has Declined, But Is Still Quite Wide
Real average daily wages for legislators, senior officials and managers nearly doubled between 1993–94 and 2011–12, the fastest rate of growth across occupational categories, according to the International Labour Organisation’s (ILO) India Wage Report.
Analysing data from the National Sample Survey Organisation, the report concluded that legislators, senior officials and managers had seen their real wages go up by 98% on average while “professionals” saw a 90% jump in their salaries.
At the other end of the spectrum, plant and machine operators have secured a much lower 44% hike in average real wages over this nearly two decade -long period. Across occupational categories, the average rise in real daily wages was 93%.
The data also shows an interesting difference in the pattern of these increases. In the case of the occupational categories that have seen the highest percentage increases in real wages, the pace of increase slowed down after 2004-05. For the ones that have seen the lowest increases, on the other hand, the pace of wage increase picked up.
One result of this is that “the ratio between the bestpaid occupation and the lowest ranked was 7.2 in 1993–94, increased to 10.7 in 2004–05 and declined to 7.6 in 2011–12,” as the report notes. Daily wages for low-skilled occupations grew at 3.7% between 2004–05 and 2011–12, which partially accounted for the decline in wage differentials, the report stated.
The report highlights that salaries in urban India rose steadily during the period of high economic growth (1993–94 to 2004–05) and this was especially so for those working in the professional and administrative categories. The Pay Commissions contributed not just to higher government and public sector wages but also had an impact on wages in the private sector, particularly at the upper levels, the report concluded.
The lowest-skilled occupation receives a salary that is only 60% of the average earnings, while medium-skilled jobs receive wages varying from 0.7 to 1.8 times the average earnings. High-skilled occupations receive wages which are 1.9 to 4.3 times higher than average earnings.
However, the increase in average daily wages has not been the same for men and women. It is in the highest ranks of labour (legislators, senior officials and managers) that the gap is the smallest. In 2011–12, women in this category earned 92% of what the men earned. Among professional workers, women earned only 75% of men’s wages in 2011–12.
In low-skilled jobs, women receive only 69% of men’s average daily wages. This occupational segregation seems to have intensified during the period 1983 to 2011–12. Further, there is a higher propensity for scheduled castes to be stuck in occupations with lower wages, the report said.
Despite the reduction of the gender wage gap in most occupational categories over time, the difference between men’s and women’s average daily wage is still quite large, the report noted. Also, women workers have a lower probability of getting social security benefits than their male counterparts as most of them are concentrated in lowskilled occupations.
The increase in average daily wages hasn’t been the same for men and women. Women earn only 69%-75% of daily men’s wages. Also, women workers have a lower probability of getting social security benefits than their male counterparts as most of them are employed in low-skilled occupations
Changes over the years
1993-2012: women’s-, rural- and unorganised- wages grew faster than men’s- and urban- wages

From: Radheshyam Jadhav, Women still earn less, but wage gap has narrowed, August 28, 2018: The Times of India
ILO’s India Report Shows Rural Income Grew Faster Than Urban, Women’s Employment Rose Faster Than Men’s
Average wages in India increased more rapidly for women than for men between 1993-94 and 2011-12, thereby closing the gender gap, though women continued to be paid less for the same work, according to a report by the International Labour Organisation (ILO).
The ILO’s India Wage Report also revealed that wages in the unorganised sector grew faster than for those in organised employment over this period. It added that while employment in the organised sector has grown, many of these jobs are not of a permanent nature.
The participation of women in regular/salaried employment has increased at a higher annual rate
(4.7%) than for men (2.9%) from 1993-94 to 2011-12. The gender wage gap has narrowed not only at the average level but also across states, industries and occupations, as well as across the different quantiles of the wage distribution. However, the gap remains very high by international standards, despite declining from 48% in 1993-94 to 34% in 2011-12. This gap can be observed among all types of workers — regular and casual, urban and rural. As a result, of all worker groups, the average daily wages of casual rural female workers is the lowest (Rs 104 per day).
“Female workers are paid a lower wage rate than their male counterparts in each employment category (casual and regular/salaried) and location (urban and rural), although the differences are smaller – on average – in urban than in rural areas,” the report states. Women are over-represented in low-skilled occupations and this occupational segregation seems to have intensified during the period 1983 to 2011-12, the report observed.
It pointed out that the Indian labour market remains characterised by high levels of segmentation and informality. Of the total employed in 2011–12, more than half
(51.4% or 206 million people) were self-employed, and of the 195 million wage earners, 62% (121 million) were employed as casual workers.
Though regular/salaried employment has increased over time, much of the increase involves jobs on short-term or fixed-term contracts. There has been a sharp and sustained rise in the share of contractual workers in the organised manufacturing sector, from 14% in 1990-91 to 35% in 2011-12, the report noted.
“From 2004-05 to 2011-12, regular/salaried employment without social security and other non-wage benefits grew in this sector at an astonishing 9.2%, higher than regular formal employment that increased at 3.2% for the same period. Hence, there is a fragmentation within the organised economy, where a growing proportion of regular/salaried workers seem to be informal, without access to social security. The organised sector also continues to rely on the use of casual and contract labourers in high proportions, in some sectors,” the report stated.
The report pointed out that while casual wages have increased faster than those for regular workers over the past decade, there remains a large gap between the wages of casual and regular workers. In 2011-12, the average wage paid for casual work was still only 36% of the compensation received by regular/salaried workers.
Interestingly, over the period as a whole, agriculture was the sector with the highest wage increases. Much of this happened in the second half of the period, which suggests that MNREGA may have had an impact.
2022
Atul Thakur, March 19, 2023: The Times of India
From: Atul Thakur, March 19, 2023: The Times of India
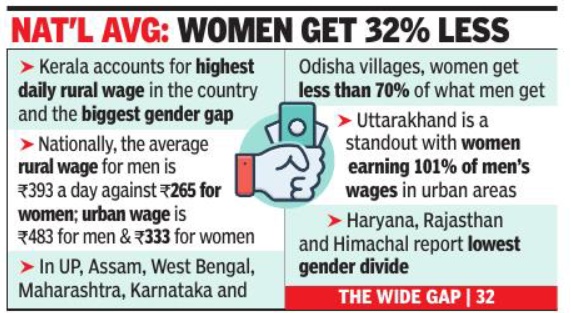
Market determined wages for similar work are significantly lower for women compared with those of men in both rural and urban India. What is worse is that the gap has widened in rural areas over the last decade though it has narrowed in the towns. These are survey findings just released by the National Statistical Office in the form of a report, Women and Men In India 2022. During April-June 2022, the time of the latest survey, the female wage rate ranged across states from just over half to 93. 7% of male wages in rural India and from just under half to 100. 8% in cities.
A comparison of these wages with NSSO’s 68th round report (July 2011 June2012) shows that for most states, the gender divide in wages has increased in the rural areas (in 11 of 19 large states). Urban areas, on the other hand, have witnessed a narrowing of this gap in the past decade.
Comparisons within India; with other countries
Delhi vis-à-vis Mumbai, major world capitals/ 2016

From: Sidhartha, `Workers get more pay, fewer days off in Delhi than Mumbai', Nov 2 2017: The Times of India
Working in Delhi is mo re remunerative than Mumbai but you may have to do with fewer days off than in the country's financial capital. But if you are an employer, you may prefer to be in Mumbai, not because of lower wages, but due to value added by workers being higher than the wage.
The World Bank's Ease of Doing Business report released on Tuesday shows that a cashier in a Delhi supermarket is entitled to a monthly minimum wage of $217.6 a month, which translates to over Rs 14,000 at current exchange rates. This works out to be over 60% higher than the Rs 8,650 a month that a similar worker with a year's experience will earn in Mumbai. The Bank's analysis is based on a survey that compared the earnings and working conditions of 19-year-old cashiers in supermarkets that employ 60 workers across 190 countries. Delhi and Mumbai were the two cities surveyed in India.
For a worker, higher wages will compensate for more wor king days. Number of annual paid leaves in Mumbai were 21 and 15 in Delhi. But from the supermarket's point of view, the ratio of the cashier's minimum monthly wage to the value addition per worker was more favourable in Mumbai. Going by World Bank's calculations, the value addition by a worker in the Capital is roughly equal to the minimum wage, whereas in Mumbai wage is only 60% of the value added.
It's a different matter that minimum wages in Mumbai seem to be much lower than those in several developing countries, such as Mexico City ($152), Vietnam ($168) and Kuwait ($199).
At the same time, Delhi is more expensive than Jakarta, Kuala Lumpur or even Manila.
In several labour-intensive industries such as textiles or leather, wages often play a crucial role in deciding where a company will locate its manufacturing facility . In fact, the recent rise in wages in China is seen to be driving companies that operate large factories to other countries in the region such as Vietnam, Cambodia and even India. But wage cost is not the sole criteria. Quality of manpower, working conditions, the impact of unions and productivity are equally important, if not more.
2017: India had fastest wage growth in South Asia
November 28, 2018: The Times of India

From: November 28, 2018: The Times of India
Globally, the rate of growth in wages in 2017 fell to its lowest level since 2008, but workers in India had the highest average real wage growth in Southern Asia of 5.5% over the period 2008-17.
At the same time, India and Pakistan had the dubious distinction of having the highest gap between what men earn and what women do. The mean gender pay gap of 34.5% for India and 34% for Pakistan on the basis of hourly wages were the worst among 73 countries for which data was available. Globally, women continue to be paid about 20% less than men. Not surprisingly, the gender gap in wages was lowest in high income countries and highest in low and middle income countries.
These were among the findings of the Global Wage Report 2018 brought out by the International Labour Organisation (ILO). Globally, growth in wages in real terms (that is, adjusted for price inflation) declined from 2.4% in 2016 to just 1.8% last year, far below the level of 3.4% before the global financial crisis. If China with its huge population and rapid wage growth were excluded, the global real wage growth would be just 1.8% in 2016 and 1.1% in 2017. The slowdown in wage growth in 2017 occurred in spite of more rapid economic growth.
Workers in Asia and the Pacific have enjoyed the highest real wage growth among all regions over the period 2006–17 with countries such as China, India, Thailand and Vietnam leading the way. However, even here, wage growth in 2017 was lower than in 2016, falling from 4.8% in 2016 to 3.5% in 2017. Again, if China were removed, the growth would be even lower.
Over a longer period, 1999 to 2017, real wages have almost tripled in the emerging and developing countries of the G20, while in advanced G20 countries they have increased by just 9%. Yet, in many lowand middle-income countries, average wages remain low and insufficient to adequately cover the needs of workers and their families, pointed out the report.
According to the report, gender pay gap is wider at the high end of the pay scale in high-income countries, while in low- and middle-income countries the gender pay gap is wider amongst the lower paid workers.
The report also shows that traditional explanations, such as differences in the levels of education between men and women workers, play a limited role in explaining gender pay gaps. “In many countries women are more highly educated than men but earn lower wages, even when they work in the same occupational categories,” said Rosalia Vazquez-Alvarez, econometrician and wage specialist at the ILO and one of the authors of the report. “The wages of both men and women also tend to be lower in occupations with a predominantly female workforce. To reduce pay gaps, more emphasis needs to be placed on ensuring equal pay for women and men, and on addressing the undervaluation of women’s work,” she said.
2018: India leads Apac in salary hike
February 28, 2018: The Times of India

From: February 28, 2018: The Times of India
India Inc tops the list among Asia Pacific (Apac) countries with a projected salary hike of 9.4% in 2018, revealed data from Aon India’s Salary Increase Survey. China comes second with a rise of 6.7%.
The study, which surveyed around 1,000 companies across 20 industries, said companies in India gave an average pay increase of 9.3% last year. It marked a departure from the double-digit increments given by organisations earlier. The projections for 2018 are expected to be similar, highlighting increasing prudence being displayed by companies, while finalising pay budgets.
“Despite an improvement in macro-economic forecasts, salary increases remain at the same level as was projected in the last fiscal,” said Anandorup Ghose, partner at Aon India. “With increasing maturity, HR budgets are being realigned towards top performers as opposed to the broader population.”
Pay increases are becoming more nuanced, Ghose added. “We are increasingly seeing a multitude of factors impacting salary increases, such as size of the company, business dynamics within the sub industry, nature of talent requirements and quite obviously, performance,” he said.
Focus on performance is getting sharper every year across sectors and companies. Top performers are getting an average salary increase of 15.4%, around 1.9 times the pay increase for an average performer. Moreover, there is significant drop in the percentage of people in the highest-rating bracket. Pay increases for top and senior management are consistently going down.
However, there is reason to cheer for people in sectors such as professional services, consumer internet companies, life sciences, automotive and consumer products, as these continue to project a double-digit salary increase for 2018. The attrition rate in India has come down from an average 20% in previous decade to 15.9% in 2017.
2018: Bengaluru’s managers are the best paid
Bengaluru’s managers are the best paid, May 8, 2018: The Times of India
From: Bengaluru’s managers are the best paid, May 8, 2018: The Times of India
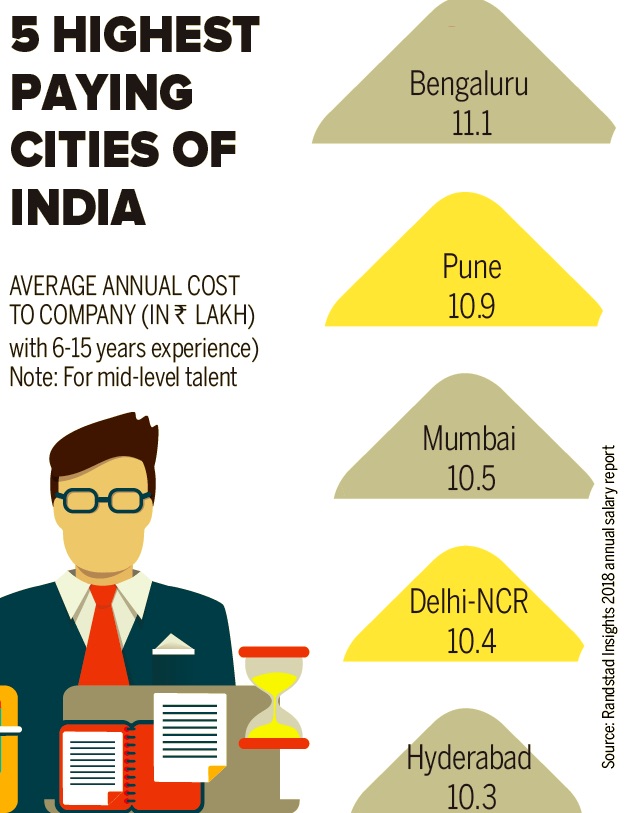
Bengaluru is the best place to work if you’re a mid- or senior-level professional, with salaries in the IT hub the highest in the country for the second year running. For freshers, it’s Pune where the salaries are highest.
See graphic:
Salaries of senior-level professionals in the bigger Indian cities, as in 2018
2018: India vis-à-vis emerging markets

From: January 8, 2019: The Times of India

From: January 8, 2019: The Times of India
See graphics:
Manufacturing wages in India and other emerging markets (China, Thailand, Malaysia), presumably as in 2018-I
Manufacturing wages in India and other emerging markets (Indonesia, Philippines, Vietnam), presumably as in 2018-II
2020-21: City-wise comparisons
Namrata Singh, January 5, 2022: The Times of India
From: Namrata Singh, January 5, 2022: The Times of India
From: Namrata Singh, January 5, 2022: The Times of India
From: Namrata Singh, January 5, 2022: The Times of India
From: Namrata Singh, January 5, 2022: The Times of India
From: Namrata Singh, January 5, 2022: The Times of India
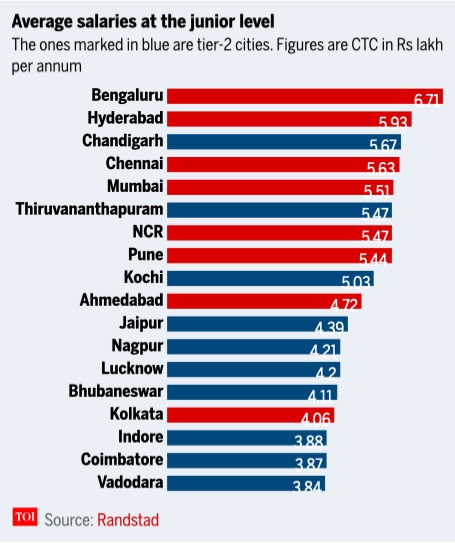
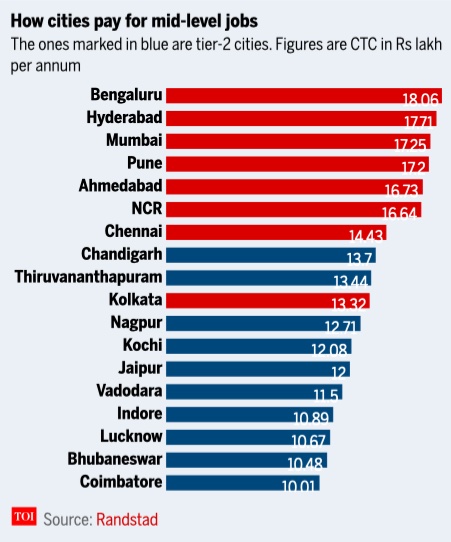
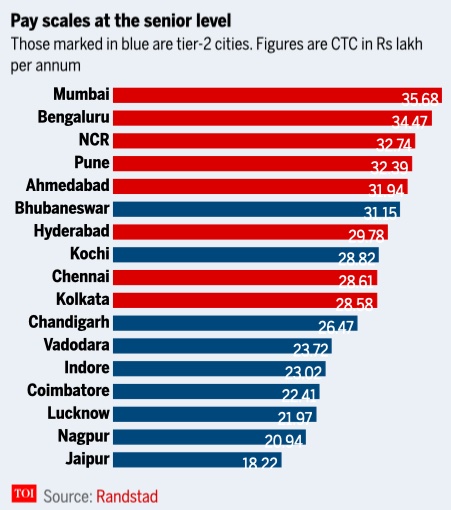
Bhubaneswar pays more than Hyderabad at the senior level, and Thiruvananthapuram as much as NCR at the junior level. The latest Randstad salary trend report, for the first time, included 10 tier-2 cities in its survey in addition to the usual list of India’s biggest cities. The reason? “They are emerging as future talent hubs and job creation centres,” the report says.
How the pay scales stack up
Among tier-2 cities, Chandigarh tops the chart in salaries paid for those with five or fewer years of experience (average CTC Rs 5.7 lakh per annum), even ahead of the national average for tier-1 cities — Rs 5.52 lakh. Thiruvananthapuram comes a close second, offering Rs 5.47 lakh, just as much as NCR does and more than Pune does (Rs 5.44 lakh). When tier-1 cities are also taken into account, Chandigarh offers the third highest average CTC per annum at the junior level, Rs 5.7 lakh, just behind Bengaluru (Rs 6.71 lakh) and Hyderabad (Rs 5.93 lakh). In fact, three tier-2 cities (Chandigarh, Thiruvananthapuram and Kochi) are among the top 10 cities for junior-level jobs.
At the mid level — that is, for those with 6-14 years of experience — Chandigarh (Rs 13.7 lakh per annum) and Thiruvananthapuram (Rs 13.44 lakh) lead among tier-2 cities, followed by Nagpur (Rs 12.71 lakh), Kochi (Rs 12.08 lakh) and Jaipur (Rs 12 lakh). Overall, Bengaluru is the best for mid-level jobs (Rs 18.06 lakh per annum), followed by Hyderabad (Rs 17.71 lakh), Mumbai (Rs 17.25 lakh), Pune (Rs 17.2 lakh) and Ahmedabad (Rs 16.73 lakh).
At the senior level, Bhubaneswar pays the most among tier-2 cities (Rs 31.15 lakh per annum), more than Hyderabad (Rs 29.78 lakh), Chennai (Rs 28.61 lakh) and Kolkata (Rs 28.58 lakh). Overall, Mumbai pays the most at the senior level (Rs 35.68 lakh), followed by Bengaluru (Rs 34.37 lakh), NCR (Rs 32.74 lakh) and Pune (Rs 32.29 lakh).
Across the board, there has been a significant jump in average salaries of the three job role hierarchies. On a national scale, the mid-level salaries are more than three times that of the junior levels (Rs 17.3 lakh and Rs 5.5 lakh, respectively), while the senior level salaries are close to twice that of the mid levels (Rs 32.5 lakh and Rs 17.3 lakh, respectively). This trend spans all locations, which shows that a high premium is placed on seniority of job levels.
Where’s the highest demand?
Advertising, marketing and public relations entered the top 6 industries list in 2021 — sixth in the junior- and mid-level roles, and third at the senior level.
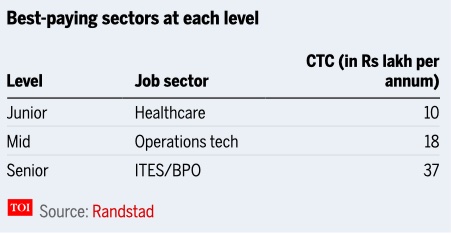
In salaries paid, professional services rank first in the mid-level (Rs 20.5 lakh) and second in both the junior and senior levels (Rs 6.2 and Rs 37.8 lakh). There is also a high demand for and premium placed on ITeS, professional services (emerged as a vital industry post-Covid) and advertising, marketing and PR industries. Average CTCs for senior professionals in these ‘top 3’ industries (Rs 39.4, Rs 37.8 and Rs 35.8 lakh) exceed the top average CTC for the same job level in tier-1 cities (Rs 35.7 lakh).
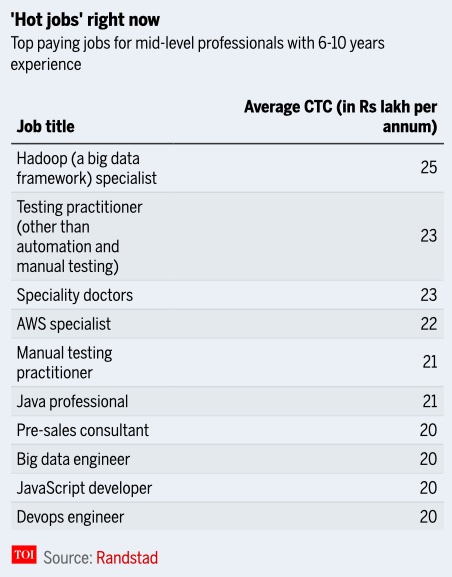
Among IT professionals with an experience of 6-10 years, Hadoop specialists (Rs 24.8 lakh), testing practitioners, other than manual and automation testing (Rs 22.9 lakh), and specialty doctors (Rs 22.5 lakh) feature as the ‘top 3’ hot-skilled professionals.
“While IT niche skills still occupy prime positions, specialty doctors occupy the third position among the ‘hot jobs’. Healthcare is poised to occupy a top-paying industry slot in the coming years, along with professional services, IT, and internet & e-commerce — and niche skilled professionals in these industries can look forward to a fulfilling future,” said Randstad India MD & CEO Viswanath P S. Function-wise, senior accounting professionals earn most in Bengaluru followed by NCR and Ahmedabad. In HR, payroll skills at senior levels are valued most in Mumbai, Kolkata and Ahmedabad, while in legal, regulatory affairs professionals are most paid in Ahmedabad in mid and senior (after Mumbai) levels.
A senior data analyst in banking, financial services and insurance (BFSI) is paid the most in Kolkata (Rs 20.4 lakh) while a senior investment banker in BFSI gets paid highest in Bengaluru (Rs 42.3 lakh). Kolkata is also the highest payer for architects (Rs 49.9 lakh) and civil engineers (Rs 39.5 lakh) at senior positions in the construction and infrastructure industry. Hyderabad is the highest payer for fashion/graphic/accessory designers at junior (Rs 5.9 lakh) and mid-levels (Rs 19.3 lakh) in FMCG & retail. Graphic designers in manufacturing are paid the highest in Kolkata across levels.
bbCould these jobs move to tier-2 cities?
Viswanath said that while the report reveals a significant jump across the board in average salaries of junior, mid- and senior-level professionals, the firm has also captured the emergence of tier-2 cities last year. “We firmly believe that they (tier-2 cities) are the future talent hubs and job-creation centres,” said Viswanath. Each city has its own set of factors pushing the trend. Vadodara, for instance. Randstad said with the increasing push being given for its real estate, healthcare and educational infrastructure, Vadodara should move up further in future. Or Bhubaneswar, where mining and steel manufacturing companies as well as the growing IT/ITeS sector are creating more opportunities and pushing up pay brackets. In Jaipur, Nagpur, Lucknow, Indore and Coimbatore, the variances (how much more or less than the standard) are higher at the junior and senior levels. This could be due to the predominance of non-IT industries in these cities, such as manufacturing, engineering and textiles, says the report.
Viswanath said, “Our conviction has been borne out by the fact that tier-2 cities have made great strides in salary levels due to a lot of investments in building excellent physical and social infrastructure. This is also a great indication of an exciting trend that is emerging — organisations have discovered the advantages of having a borderless, multi-faceted workforce that can deliver ‘anytime, anywhere’ work. So, we could say that work is seeking out talent in this new model, right up to tier-2 cities.”
Finance professionals: 2023
See graphic:
The salaries of finance professionals in India, Hong Kong and Singapore, presumably as in 2023
Freelance work
India vis-à-vis other countries
June 21, 2018: The Times of India

… presumably as in 2017
From: June 21, 2018: The Times of India
See graphic:
Freelancers in India spend more hours on a project than the global average but earn $2 less per hour as compared to the world average — and women freelancers here earn 11 per cent less than men…
… presumably as in 2017
Gender
Disparity in wages between male, female workers in rural India reduced
New Delhi: UPA’s flagship job guarantee scheme seems to have ensured better wages for women in rural India.
An NSSO survey report released earlier this week revealed that disparity in wages between male and female workers in rural India had reduced between 2004-05 when there was no national rural employment guarantee scheme and 2007-08 when the scheme was introduced by UPA-1. In 2007-08, rural women working in NREGA areas were getting 54% higher wages than casual women workers in urban areas. Wages in rural areas were less than those in urban areas earlier but NREGA has changed the norm.
The report pointed out that compared to an average daily wage of Rs 48.50 for a woman in urban areas, women enrolled under the NREGA scheme got Rs 79 every day in rural India. With the introduction of the scheme in rural India, the wage difference between men and women has also reduced. In urban India, where there is no job guarantee scheme, the disparity in wages between men and women have increased. Though the scheme ensures higher wages to workers, the NSSO survey highlights that the wages being given are still less than Rs 100 per day stipulated by the government.
As the survey was based on answers from respondents, it failed to provide reasons for the government failing to disburse the mandatory amount. Meanwhile, the report found that 92% of Indians were employed on a given day but finding work all year was still a challenge.
Lesser pay for equal work, against human dignity: SC
The Hindu, November 1, 2016
It is nothing short of “oppressive, suppressive and coercive” conduct by employers, says Bench
Terming the denial of equal pay for equal work to daily wagers, temporary, casual and contractual employees “exploitative enslavement,” the Supreme Court has held that they should be paid at par with regular employees doing the same job as them.
The Supreme Court called the various “fallacious” terms used by employers to classify and discriminate their employees as “artificial parameters to deny fruits of labour.”
Such classifications resulting in disparity and denial of the principle of “equal pay for equal work” is nothing short of “oppressive, suppressive and coercive” conduct by employers which is antithetical to the ideal of a Welfare State, a Bench of Justices J.S. Khehar and S.A. Bobde said in a judgment.
“An employee engaged for the same work cannot be paid less than another who performs the same duties and responsibilities. Certainly not in a Welfare State. Such an action besides being demeaning, strikes at the very foundation of human dignity,” the apex court held.
‘Involuntary subjugation’
The court stripped the layers of artificiality to expose how discrimination in pay affected the basic human dignity of an employee and amounted to “involuntary subjugation” to the will of the employer.
“Anyone who is compelled to work at a lesser wage does not do so voluntarily,” Justice Khehar, who authored the verdict for the Bench, observed.
“He does so to provide food and shelter to his family, at the cost of his self-respect and dignity, at the cost of his self-worth and at the cost of his integrity ... For, he knows that his dependants would suffer immensely if he does not accept the lesser wage,” the Supreme Court empathised with the condition of a helpless employee.
Citing that India has been a signatory since April 1979 to Article 7 of the International Covenant on Economic, Social and Cultural Rights of 1966, the Supreme Court observed that “any act of paying less wages, as compared to others similarly situated, constitutes an act of exploitative enslavement, emerging out of a domineering position.”
Minimum wages
2007-2019

From: Amit Anand Choudhary & Atul Mathur, Oct 18, 2019: The Times of India
See graphic:
Minimum wages in Delhi, 2007-2019
2016
Delhi is the highest
The Times of India, Aug 18 2016

The government cleared a proposal to increase minimum wages in Delhi, reinforcing its official status as the highest paying city in the country .
Once the revised wages are notified, an unskilled labourer in Delhi will get Rs 14,052--a little less than double of what a labourer in Haryana is entitled to. Trade unions and industrialists have opposed the decision, saying businesses will move to neighbouring states as cost of manufacturing will rise in Delhi.
While announcing the decision after a cabinet meeting, chief minister Arvind Kejriwal appealed to traders to support the move to improve living standards of the poor. “The minimum wage of unskilled labour has gone up from Rs 9,568 to Rs 14,052, for semi-skilled it has been revised from Rs 10,582 to Rs 15,471 and for skilled, from Rs 11,622 to Rs 17,033. This is around a 50% increase. This is also the highest increase in minimum wages across the country and I would appeal to Prime Minister Narendra Modi to implement a similar scale across India,“ he said.
The revision was recommended by a tripartite committee formed in April with employers, employees and government officials as its members. The committee submitted its report on August 4.
“The aam aadmi has been struggling to run their households and the most poor are the worst affected. It is the government's responsibility to look after them. The revision is a sound economic step as the model of development in place till now has failed. The rich has become richer but nothing has managed to trickle down to the lowest level of people,“ Kejriwal said, adding that the rise would ensure that more money reach the poor directly and, in turn, spur demand.
The CM will also write to the Centre to ask for an increase in eligibility for ESI and PF to Rs 21,000. “Unless this is done, nobody will benefit from the policy since while their salaries may go up, they will end up losing on benefits like PF,“ said Kejriwal.
Sources said the last time minimum wages were revised in Delhi was in 1994. There has been an increase in dearness allowance twice a year since then, based on the all-India consumer price index number.
Trader union representatives, who have threatened a Delhi bandh, will submit a memorandum to the CM on Friday and try to meet him.“We would not have a problem if the increment was 1015% but an almost 50% increment is too much. Delhi's minimum wages were already 30% higher than those in the neighbouring states. Now we will end up losing all our business to these states,“ said Brijesh Goyal, convener of AAP's Delhi trade wing.
However, the government has so far failed in implementing the norm. There is no mechanism to ensure that employers disburse the basic salaries and very rarely is action taken against offenders.Acknowledging it, Kejriwal said that while government employees would benefit immediately, the government will look into strengthening the monitoring of wages.
2017
From: The Times of India, May 17, 2017
See graphic:
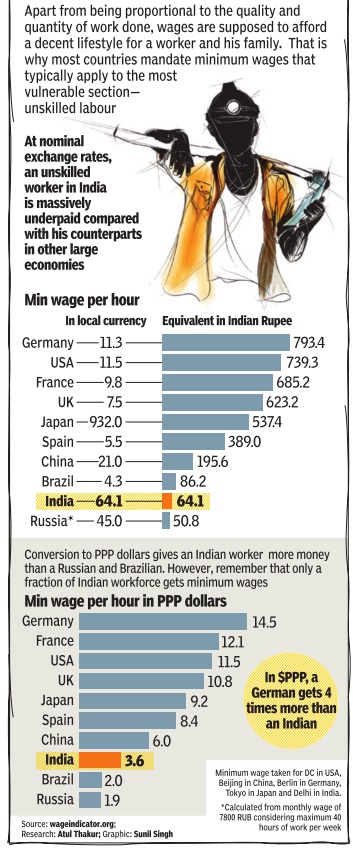
Minimum wage per hour in local currency, minimum wage per hour in PPP dollars, India and the world
2018: HC rejects Delhi government’s increase as unconstitutional
Aamir Khan2, HC junks AAP govt’s hike of minimum wages, August 5, 2018: The Times of India
Delhi high court set aside the decision of the Aam Aadmi Party government to revise the minimum wage for all classes. The court held that Delhi government’s notification of March 2017 on the matter was unconstitutional.
Wryly quoting from Lewis Carroll’s Alice in Wonderland, “The hurrier I go, the behinder I get”, the bench of acting chief justice Gita Mittal and justice C Hari Shankar noted that that the government had processed the notification in a similar manner, and said its “hurried action would set back the entire work force of the city”.
The bench held that the “non-application of mind” by the Minimum Wages Advisory Committee to the relevant considerations “offends Article 14 of the Constitution of India”. The court said the constitution of the committee itself was “flawed”. “Such a flawed committee gave a report that was not based on relevant material, denied fair representation to the employers well as the employees, in fact, without any effort even to gather relevant material and information,” the bench said.
As per the notification, the minimum wages for unskilled, semi-skilled and skilled labour were fixed at Rs 13,500, Rs 14,698 and Rs 16,182, respectively. Several pleas had been filed by industrial units and companies that employ workers on minimum wages.
The petitioner-employers, who had sought the setting aside of the government order, contended that the government had not heard them before taking the decision. In this regard, the court observed, “Any change in the prescribed rates of minimum wages is bound to impact both the industry and the workmen. The respondents were bound to meaningfully comply with the principles of natural justice especially, the principles of fair play and due process. The representatives of the employers had a legitimate expectation of being heard as the advice of the committee was to inevitably affect them, which has been denied to them before the decision to revise minimum wages was finalised.”
The state government later said it disagreed with the order. CM Arvind Kejriwal tweeted, “Itni mehangai mein humne mazdooron ka vetan badha kar unhe badi rahat di thi. Court ne hamare nirnay ko khaarij kar diya hai. Court ka aadesh padhkar hum aage ki ran niti tay karenge. Gareebon ko rahat dilwaane ke liye hum pratibadh hain.”
Labour minister Gopal Rai’s tweet said, “Gareebon ke liye jung jaari rahegi.”
The bench held that the ‘non-application of mind’ by the Minimum Wages Advisory Committee to the relevant considerations ‘offends Article 14 of the Constitution of India’
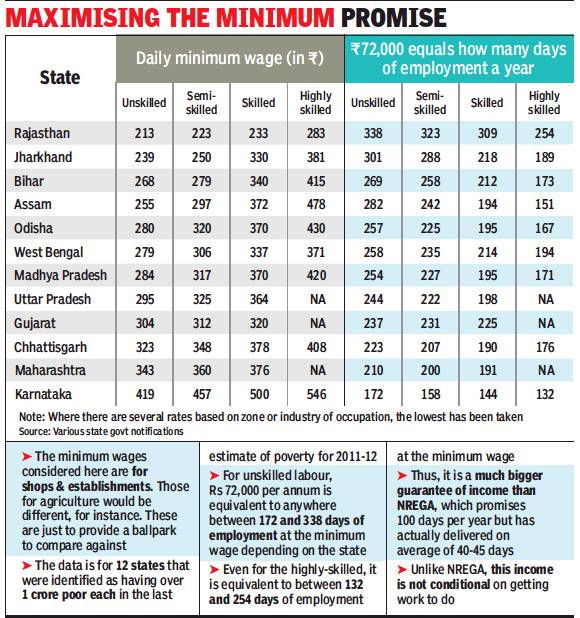
2019: in twelve states
Cong hopes dole will steal BJP’s Balakot thunder, March 26, 2019: The Times of India
From: Cong hopes dole will steal BJP’s Balakot thunder, March 26, 2019: The Times of India
Announcing its mega promise of the Rs 6,000 monthly dole to India’s poorest families, Congress sought to anticipate scepticism about the scheme’s viability and said the payout will not derail the country’s fiscal balance. “The entire calculations have been done. The fiscal repercussions have been analysed. This money is perfectly available. This scheme is perfectly doable,” Congress chief Rahul Gandhi said.
The party hopes the announcement will help reduce the focus on BJP’s high-decibel campaign after the Balakot airstrikes. Congress feels a discussion on jobs and farm distress can help the opposition while BJP’s “nationalism” plank dilutes the emphasis.
Having set off a debate on the viability of “right to minimum income” during a poll rally in January, Rahul provided “with pride” details on the proposed scheme which is an elaboration of the rights-based approach followed by UPA governments from 2004-14.
Refining the idea, in-house economists determined that the average income of the poorest households was Rs 6,000 a month even as they set a target income of Rs 12,000. As a result, the poll promise is that a Congress-led government will make a standard transfer of Rs 6,000 to each of the poorest 20% households in the country, which comes to 5 crore families covering 25 crore people. The scheme will be rolled out in two phases, starting with half of the poorest beneficiaries. Sources ex-FM P Chidambaram pegged its cost at Rs 1.8 lakh crore in the first year.
As per sources, Congress will promise that this income would be transferred to bank accounts of women heads of households. Interestingly, with Congress seeing “right to minimum income” being identified with Rahul, it has decided to call the scheme by its Hindi acronym “Nyay” (Nyuntam Aay Yojana). The concept was put forth by Rahul’s sister Priyanka Gandhi Vadra at a CWC meeting in Ahmedabad last month. “Nyay” in Hindi translates to justice.
With Nyay, Congress hopes to steer the debate towards welfarism which the party believes is its strong suit, having lost the narrative post-Balakot which helped BJP roll out “national security” as a campaign plank. After the CWC discussed Nyay along with the upcoming manifesto, Rahul addressed a presser where he used the scheme to paint PM Modiled BJP “anti-poor”. “If Modi can give money to the richest Indians, Congress can give money to the poorest,” he said.
…the five best, the five worst

From: July 5, 2019: The Times of India
See graphic:
The Minimum wage in twelve Indian states, presumably as in 2019
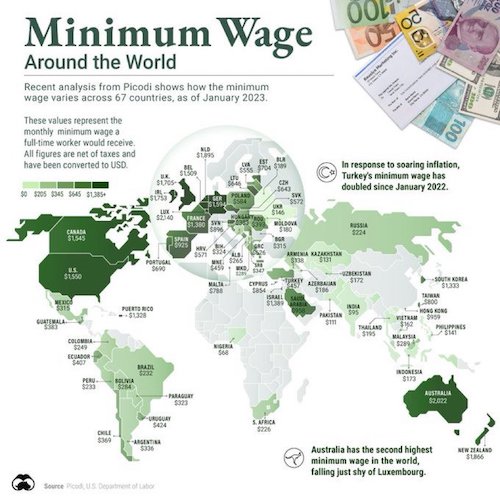
India and the world
2023
From: Twitter
See graphic:
Minimum monthly wages in India and the world, 2023
The monthly minimum wage in
India $95
Pakistan $111
USA: More than $1500
Legal measures
2016: Amendment to Payment of Wages Act 1936
The Hindu Business Line, December 23, 2016
As part of its plan to tide over a cash crisis on next pay day and prod people to use less cash, the Cabinet has approved an ordinance to amend the Payment of Wages Act 1936.
The ordinance seeks to amend Section 6 of the Act to allow for payment of wages under Rs. 18,000 a month not just by currency but also by cheque — against the present norm of the employer having to obtain the written consent of the employee before paying by cheque. On the face of it, the amendment, which was supposed to have been passed in the winter session, seems like a no-brainer in an age of modern banking and finance. The old law was obviously rooted in a context when payments were made in kind, and often not at all, in an economy governed by exploitative feudal relations; cash, by defining recompense in black and white terms, was a liberating force. Today, the wheel has come full circle. Civil society forces have, for some time, demanded cheque or ECS transfer to ensure transparency in terms of wages paid, the identity of the employer or contractor, and the number of employees under him. This may also check frauds related to ESI and EPF; workers under the NREGA stand to gain. However, the recent move is not without troubling features.
The amendment, like most post-November 8 (Demonetisation of high value currency- 1946, 1978, 2016: India) injunctions, places unreasonable curbs on individual choice and, by extension, transfers a disturbing degree of power to the state. It gives the Centre and States the discretion to “specify the industrial establishment” where the employer shall pay “the wages only (emphasis added) by cheque or by crediting the wages in his bank account”. This ironically opens up scope for bribery amidst the drive against black money.
Creating a financially prepared populace goes beyond opening crores of Jan Dhan accounts. On the technology side, it involves setting up an internet and cyber security backbone. Above all, our illiterate or semi-literate millions need both training and time to negotiate a cashless world on their terms.
Profits vis-à-vis wages
2001-19

From: February 2, 2020: The Times of India
See graphic:
Corporate Profits in India vis-à-vis wages, 2001-19
Rural wages, poverty, nutrition
2011-12: Rural wages, nutrition rise
Poverty declines
Rising rural wage may boost UPA’s chances
Swaminathan S Anklesaria Aiyar
The Times of India 2013/07/07
For all the current gloom about the economy, the 2011-12 data on employment and consumption shows a remarkable one-third increase in average household consumption over two years, well above the rate of inflation.
Four trends stand out. First, poverty is falling sharply. Second, wages are rising impressively. Third, people are shifting from cereals to superior foods. Fourth, contrary to popular perception, the employment guarantee scheme (MNREGA) has not been the key driver of higher wages.
Poverty ratio
The government has not yet provided a firm figure for the poverty ratio in 2011-12 compared with the last survey in 2009-10. But estimates from limited data suggest that the poverty ratio has fallen from 29.8% to just 24-26%. Earlier, poverty was falling by 0.75 % per year. This may have accelerated to 2% per year.
Wages
The most comprehensive consumption measure shows rural monthly spending per capita up from Rs 1,053 to Rs 1,430. For rural casual labour, other than in public works, male wages rose from Rs 102 to Rs 149, and female wages from Rs 69 to Rs 102. Urban trends were similar. Remarkably, casual wages grew faster than average national consumption: the poor fared disproportionately well. However, female wages grew more slowly than male wages.
Surprisingly, higher wages did not attract more people into the workforce. Over the two years, the male rural workforce increased by only 2.7 million, while the female rural workforce actually declined by 2.7 million. The unemployment rate rose slightly from 2.0% to 2.2%, but both rates are very low. The biggest problem is not lack of jobs but lack of workers. The optimistic explanation is that millions of youngsters have chosen to study instead of working. The pessimistic explanation is that women find work conditions unsafe or unsuitable.
Are machines causing unemployment?
Some analysts fear that rural women are being displaced by growing mechanization. Punjab farmers are switching to mechanical rice transplanters, and combine harvesters are spreading even in Bihar. But rural wages are rising sharply, contradicting the theory that machines are causing unemployment. Rather, the scarcity of labour is forcing farmers to mechanize. We need more research to explain the abysmally low participation of women in the workforce, down from almost 30% in 2004 to just 22% today.
Female participation
In urban areas, female participation is a pathetic 15%. For this to happen at a time of sharply rising wages — which should normally attract more women to work — is a huge unsolved puzzle. MNREGA is targeted at women, yet rural female participation has plummeted.
Food consumption patterns
Food consumption patterns have been changing dramatically. Between 1993-94 and 2011-12, the share of cereals in consumption halved from 24.2% to 12% in rural areas, and from 14% to 7.3% in urban areas. The share of non-food items shot up from 36.8% to 51.4% in rural areas, showing growing prosperity. Rural folk have shifted to superior foods. What’s up is the share of beverages, eggs, fish, meat, fruit and nuts.
Clearly, Indians as a whole have more than enough cereals and are moving to superior foods and consumer durables and services. The shift is evident in all income groups. The Food Security Bill aims to expand subsidized cereal supply from 40% of the population to 67%. Clearly this is a middle-class giveaway, unrelated to food security.
In 2004, only 2% of Indians said they were hungry any time of year. These are the people needing food security, not the middle-class. However, while hunger is limited, malnutrition is widespread. People need additional iron, vitamins and proteins. But the Food Security Bill targets only cereals.
MNREGA
In its initial years, MNREGA typically paid higher wages than the minimum wage. Indeed, many states raised their minimum wage rate sharply on finding that the Centre would foot the MNREGA bill.
Earlier, when states raised the minimum wage for political reasons, market rates did not move at all. Farmers dismissed the minimum wage as a gimmick. But today, market rates for casual labour have risen well above MNREGA rates. In 2011-12, MNREGA paid on average Rs 112 to males and Rs 102 to females. This was well below the open market rural wage of Rs 149 per days for males, and marginally below the rate of Rs 103 for females. The main reason seems to be fast GDP growth for a decade. All Asian miracle economies achieved rising wages through fast GDP growth, not employment schemes. India seems no different.
Manual labour: Rural
Jul 04 2015
51% of village homes live on manual casual labour
Nearly a quarter of rural families in India don't have a literate adult above 25 years. Nearly onethird are landless, and half derive their income mainly from manual labour. Above all, nearly half of rural Indian households can be considered “poor“ in the sense of facing some deprivation. These are findings of the “socio-economic caste census“ (SECC) that has, for the first time, mapped rural India in such minute detail, from the nature of houses families live in to their occupations, what assets they own and the number of beggars and ragpickers. The findings paint a much more bleak picture than official poverty figures normally do.
The crucial finding of the census is that 8.69 crore of the 17.91 crore rural households show one of the seven markers of deprivation listed by the SECC -households with kuccha house, no adult member in working age, households headed by a female with no working age male member, those with handicapped members and no able-bodied adult, households with no literate adult above 25 years, landless households engaged in manual labour, and SCST households.
It means 49% of rural India shows signs of poverty even if the depth of poverty is not enough to categorise them as poor in the technical sense. The survey , released by finance minister Arun Jaitley four years after it was commissioned by the UPA government and conducted across 640 districts and 17.91 crore rural households, constitutes a crucial step towards better targeting of welfare schemes based on the needs of each family .
Like, the 2.37 crore households that have been found to have “one room or less and kuccha walls and roof “ would be the first claimants for any “rural housing“ scheme. The survey has also collected the caste details of each family , but data on this aspect was not released.
Traditionally , a family should have a certain degree of poverty to qualify as poor, like a household should be saddled with at least two or three of the seven deprivation indicators listed by the SECC.
A socially significant discovery , or confirmation, is that 21.5% of rural households belong to SCs and STs. They stand at 3.86 crore households.
Given that the survey has scanned rural poverty to its micro details of what each household lacks, Arun Jaitley said, “It's after seven-eight decades that we have this document after 1932 of the caste census... It's going to be a very important document for all policymakers both at Central and state governments... this document will help us target groups for support in terms of policy planning.“
One of the interesting bits of the findings are the source of rural household incomes.Nearly 30% are engaged in cultivation, while 51% of families are eking out a livelihood from manual casual labour. On the other hand, the service class -government, public and private sector -constitutes just 14%.
See also
Farm loans and their 'waivers': India
Income Distribution: South Asia
Religion-wise demographics: India, after 2001
Wages, salaries: India
