Bhavnagar State census: Distribution And Movement Of The Population
This article has been extracted from DELHI: MANAGER OF PUBLICATIONS |
NOTE: While reading please keep in mind that all articles in this series have been scanned from a book. Invariably, some words get garbled during Optical Recognition. Besides, paragraphs get rearranged or omitted and/ or footnotes get inserted into the main text of the article, interrupting the flow. As an unfunded, volunteer effort we cannot do better than this.
Readers who spot errors in this article and want to aid our efforts might like to copy the somewhat garbled text of this series of articles on an MS Word (or other word processing) file, correct the mistakes and send the corrected file to our Facebook page [Indpaedia.com]
Secondly, kindly ignore all references to page numbers, because they refer to the physical, printed book.
Contents |
Distribution And Movement Of The Population
The territories of the State of Bha vnagar lie at the head and west side or the Gulf of Cambay in the Peninsula of Kathiawar, though a few outlying villages are situated in the Dhandhuka Taluka of the Ahmedabad Collectorate. The State does not present a compact appearance, interspersed as it is with the foreign territories of the States of Palitana and Wala, and the British Taluka of Gogha. This is due to the historical antecedents of the State which have mainly contributed to the raising of the small Gohel principality of Sihorinto the present State of Bhavnagar, by additions made to it from time to time by the brave and_ enterprising predecessors of the present ruler. The anarchy and misrule prevalent on the eve of the dissolution of the Great Mughal Empire fired Bhavsinhji I with an ambition to secure a suitable venue for the extension of his existing kingdom, and found the present capital of Bhavnagar in the year 1723. At that time the British had already appeared on the scene, and the hold of the Peshwa and the Gaekwar on Saurashtra was loosening. The time that followed proved greatly opportune for the realisation by Wakhatsinhji and Wajesinhji of the dream of the modem Bhavnagar cherished by Bhavsinhji I. They extended and consolidated their kingdom and brought it to its present dimensions, by defeating the neighbouring chiefs and subduing the turbulent Khasias and Khuman Kathiswhose territories they conquered. Since then the area of the State has undergone very little change of noticeable importance.
2. Area and Boundaries.-The State lies between 21"18' and 22'18'north latitude and 71°15' and 72°18' east longitude. It has been cadastrally surveyed, and according to the Revision Survey recently completed, the total area of the State is recorded to be 2,961 square miles which shows -an increase of 101 square miles upon the area as shown.,.at the last Census. The Bhavnagar State. is bounded on the north by the Ranpur parganah under the Ahmedabad Dlstnct and by the Jhalawar and Paneha! Sub-divisions of the Peninsula' on thesouth by the Arabian Sea; on the east by the Gulf of Cam bay and a po;tion of the Dhandhuka Taluka; and on the west by the Sorath Kathiawar and Halar sub-divisions. The Separate Jurisdiction villages are al~ scattered over the territory of the State.
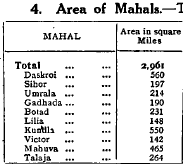
3. Administrative DivisioDS.-For the purposes of revenue administration, this State is divided into two Divisions, 'Viz., Northern and Southern, each •comprising of five Mahals or districts. The Mahals are further sub-divided into Tappas which are groups of villages of convenient size. The Mahals of Daskroi, .Sihor, Botad, Gadhada, and U mrala constitute the Northern, and those of Lilia, Kundla, Victor, Mahuva, and Talaja the Southern Division of the State. As far back as 1881, the State consisted of nine Mahals only, when the Mahal of Victor was for the first time brought into being and constituted into a separate Mahal, 'with the Rajula and Dungar Tappas of the Mahuva Mahal. Another important •change was the transfer in 1918 of the twelve villages of Daskroi to the Mahal of Talaja, which with the addition of other few villages of the latter Mahal formed under it the separate Tappa of Trapaj. A new Tappa of Bhandaria was consti• tuted in the place of the Trapaj Tappa thus transferred to Talaja by taking a few villages of the old Trapaj Tappa and some others from. the Bhumbhali Tappa. In the year 1923, the villages of Rajapara and Sakhadasar of the Daskroi Mahal 'were also transferred to the Trapaj Tappa of the Talaja Mahal. The changes thus effected from time to time have had a corresponding effect upon the area and population of the Mahals and Tappas concerned. Adjustments have, there• fore, been made in the figures of population of the preceding Censuses as' shown in Imperial Tables II and XX and State Table I on the basis of the area, as it 'stood on the 26th February 1931. As has been already noticed in the Introduction, a significant departure has been made from the practice of the previous 'Censuses of giving figures only for the State as a whole in that a special recogni. tion has been accorded to the City of Bhavnagar and also to the Mahals in •certain iinportant tables where they have been taken as a unit. 4. Area of Mahals.-The marginal table gives the figures of area of the ten Mahals of the State. From the point of area, the Mahal of Daskroi enjoys the first place with an area of 560 square miles. Next come the Mahals of Kundla and Mahuva whose respective areas are 550 and 465 square miles j Lilia and Victor are the smallest of the State Mahals, and have an area of 148 and 142 square miles respectively •
divided a State or Province into Natural Divisions consisting of tracts in which the
'natural features are more or less homogeneous .. Such an attempt in the case of
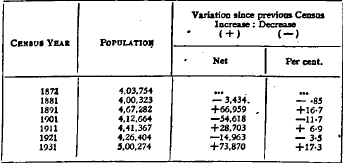
.-a State of the size of Bhavnagar is hardly of any practical utility. Bhavnagar
'State itself forms a part of a greater natural division of the country styled as
Kathiawar. Be~ides, the advantage of having natural divisions has been more
-than once questIoned, as in actual practice the figures are more particularly
required by administrative divisions rather than by natural divisions. Divisions
'of this kind ate hardly scientific and are still less suited to a comparatively smaller
'state as this. '. Such an attempt has, therefore, been abandoned. It may,
however, be noted here that in dealing with larger areas, the scheme must be
regarded to possess some value where people are bound together by ties of language
and sentiment. Natural divisions are also useful in explaining the variation in
.density at different places resulting from the differences of climate, rainfall, and
.soil. But in the case of the Bhavnagar State where the differences of language
. and sentiment are non-existent, and where the divergence in climate and soil is
not very great except in a few places, the creation of natura.l divisions should
'-Safely be dropped. An attempt in this direction will, however, suggest the divi.
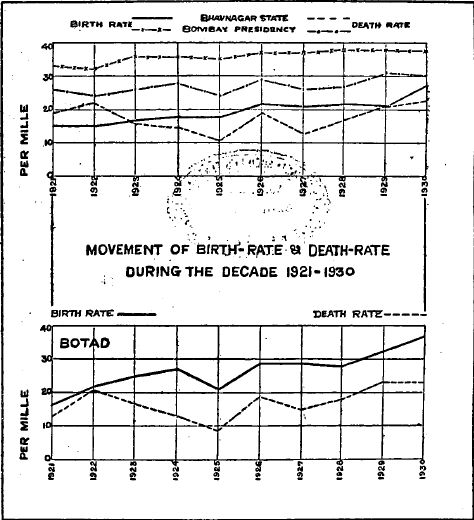
sion of the State into the Kharopat, Kanthal Non-Kanthal and Bhal. The
Kharopat will include the Mahal of Lilia, and the Jira and Kundla Tappas of the
Kundla Mahalj whereas the Kanthal will include the Coastal Mahals of Mahuva
.and Talaja, and some portion of the Daskroi Mahal. The Bhal will be a
,separate division by itself owing to its physical peculiarities. The remainder
.portion of land may be conveniently called the Non.Kanthal ..
6. Definition of .. Population."-Before undertaking a statistical an.alysis.
of the fii,'lJres of population as .returned by the .Census, a.clear understandmg of
the term • population' as used In the Census hterature IS necessary. By. thepopulation
of the Bhavnagar State is meant all pe.rsoos.en!lmerated on th~ DI~ht
of the 26th February 1931, as being present and ahve within th~ State te!n~or1es,
persons travelling by railway and enumerated at the stati~os SItuated wlthm the•
boundary of the State and persons on board the vessels In Bhavnagar watersincluding
those for ~hom the schedules were received from the Port Supervisor
upto the 15th March 1931. The aggregate of the population thus recorded is the
actual or de facto population of the State ~ ?istinguished from its. ~e jur~ C?r
normal resident population. The former will mclude ~rsons not resl~mg wlthm
the State territories and exclude some of the normal residents who will be enu••
merated outside the State.
The Indian Census is a synchronous Census, and aims at enumerating: all the persons wherever found at a particular time on a particular day. The• hours between 7 p. m. and midnight have been conveniently chosen for the' purpose. Every precaution is taken to enumerate all living human beings,. wherever found, whether in houses numbered for the purpose, or• outside the houses on roads, railways,steamers, as well as the vagrants in the streets for whose enumeration special arrangements are made. By a judicious selection of the• Census Night, the least possible fluctuation in 'the movement of population is. secured. In India, the month of February or March corresponding to the Hindu month of Falgun is generally selected. For, it is the part of the year when nogreat assemblages and religious fairs are held, and celebration of marriages is. prohibited among the Hindus.
The de jure population is the population normally residing in a locality~. In India, the population as recorded at the preliminary enumeration will roughly supply figures of the de jure population of the State. For, only the population. living in houses which correspond to so many' commensal families' is enumerated' at the first count which takes no notice of the tempbtary sojourners and the travelling public.
The basis of clasSification of population differs in different countries~ England and France have the same basis of classification as India. What is. called de facto in India is in France known as II la population de fait". Popula. tion de jllre is equivalent to II la population de droit" which includes all persons usually resident in an area including those temporarily absent, and excluding those only momentarily present. There is' also a third division, viz., lila popula. tion municipale" which the French. have adopted. It means II la population de droit" minus prisoners, hospital patients, scholars, residents in schools, members. of convents, the army and so on. The United States of America have a threefold classification, viz., the II Constitutional population" which excludes residents in Indian Reservations, the Territories and the District of Columbia' the II general' population" which includes in addition the territories' and the ~. total population," which includes all excluded in the former.' • A synchronou.s Ce~sus with !ts double classification of the population intI> dll la~to and de JU~6 IS ~t SUited to Indian conditions for its simplicity in enumerattng the people mhablting such a vast continent.
7. ~ccuracy of Census Figures.-Mter this preliminary discussion as. to the meantng of the term 'population' some estimate of the degree of accuracy of the. Censu~ figures may well be made. Doubts are not unfrequently expressed regardtng their correctness ~nd accuracy. In such a complex business as the. Censl;ls. absol?te accu~cy IS to be found nowhere in this world. It must always. remrun as an Ideal w.hl.ch eyery Census worker should try his best to attain with. 0!l~ completely attammg It. Because an ideal Census presupposes that every ~Itizen of the State understands his civic responsibility and will try to see that he IS properly enumerated. On the other hand, every Census official will , in hi!> 1. Prof. Bowley, B~n" oj Stah~tics. p.25.
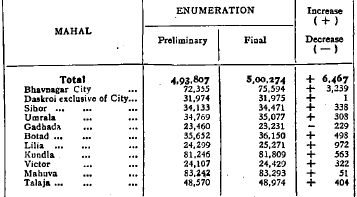
turn, fulfil bis duty, and leave no stone unturned to' secure this state of ideal perfection. But as human nature varies from place to place and from one individual, to another, this is never to be hoped for. Errors and omissions are, therefore, bound to occur. Cases of persons left out from enumeration as also of persons enumerated twice over, not to talk of the cases of inexact entries, will always occur. But this is inevitable and cannot be helped. \Vhat is, therefore, necessary is to take such precautions and devise such safeguards as will reduce the resulting mistakes to a minimum. The extent to which they are put into practice will determine the degree of accuracy achieved. So far as the present Census is concerned it may with all modesty be asserted that both from the point of numbers and details, it is better placed than any of its predecessors. And this opinion has been shared by not a few responsible State officials and public men who have been kind enough to point out the comparative superiority of the present Census. Various factors have contributed to this success. , Deterrent punishment of the indolent workers coupled with substantial encouragement given to the deserving in the shape of cash rewards to the extent of nearly Rs. 1,500 had a very wholesome effect in improving the existing machinery of enumeration. It put the workers on their mettle and induced them to show better work. Proper instructions supplemented by exten' sive checking and inspection exercised by the supervising Census oflicials greatly improved the recording of the entries in the enumeration books. It must, however, be admitted that there must have been persons who will not have been enumerated at all and who must be offset against those enumerated twice. The resulting error will indeed be very small, almost negligible, as it is spread over large numbers. So from the point of numbers, the present Census may be credited with the fairest degree of accuracy without the slightest hesitation. Omissions are likely to occur in the case of the public travelling by rail and steamer. And they will vary from station to station according to the arrangements made to enumerate the passengers at the platform, and on the running trains, and vessels in the harbour. It is unnecessary to enter here into useless details about the precautions taken in this behalf, and already mentioned in the Administrative Report. Suffice it, therefore, to say that the hearty co•operation of the Railway authorities was of great help in eliminating all probable errors which can be judged from the fact that as many as 1,752 persons were enumerated on the railway platforms, running trains, and boats. From the point of details, this Census has' been more comprehensive than any of its predecessors. And yet there is left much to be desired by way of making the entries recorded perfect, especially in entering the details regarding the occupational columns which is the stumbling block of the Census in almost all the countries of the world. Some of the important details are, therefore, lacking, -leaving ample scope for the intelligent guesses of the Abstraction Office. But this ,can be only remedied by a proper understanding of the scheme of enumeration which cannot be ensured so long as the great mass of the people is uneducated ' and the available enumerators in rural areas are not sufficiently trained. Any short-coming, therefore, that is likely to manifest itself will be rather in the direction of under•estimation than that of over-estimation. Attention will, from time to time, be invited to the value to be attached to the various sets of figures at the commencement of each Chapter. There is, however, one point of great significance about the Census figures ,of 1931. The No-tax campaign and the Civil Disobedience Movement started by Mr. Gandhi on the 12th March 1930 were going on in British India, until the Delhi Pact was signed on the 5th March 1931. The multifarious boycott activities -ofthe Indian National Congres saw in the Census a fresh venue for obstructing the Government. The Census officials in some places in British India were handicapped in their work by the refusal of some persons to volunteer the information required to be entered in the schedules. But fortunately that was not the -case with the Indian States. The Census returns of this State are, therefore, wholly unaffected' by the boycott movement. One stray case of refusing' AN ESTIMATE OF THE NORMAL POpULATION 5 information, however, occurred in the City of Bhavnagar, but such an exception goes to prove the general success of the present Census. 8. An Estimate of the Normal PopulatioD.-The total or actual population of the State as registered at the, present Census is 5,00,274 persons of which 2,57,156 are males and 2,43,118 females. T~e enumeration books record places of birth, but not the places of normal residence, and therefore, afford no clue to the normal resident population of the State. But an estimate of the normal population as distinguished from ~he. total popula~on recorded on the Census Night can be had from the prehmmary enumeration. Because the latter takes notice only of the permanent population living in houses situated within a locality. The running and floating population and the outsiders who are in the State at the time of the preliminary enumeration are not entered in the schedules. The preliminary enumeration which records only the de jure population may be regarded to make a closer approximation to the normal resident population of the State which comes to 4,93,807 persons of which 2,54,598 are malcs and 2 39,209 females. The figures on the margin show the difference between thc two' sets of figures, and represent 'the fluctuation in the population during the interim period. Out of a total increase of 6,467 persons, as many as 3,239 are absorbed by the City of Bhavnagar. Apart from its urban characteristic the temporary flow of immigration to the ,capital of the State at the works going on in connection with the Investiture MAHAL Total
of His Highness the Maharaja Saheb is in no small degree responsible for the swelling of the City population. Fluctuations are more frequent in urban than in rural areas; and this will be seen from an increase of only one person in the preli!"ina~y populatio~ of the Daskroi Mahal excluding. the City of Bhavnagar. But 10 thiS as well as In nearly all the other Mahals the Increase is partially due to the return home of some of the normal residents from the neighbouring States where they.had gone out on wedding parties at the time when the preliminary record was m progress. The solitary exception to this rule of increase is furnished by the Gadhada Mahal where the same cause seems to have operated in an opposite direction. I 9. Area and Population.-The present Census registers a total of MAHAL
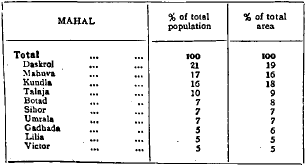
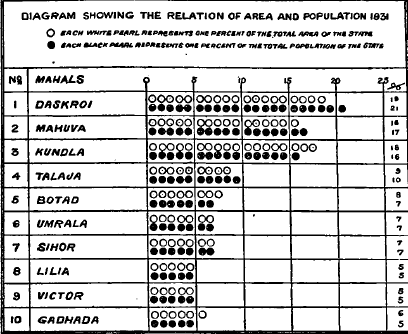
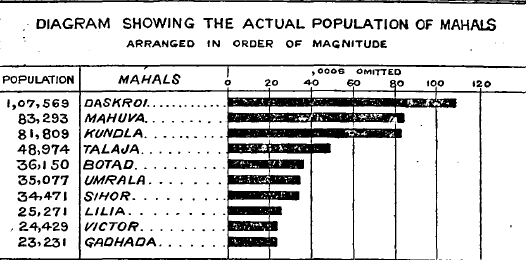
5,00,274 souls. The marginal table shows the figures of percentage distribution of area and population of the State in each of its ten Mahals' arranged in order of, magnitude. A diagram showing the relation between the area and population of the Mahals is also given "below. Each white pearl represents one per.; th Stat d h ,cent. of the total area of e e, an eac black pearl represents one per cent. of the total population. "
10. More than half the area and population of the State are contained. in the MalIals of Daskroi, Kundla, and Mahuva. More than 15 per cent. of the total population live in the City of Bhavnagar including which the Mahal of Daskroi appropriates to itself 21 per cent. of the total population. The Mahals of Kundla and Mahuva have respectively 16 and 17; Talaja 10; Botad, Umra1a~ and Sihor each 7; and Lilia and Victor each 5 per cent. of the total population. No great divergence between the percentage distribution of area and population of the Mahals is noticed; and they follow practically the same order with this difference that from the point of area Kundla takes precedence over Mahuva. The Mahals of the State with the exception of Daskroi and Talaja can be con• veniently arranged in three groups of three sizes each having Mahals with very nearly the same area and population. MalIuva and Kundla each with nearly 17 per cent. of the total area and population will fall in the !Jrst group; Botad,. Sihor and Umrala with 7 per cent. in the second; and Gadbada with 6 and . Lili<J. and Victor each with 5 in the third
MOVEMENT OF THE POPULATION
11. Meaning of Movement.-By the movement of population is meant the changes in the population of a unit area of land from Census to Census. The term movement is not used, in the sense of physical movement denoting the migration of people from one place to another and 'CIice versa. The latter 'will; however, form the subject matter of a later chapter relating to Birth, place.•
12. Changes Since 1872.-The first synchronous Census of the Bhavnagar State was taken with the first Imperial Census in 1872. The marginal table illustrates that the history of the Bhavnagar State Census has been one of alternate increase and decrease in its population. The 1891, 1911, and 1931 'Censu~ are the Censuses of increase, whereas those of 1881, 1901, and 1921 •are the Censuses of decrease in the State pgpulation. The movement of THE PERIOD 1812-1911 7 population has been more or less uniform throughont all the MahaIs of the State. With some minor exceptions, an increase or decrease in the population of the State has been invariably accom• panied by a correspondi ng increase or .decrease in the popu• lation of its Mahala.
13. The popu• 1931 5.00,274 +73.870 +17•3 lation of the State of Bhavnagar as it stood at the commencement of the Census era, i.e., in 1872 was 4,03,754 persons of which 2 13 57l were males and 1,90,183 females. With the periods of alternate rise and' fa'IJ it has at the present Census stood at 5,00,274, giving a net increase of '96 520 persons or 23'9 per cent. during the last 59 years. Taking the figures for 'the last fifty years, the rise is nearly one lac or 25 per cent. There has thus been an average increase of 16,000 souls or 4 per cent. from -Census to Census.
14. The Period 1872-1911.-The movement of the population of the -State will now be considered in the light of the conditions prevailing during the period 1872-1911. It may be asked: to wbat then is the variation in the popula. tion of an area due? It results from the natural growth or otherwise of the population by an increase or decrease of births over deaths which is due to various causes i from a favourable or unfavourable balance due to an excess or deficit of immigrants over emigrants i from better enumeration i and lastly from changes in its boundaries. As regards the last mentionetl' factor, it may be briefly stated that since the inception of the Census era, there has been very little change in the boundaries of the State involving an increase or decrease in its population. They have practically remained the same, the Revision Survey being responsible for an increase of 101 square miles in its area. Regarding the accuracy of enumeration, it may be noted that the first two Censuses of 1872 and 1881 must have suffered from want of proper enumeration, as the complex machinery of the Census in its present form was for the first time then set up in the State. and also because the people being new to the Census idea may not have intelli. gently co-operated in, if not actually opposed to the Census operations. Some time must have. therefore. elapsed before it got into perfect working order. The records of these two Censuses must have naturally suffered, as in the case of the rest of India, from under•enumeration. But since the Census Report of the State comes to be written for the first time on this occasion, it is hardly possible to dip into the past to gauge the extent of this affection. By 1891, as elsewhere, this State also got used to the working of the Census machinery i and as will be seen from the returns of that year, omissions were reduced to a minimum.
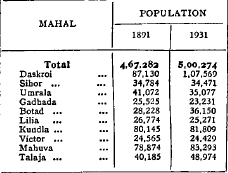
15. The rise and fall in the State population and their causes wil( now' be discussed. The decrease of -85 per cent. revealed at the Census of .1881 was due to the famine of 1878. 'But the decade 1881-91 was a period of rapid rise . and recovery. It has been generally observed that birth•rate rises rapidly after a period of heavy mortality due to war, disease or famine. Famine mortality is high among the very young and the very old; and so when a period of famine is followed by ~)De ~f plentiful rai!lfall an~ good crops as was~ case during 1881.91, the populatIOn IDcre~ses rapidly owmg to an unusu~lly high proportion of persons at reproductive ages. The movement of population received a great . momentum aDd registered an increase of 16•7 per cent. in 1891 upon the popula8 CHAPTER I-DISTRIBUTION AND MOVEMENT OF THE POPULA nON tion as returned in 1881 (4,00,323). The increase was alround. The solitary exception to this tendency was, however, noticeable in the Mahal of Botad which recorded a decrease of 1,714 persons. But this decline is not at all convincina at a time when the whole of the State in general, and each of its Mahals in particular showed. such an extraordinary onward movement. It can be attributed only to inaccuracy in enumeration. No other intercensal period except the present registers such a high percentage of increase in the State population. The truth of this remark is horne out by examining the comparative figures of the population of the Mahals as it stood in 1891 and 1931. The marginal statement illustrates the unprecedented character of the 1891 Census, and points out• that even with the impetus given to the growth of numbers during the last intercensal period, the Mahals of Sihor and Victor have with difficulty succeeded in attaining their 1891 level, whereas the Mahals of Gadhada, U mrala, and Lilia are still lagging behind. But this spell of prosperity did not last long. On the close of the decennium that followed the Census of 1891, the Great Famine of 1900 popu-
. larly known as the 'Chhapania,' notorious for the intense misery and irreparable loss it caused to' humanity made its appearance. It came as a great calamity and laid low the whole mass of population. History seems to repeat itself in every sphere of human life, and . a period of heavy decrease followed a period of heavy increase. There was a decrease in the popUlation of all the Mahals of the State without a single exception. An increase of 16'6 per cent. was followed by a decrease of nearly 12 per cent. But much of the ground lost in 1901 was recovered at the Census of 1911, owing to the favourable aaricultural conditions which prevailed during the greater part of the dece~nium that followed the Big Famine. The damage that was wrought was indeed far too widespread and intense for the loss and suffering involved to be made up during the course of a single decade. Yet nearly half the loss sustained in 1900 was recuperated notwithstanding the ravages of plague which continued in milder' form from 1905 to 1908, and a rise of 6'9 per cent. was the result. But this rise was absent in the Mahal of Sihor which showed a negligible decrease of 232 souls.
16. Condition of the Period 1911-21.-The Census of 1921 pre• cedes the decennium which is the subject matter of this Report,and should, therefore, be reviewed in some detail. It is the Census of decreasing returns, and registers a fall of 3'5 per cent. or 14,963 souls in the population of the State as it stood in 1911. Much of the progress made at the last Census was set at naught by the combined effects of a famine followed by plague and influenza epidemics. But they have not affected the Mahal of Talaja and the flourishing. Mahal of Botad which seem to have resolved to make up for their past arrears. All seemed to go on well upto the year 1917, and the natural population was increasing under the influence of favourable agricultural and economic conditions. But suddenly the failure of crops was followed by plague, and before it had disappeared, the monster of influenza raised its head, sweeping away a large number of the population of reproductive ages. Both these pests exacted a heavy toll all over the State, and were mainly responsible for the reduction of population. There were other contributory causes also. It was a period of great panic and uneasiness. The World 'War was raging on the European battle-fields from 1914-19. The prices had gone enormously high; years were lean; and living had become dear. These then were not the times which would encourage any growth of population. To this should be added the effect of the• migratory currents set into motion by the great impetus given by the war to the,
Indian trade and commerce. The artificial prosperity of the war time that had seized the Indian trading and commercial centres and the boom period that followed it, attracted the enterprising Bhavnagaris to the cities like Bombay and Ahmedabad. This outward flow of the State population accounts to no mean degree for the decline in the movement of population noticed in 192].
THE PAST DECENNIUM 1921-30
17. Changes prior to 1921 have been disposed of. The agricultural, industrial, and the general physical conditions obtaining during the decade under report will now be dealt with, in order that some idea can be had of the causes that have promoted the growth of numbers during the past ten years.
18. Condition of Agriculture.-A description of the agricultural condition during the past decennium must involve a discussion of the physical condition and other problems that directly influence the extension, development and normal progress of the cultivation of the soil, as also of the incidents that in. directly contribute to the well.being and amelioration of the agriculturist by improving and bettering his economic condition. Among the first will be considered such questions as the land under cultivation, proportion of cultivat. ed land to cultivable land, land under irrigation, the proportion of land onder different kinds of crops, and rainfall. Among the second will be considered the effects of such measures as credit c().()perative societies, and the Khedut Debt Redemption Scheme.
19. Land under Cultivation.-With a negligible variation the lanel under cultivation during 1921-31 practically remained the same. A slight increase during 1925, raised the acreage for that year to 7,40,219. The following are the figures of Darbari proper and Barkhali land in acres' for the year 1930:- .
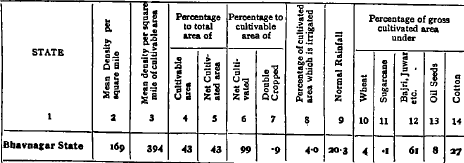
20. Crops.-The Subsidiary Table gives figures of the mean density
per square mile of the total and cultivable area. The percen~es of cultivable
. and net cultivated area to the total are also shown. By gross cultivated'
pr total area sown or cropped is meant the net cultivated land plus the area
which is do.uble cropped. Thus by adding 7,796 acres which are double cropped
to 8,12,322 of netcultivated area, the figure of8, 20,118 acres under gross
cultivation is arrived. By' net cultivated' area is meant the gross cultivated
area minus the double cropped. During the year 1930, bajri, juwar and
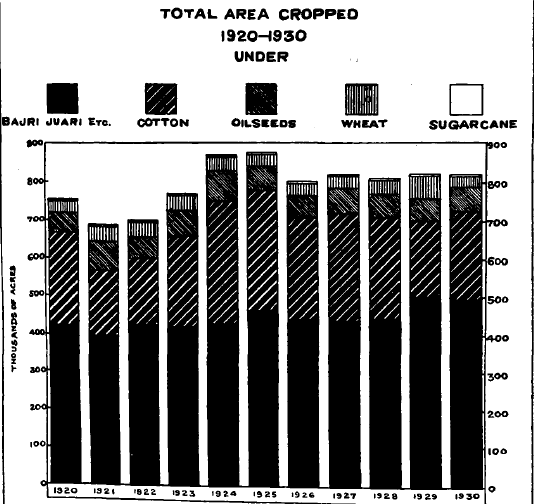
other staple food stuffs were grown in 61 per cent. of the gross cultivated
area. Of the other produce, cotton came highest with 27 per cent., whereas
oilseeds, wheat and sugarcane were sown in 8, 4 and '1 per cent. of the total
cultivated area. Food stuffs daimed the highest percentage of the total sown
. area j and cotton more than one-fourth. But in the years 1924 and 1925 the
latter appropriated 36 per cent. of the total area under gross cultivation on
account of the high prices of cotton then ruling the market. At the commencement
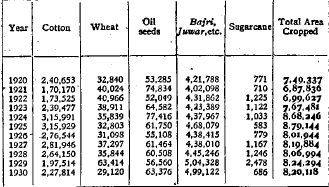
of the decade, i.e., in 1921 cotton was grown in 1,70,170 acres, but the rising
tide of prices in 1922 increased the area in 1923 to 2,39,477 acres, which further
expanded to 3,15,991 and 3,15,929 acres in 1924 and 1925 respectively. But
with the fall in prices in 1926, it again fell to 2,76,544 acres and as low as
1,97,514 in 1929, when the prices were barely sufficient to cover the expenses of
-cultivation and leave a very narrow margin of profit. The marginal table gives
the figures in acres of different kinds of crops sown from 1920-1930. Food stuffs have been increasiguly sown during 1929 and 1930. The area under wheat cultivation was at its highest in 1929, and with bajri and ju'War . claimed 68-8 per cent, of the gross cultivated area. Area under oilseeds and sugarcane showed slight fluctua- . tions, in response to the rise in prices, by showing an increase in the area sown. During the decade, the total area sown including the double cropped has shown a steady rise. From 6,87,836 acres in 1921 it has come upto 8,20,118 acres in 1930, and in 1924 and ~925 when the prices ruled highest it went up to 8,68,246 .and 8,79,144 acres respectively. The effect of a rise in the level of prices is seen from the increasing area of laNd thus brought under cultivation. The diagram opposite illustrates the variation in the gross cultivated area, and the area under the different kinds of crops from year to year.
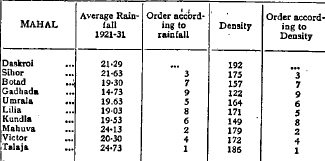
21. Rainfall.-.' Rainfall has much• fo •dO willi determining the agricultural
-condition during the intercensal period. Many other factors as prices, market and
freedom from pests like locusts also enter into the successful termination of an
agricultural season. The Subsidiary Table VII at the end of the Chapter gives
the figures cif rainfall in the Mahals of the State since the year 1885.. Figures
•of . average rainfall for 35 and 45 years from 1885, as also for the past decade
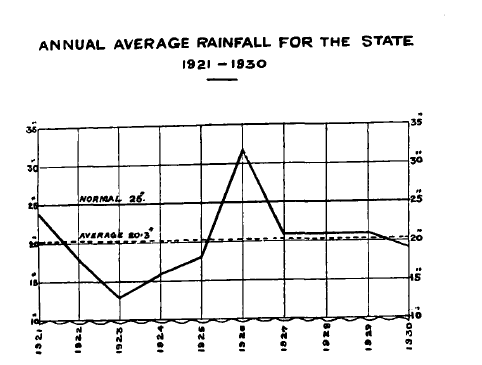
are :also shown. In the curve on the opposite page are plotted for the State
the figures of annual average rainfall in inches for 1921-30; the lines of
normal rainfall and average decennial rainfall areaIso plotted. It is hardly
necessary 'to emphasize the uncertain• and erratic nature of the monsoon
in. the State., . The. vagaries of the Indian monsoon :are too well-known
to be mentioned. It should be only pointed out that a high average does not
necessarily suggest a successful season, nor a low average a lean year. What
.teally counts in India is not the average amount of rainfall in a particular locality,
but the number of effective days which received timely and well-distributed rains. Given this a successful agricultural season is assured. High amount of rainfall either at the commencement or close of the season without proper rains during: the interval will spell disaster to the agriculturist, though some rain is better than no rain. For, a heavy rainfall, even though it does not benefit the khari! crops. will eventually prove beneficial by giving the prospects of a good ram season. Years from 1922 to 1925 and the year 1930 were years of low average rainfall" the year 1923 coming the lowest with an average of only 13 inches. During the' rest of the years, it rained pretty well above the decennial average. But the former were not necessarily the years of fruitless cultivation. On the contrary owin<1 to the high level of prices during the first quinquennium, particularly during the years 1924 and 1925, the agriculturists were enabled to secure greater returns for their labour. The area under cultivation during these two years correspondingly increased. The years 1921 to .1?23 proved .to be exceptionally' good years. Bumper crops of ,uwar and bfZjN accompamed by a very good wheat crop-both irrigated and unirrigated-in 1921 were followed by a very good yield of cotton, and the cultivators could reap a harvest beyond their expectations. But the bad years of 1923 and 1924 were averted by an extraordinary rise in prices. Despite scanty rainfall which appeared in the June of 1925, and did not tum up afterwards except in the Mahals of Botad, Talaja, and Mahuva,. the land yielded a fair harvest, cotton being better beyond expectations owing to the cloudy weather which prevailed for the greater part and kept the young plants alive till the ripening time. Except the year 1930 which was 'not good in some places, the rest of the decade was on the whole satisfactory and marked. by conditions which made good the loss in the growth of one crop from another and rendered cultivation profitable by rise in prices, especially in that of' cotton.
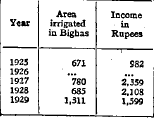
22. Irrigation.-Irrigation is one of the factors that facilitate the expansion and growth of agriculture. It enables an increased area of land to be brought:;: under cultivation, and serves to counteract the effects of, paucity and irregularity' of rains. The result is seen in better and greater amount of produce yielded by. the soil and its consequent effects upon the growth of numbers. WeIJ irrigation, is the main source of irrigating the land of the State. There are as many as. 12,147 wells in the Sta~e distribu.ted as shown in t~e density map facing page 30; Thanks to the very ltberal poltcy of the State 10 encouraging agriculture and assisting the khedtlt to ameliorate his condition, loans on easy terms are made tohi~ t~ dig new wells, and thus to enable. him t? inc.rease the output of crop. All' Irrlgatton Department has been brought lOto belOg smce 1928, and various projects, for increasing the supply of water have been surveyed. But the absence. of rivers with perennial water flow is a great obstacle in the way of successful launching of any useful Iarge-scale scheme of dam irrigation which alone can benefit the agriculturist. The Ramdhari Irrigation Tank has been supplying water to some of the lands in the Mahals of Sihor and Umrala. The marginal statistics show the area of lands irrigated by the tank and the income derived therefrom since 1925.
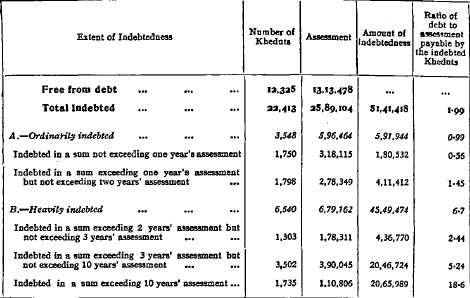
23. Agricultural Indebtedneu.-Seeing that the peasantry of the Statewas sinking deeper and deeper into the mire of indebtedness, the Darbar appointed in 1922, a committee" to inquire into the problem of agricultural indebtedness and suggest remedial measures which would grant some relief to the Kheduts in their 'present desperate economic condition and minimise the risks of their being explOIted and taken undue advantage of by unscrupulous Sowcars."l The investigations of the Committee are embodied in the Report and Evidence Volumes.
submitted by it to the Darbar. The following statement reproduced from the Report throws vivid light upon the extent and nature of indebtedness in the State:-
It was found that 30 per cent. of the kheduts were hopelessly involved in debt, and that their condition was such as to give cause for grave anxiety. And so foreseeing the necessity of timely action, if an acute agrarian crisis were to be averted, the Chairman of the Committee, Dewan Bahadur Tribhuwandas, recommended as follows in his Preliminary Minute :-
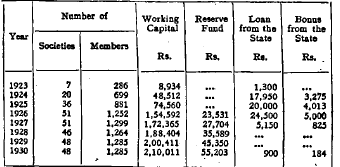
.. (i) Where it is possible, endeavours shoald be made to liquidate the past debts of the Kheduts and for this the co•operatiou of the merchants shoald be ealisted. (ii) Where in future suits are filed against Kheduts the law shoald be so ameuded as to enable .the courts to examine the whole history of the transactions oat of which the sait has arisen, in order to find oat the additions by way of interest and premiam and the maDipalations in acconnts, and finally to make an equitable award fair to both sides:' 1 But at the same time, he expressed himself in no uncertain terms as to the futility of replacing the Sahukar, referring to whom, he wrote:- . .. The whole question is very complicated. The financial relations of the lender and borrower, a very delicate matter always, are involved therein. Kheduts do need the help of money• lenders every now and then. The money-lender is a vital and indispensable factor iri the village•economy and the Darhar cannot replace him. In this dilemma, I believe the best course woald be to take such steps as are indicated by the needs of the situation, ultimately with a view to restore both parties to their former position of mutual trust and service, without exploitation on the ODe side and victimization on the other. Moreover we cannot connive at and condone the practices hrought to light during the Committee's inquiry. If that he allowed, the conditions of the Khedats woald soon worsen and economic rain overtake the whole class, which woald again react on the money•lenders themselves and involve them in heavy losses.'" , . . The President of the Council took prompt action to pasS the necessary legislation and push forward without the least delay the Debt Redemption Scheme whereby it was proposed to settle private outstanding debts of the agri- 1. KMd14t Debt lnqu~ Committee Report, p. 116. 2. 11M. CO-OPERATIVE SOCIETIES 11 culturists so as to enable the money-lenders to recover a fair proportion of the original principal amount together with a moderate rate of interest. It was a very summary and exemplary piece of legislation of far-reaching consequences, combining i~tion with foresight. With one stroke of pen, it embarked upon the noble task of liberating the cultivator from the economic bondage of the money-lender. The investigations into the existing obligations were to be made at the joint request of the kheduts and money-lenders, according to the rules framed on the lines of the Deccan Agriculturist's Relief Act, by a special committee, popularly known as the ' Karaj 'committee. At the time of writing this Report, the whole of the Lilia Mahal has been redeemed from all private debts. A sum of Rs. 9,95,463 that was owing to the Sahukars by the agriculturists of that Mahal according to the account books of the former was reduced to Rs. 4,64,559, when the accounts were taken by the Committee. It was, however, the basic principle of the payment made by the Darbar on behalf of the khedut that the amount advanced by them on behalf of a particular khatedar for compounding all his debts should in no case exceed three times the annual assessment payable by him. The sum thus advanced was apportioned among the money-lenders in proportion to the amount found due to each, in full payment of all existing liabilities of the khedut. The application of this rule further reduced the liability of the kheduts of the Mahal of Lilia to Rs. 2,61,427 only. Similar work is in progress in the MahaI of U mrala also. This bold and constructive policy cannot but result in great economic improvement of the peasantry of the State. • 24. Co-operative Societies.-Among the factors that tended to promote agriculture during the past decade, the starting of agricultural credit co-operative societies was one. The beginning was first made in the year 1918, but as thelegis. Iation then promulgated in this behalf did not embody true principles of co-operation, they ~ere all doomed to failure, and had to be closed. A renewed attempt was made In 1923, when a new enactment based on sound co-operative principles was passed. Since then the societies have shown, steady progress. The' marginal table tells its own tale and needs no comment. The recent co-operative legislation provides for a loan to the society equal to the amount, but not exceeding Rs. 2,000 raised by it, and a bonus of 20 per cent. on the sum raised within the first two years of its birth. But this generous and liberal offer made by the Darhar has not been folly availed .of by the societies. For, had it been so,
the rillage economy of rllral India, and so despite the crushing burden of interest which is charged by him no khedut is willing to snap the ties that exist between him and the Sahukar. But recourse to co-operative credit after the peasant is. once free from all his past debts owing to the latter, as seen in the preceding para, cannot but result in making him economically independent and prosperous. The promotion of credit co-operative societies is thus one of the means, and by no means an unimportant one, whereby the khedut can extricate himself from being exploited by the unscrupulous money-lender.
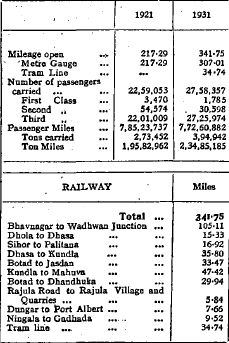
. 25. Means . Communication.-Like .irrigation, fa~ilities of transport serve to mlDlmlse the III effects of shortage of ram and of famme by acting as a remedial measure. It also encourages the distribution and the consequent movement of population from one place to another. Bhavnagar State owns its. own railway which intersects every Mahal of the State. With the exception of a small tract between Mahuva and Talaja it encircles the whole of the State territories. The construction of this piece of railway is also under consideration. It . . will be seen from the figures on the
margin that the total mileage of 217'29
in 1921 increased to 341'75 in 1931.
The volume of passenger and goods.
traffic also shows a significant rise.
Though the number of first" and second
class passengers has considerably
dwindled, that of the third class
passengers who form the bulk of the
travelling public and indicate the real
movement of population, has remarkably
increased. The goods traffic
measured in tons carried has gone up•
from 2,73,452 in 1921 to 3,94,942 in
1931. The mileage of the various
branches is'also shown in the marginal
table. Pucca metalled roads to the
extent of 274 miles pass through the
Mahals, and cart tracts join one village
to another. Still there is much to be
desired by way of metalled roads at
many places. Tbe expansion of the•
means of communications, especially
the rail roads has greatly facilitated the
growth of trade and commerce, .and
encouraged the distribution and movement
of the population of the State, during the past decennium.
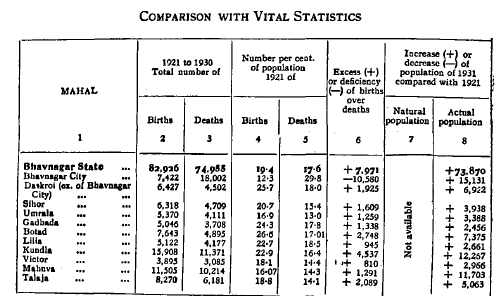
26. Vital Statistics.-The growth of population is ultimately' determined by the difference between the numbers born and the numbers who die and by the balance of migration, i. e., the difference between the immigrants and emigrants. The former involves a discussion of the vital statistics which will now occupy . our attention. But before analysing the figures of births and deaths and their' rates, an estimate of the value of the statistics obtained should be made. The statistics of vital occurrences are anything but complete. This is a drawback which' is general and common to all parts of India to a greater or less extent. The proper and complete registration and compilation of all .vital statistics is indeed vital to any civilized society; and every endeavour should be made to ensure it. Much depends upon the sense of civic responsibility of the people without whose co-operation statistics cannot be accurately recorded. But that this sense has. not been sufficiently awakened will be seen by analysing the fi!!llres obtained from the Municipality of Bhavnagar City, the greater number of ;hose citizens are enlightened and educated. As against 7,422 births registered during the period 1921-1930, there are as many as 18,002 deaths, a net loss of 10,580:'
.lives in the natural population of the City., But this is far from the truth! as the population of Bhavnagar records an increase of,15,1~1 or 25 per '7n~. dunng the t decennium which is not all due to immIgration. The statistics that have I:"en compiled 5~oul~ therefore, ~ put to 31 limited and cautious use and no sweeping generaitsatJOns should he mdulged III. As absol~te ~u~bers they ~ould be deemed useless, and should serve the purpose only of mstituting ~ompansons and gauging tendencies. The records tell us that the reports of births are less accurate than the reports of deaths; and that the male births are ,more readily reported than the female, as the latter are less favourably received than the former.
The incompleteness of vital registration will he demonstrated by the Subsidiary Table printed above which institutes a comparison between the in •(:rea~ or dec~ease in the popUlation of the State as resulting from an excess or defiCiency of births over deaths and actual growth of population during the intercensai period. As against a total enumerated increase of 73 S70 a balance of 7,971 bir,ths over deaths is the result. The peculiar case of the 'City has already been notIced.
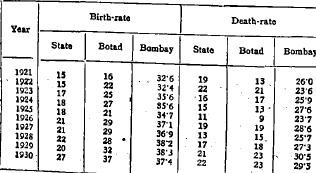
27. The marginal statistics of the birth and death rates dllring the past . de~a~e are ,given for t~e State i.n general and the Mahal of Botad in particular. OrIgmaily It was our Idea to gIve the rates for all the Mahals of the State. But it has now been ~ropped owing to their Incompleteness. As it has been found that the births and deaths have been better recorded in Botad than In a.ny• other Mahal of the State;their rates have been shown side by side with, those for'the State for ,the purposes of comparison. This will be proved by
ntes during the decade which are. loS for the State, and comparing their survival . . '. . 9'5 for ._B' Q.~.t a- d.. These . ..:. ,
rates are the numbers per mille who are born or die or survive in the population recorded at the Census of 1921. The survival rate represents the difference between the birth-rate and death.-rate, and is the mean of the last ten years. The Botad rate makes a fair approach to accuracy_ For, while according to the general rate of survival the natural population of the State as it was in 1921 will gain 797 per year, according to the Botad rate it will increase at the rate of 4,047 per year j and the present Census which registers an increase of 73 870 'has shown that the actual or total population including the foreign bo~ ~ increased at the rate •of 7,387 persons per year_ The Bombay rates 1 have been shown side by side with the State rates in order that a clear idea can be had of the degree of incompleteness of the latter_
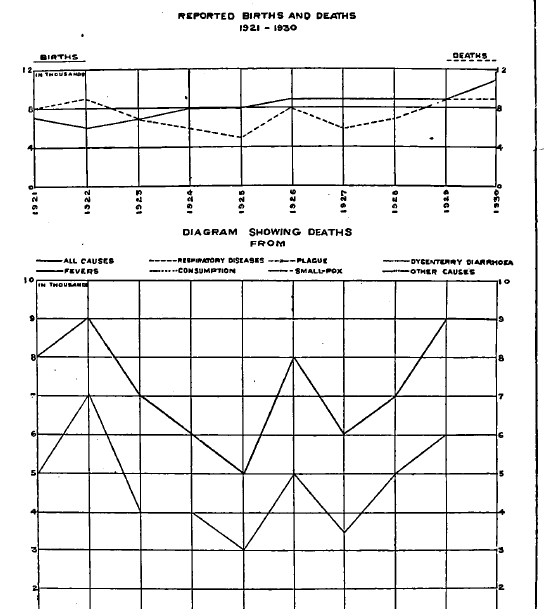
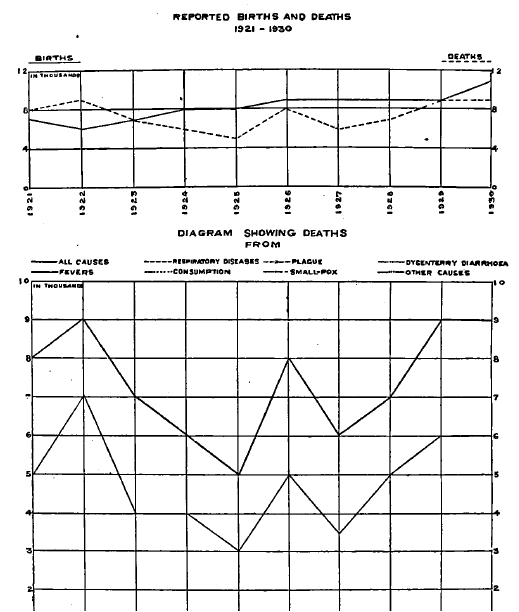
. 28. The foregoing curves show the movement of birth-rate and death-rate during 1921-30 for the State, Bombay Presidency, and the. Mahal of Botad. The death curve for •the State shoots upwards in 1921, 1922, 1926, 1929 and 1930. The first two years represent the effects of the influenza of 1918 which greatly impaired the vitality of the people, and lowered the birth-rate which has. travelled upward only after 1922 since when it has been steadily rising. The relatively higher death-rate in 1929 and 1930 is due to the effects, as will be seen in the following para, of malaria and influenza. The greater accuracy of the
Botad curves will be apparent from. t~eir continuously ~avelling apart like those of the Bombay Presidency. But this IS not the case WIth the State curves, as they are far less accurate .than those for Bombay and Botad. • 29. Public Health.-The state of public health during the intercensal period plays no mean part in measuring the ~owth of the pop~ation. Because any disturbance in the health of the people will have very obvIOUS effects u~n their fertility and vitality and swing back the pend~lum of grow.th, a~d result 1D the reduction of numbers, as was the case after the mfluenza epidemiC of 1918. On the whole the public heal th was well maintained during the ten years that passed, as checks to population in the form of famine and pestilence did not make their appearance.
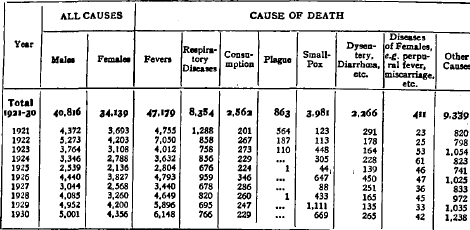
SUBSIDIARY TABLE III ACTUAL NUMBER OF DEATHS FROM VARIOUS CAUSES RECORDED IN EACH
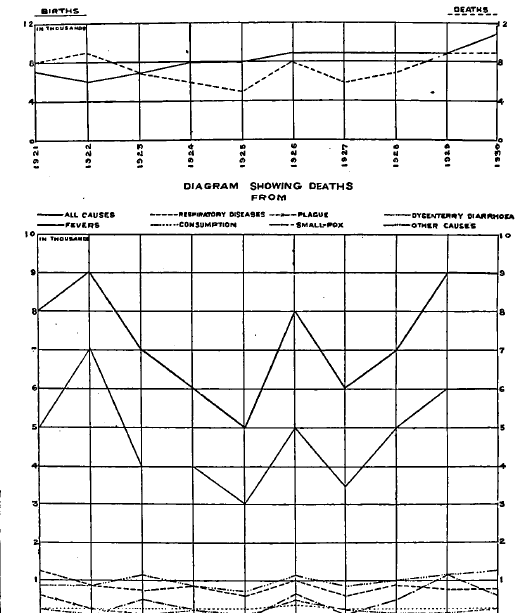
~ The relevant statistics of deaths from various causes as recorded in each year from 1921-30 are given in the foregoing Subsidiary Table. Under "other causes" are shown cases of accidents, poisoning, suicide, injuries, as also of other types of illness not specifically mentioned. The diagram on the opposite page shows the curves of deaths from the principal diseases, and all causes combined. The total number of reported births and deaths during 1921-30 are also shown. The traces of the two epidemics, vis., plague and influenza, which visited the State during the decade 1911-21 may well be noticed first. Influenza which followed in the wake of plague and whose toll of life was simply staggering must have remained with us like the plague in an endemic but milder form after its first virulent attack in 1918. This is amply demonstrated by the curve of the birth-rate remaining low even in 1921-22. But no case of death from this disease ha~ bee~ rep~rte~ owing t? the want of proper machinery ~or registering deaths which IS ordinarily left ID the hands of the uneducated village officials. Many of the diseases like influenza, phthisis, etc., therefore, pass off under the more general heading • fever' which claimed as many as 47,179 lives, out of a total number of 74,955 deaths recorded during the decade. Reported deaths from fever were tolerably high during the years 1922, 1929 and 1930. But plague which it is easier to distinguish from fever than influenza seems to have been properly recorded. It was prevalent during the first three years, and began to wane from 1922. Out of a total of 863 lives which it claimed during the decade, as many as 861 cas.es belon~ to years 1921-23. 8,354 persons were reported to have died from respiratory diseases. Smallpox claimed 3,981, its quota being the highest
>in 1929and amounted to 1,111.' ConsUmption also claimed a fair number of 2,562. Malaria which is prevalent during the greater part of the year and more especially during the monsoon was disguised under 'fevers' and not 'separately registered. Malaria as, a calIse of death is not of very great importance. On this side of the country, the disease does not prove fatal, as is the case in 'Bengal unless other complications in the form of attacks by pneumonia and typhoid fevers supervene. But its indirect effect upon the health of the population is ,great. It saps vitality, reduces fertility and resisting power of the people and disturbs the tenor of steady economic development by impairing their physicai vigour. Except• for the first and last two years of the decade the health of the people seems to have been on the whole satisfactory, and no disturbing element .seems to have interfered with an even growth of population.
30. Prices and Wages.-Prices and wages by themselves mean nothing -unless they are taken in conjunction with production and demand on the one hand, and the cost, and standard of living on the other. But it is not possible to enter here into all these intricate details. Only the trend of prices and wages •during the decade as affecting the mode of living and the growth of numbers will ,be considered here. Higher prices stimulate production and commercial activity -only if there is a demand for things produced. Lower prices of food stuffs d~ not necessarily mean cheap living, if the cost of production is not proportionately reduced. For, in modern times when civilization harbours ideas of a higher stan-< lard of living by increasing the individual requirements, fall in prices of food, stuffs alone canpot prove profitable. On the contrary, low prices of food-stuffs and other artiCles of necessity will not benefit an agricultural society, if there is not a corresponding fall in the expenses of cultivation. It will spell nothing but -disaster to the agriculturist, if his labours are not repaid by a level of prices 'sufficient to cover the cost of tilling and leave him a fair margin of profit. Again ,the trend of wholesale and retail prices is not the same. A fall in the former is .not always accompanied by a corresponding fall in the latter. Because retail
- prices will take some time to adjust themselves to the rising or falling level of
'w holesale prices. The first half of the decennium was marked by a rise in prices in general which mounted the peak of prosperity in 1925, the year 1924-25 being •,the year of exceptionally high prices. So far as the prices of food•stuffs and fodder were concerned, there was in that single year a rise of 14 and 15 per cent. respectively. An abnormal rise in the prices of commercial commodities like •cotton ranging from Rs. 10 to Rs. 24 per maund of 40 Ibs. and of treacle from Rs. 6 1:0 Rs. 8 as also the greater value realised from oil seeds during the six years in •the midst of the past decennium greatly enlarged the earnings of the agriculturists. The fall commenced from 1925-26, when the prices began to decline steadily. In some commodities, it asserted the pre-war level of 1914. The October of 1929 was marked by a new and heavy fall in prices, especially of food grains which •continued even in 1930. The fall was due to the world conditions which were beyond the control of any country'- This alround wave of depression has been .attributed to general over-production both of raw materials and industrial prO. .ducts, as also to the insufficient production and unequal distribution of gold for the .general requirements of the world as a whole.
With the rise in prices had set in the rise in the wages of skilled and 'unskilled labour. But the fall in wages was not .quick to follow the decline in the level of prices. They showed a remarkable rise upto 1922; and the last mentioned year alone was responsible for an increase of. 17 per cent. in the wages of 'skilled and unskilled workmen. The fall in wages, both skilled and unskilled, -commenced since 1923, and c~ntinued upto 1928. The daily wages of a carpenter or a mason which had risen to Rs. 2-8 in many places in the Mahals and -especially in the City, respectively fell to an average of Re. 1-6 and Re. 1-1. The wages of an agri.cultural labourer fell from 6-8 annas to 3-4, annas per diem. The wages thus very nearly touched the pre-war level. Looking to the,trend of wages since 1921, it is also found that the wages of skilled labour took greater time to' fall than. those of the unskilled. "
THE IlIDUSTRIAL A~"D COMMERCIAL PROGRESS .19 The eConomic Conditions of the period under report were thus on the whole favourable to cheap and easy living, and it was only during the last two ears that the heavy slump in prices made it a little less attractive. As com~ ared to 1911.21, when for the greate~ ~rt of the d~de the prices were highly inflated owing to abnormal war conditl~ns, the penod ~921~31 was mor~ conducive to the growth of a peaceful commumty, as lower pnces put less strain upon: the nerves of the people.
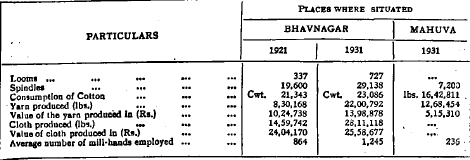
31. The Industrial aud Commercial Progress.-After considering the agricultural condition of the period the advancement of trade, commerce, and industries deserves to be briefly surveyed. 1£ the general and agricultural conc1i. tions of the decade were on the whole satisfactory, the course of industrial and commercial progress was marked by st.riking. rapic1ity. During the past decen• nium, to the existing spinning and weavmg mIll l'!l:ated at ~havnagar, another spinning mill was added at Mahuva, due to the Impetus given by the post.war period which was characterised by high prices of cotton. The figures on the margin disclose the increasing industrial development of the State in spite of the PLACES WHERE SITUATED
stringency of money market prevailing all the world OVer. The Swadeshi move• ment inducing the growth of indigenous industries brought a new life to the goods of Indian make especially in the production of Khac1i cloth and cotton piece goods. The New Jehangir Vakil Mills Co. which manufactures cotton yarn and grey and bleached piece goods increased the output of cloth from 14,59,742 in. 1920 to 28,11,118 lbs. in 1930, .nearly double their former annual production. The number of looms and spindles corresponc1ingly increased from 337 and 19,600 to 727 and 29,138 respectively. The average number of persons. employed rose from 864 to 1,245. There are 10 cotton presses, 4 being at Bhavnagar, 2 at Mahuva, 3 at Botad, and 1 at Kundla. Ginning factories are scattered over all the Mahals. Out of a total number of 30, the prospering cotton growing and selling tract of Botad alone possesses 7. Of the remainder, 4 are at Bhavnagar, 6 at Mahuva, 2 each at Rajula, Dungar and Vijapac1i, 3 at Kundla~ 1 at Lilia, 1 at Madhada, 1 at Dhola, and. 1 at Gadhada. In the words of the Administration Report for 1930, this state of increased industrial activities has. led to .. hand weaving showing signs of a sort of revival for some time past. As a consequence, the gold lace pachhedis, silk bordered dlloters, and thick covering sheets of cotton cloth known as cllo/als produced by the weavers of Kundla fetch better prices. The stout woollen blankets of Gadhada and the carpets and bed covers dyed in variegated colours produced by the Khatris of SihorUmrala and Vartej are more in demand than they were some time ago,'" On a~count of the greater demand made upon the hand•made khadi, the khac1i-making concerns have ~sen from 3 in. 1920 to 11 in 1930. There are also 1,992 hand.looms of which 132 are worked by fly.s~uttles, 5,121 spinning wheels, and 293 hand~ us. ~he a1round progress .a~d reVival of home industries during the past decennium ,Will be ~n f~m Subsi~ary Table VII in Chapter VIII-Occupation. But at thiS place, It Will be suffiCient to note that the khadi cloth produced in 1920- 21 was oll:ly 93,839 lbs. as compared to 3,38,107 lbs. in 1929-30. The number of flour mills was also 011: the increase, as also that of the oil mills which had gone: 1. VUU Po 51.
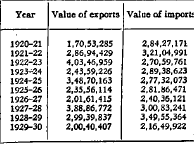
up from 6 to 10. The pretty wooden and ivory toys which would be the pride of any workman are as popular as ever, and 57 families are engaged in this work of which 25 belong to Mahuva alone. Skill of Sihor coppersmiths in the preparation of brass and copper household utensils and other wares continues to be admirable, and Sihor alone has got 100 families engaged in this industry, out of a total of 194 for the whole State. There are other industries which have got a bright future before them. Kundla prepares iron wares and is specially noted for its scales. The starting of a match factory by an enterprising merchant is under consideration. The salt industry has got great future prospects as the State has of late been permitted like Okha to export salt to Bengal and Burma by sea. But the present out-tum should be increased and improved upon before this concession can be availed of with advantage. For, the Bengalis who are used to white and refined salt from Lancashire will not readily buy salt from the State 4gars whose salt is mixed with other impurities like gypsum, etc. There is another direction also in which industrial advancement is possible. The Khara roil at Patna has been found to be a good basis for manufacturing soda-ash bleaching powder, caustic soda, etc. The 18 to 20 square miles of natron soil with ~most an ine~haustible supply of. underground wa~er and natural advantage . .of havmg soda-ash m the crude form direct from the soIl can be advantageously utilized, if the initial ~xperiments prove successful. There are two Chemical Works at Vartej in the Mahal of Daskroi which manufacture all kinds of tinctures, liniments, and other pharmaceutical and chemical preparations. The works are supplying medicines to various States in Kathiawarand parts of British India. The Electric Supply Company which started work during the past decade has extended its activities and is supplying motive power to the factories in the City. This state of affairs betokens an era of great industrial development and progress. 32. The commercial advancement of the State has played no mean part in the growth of population during the decennium under report. Its contribution towards the growth of the population of the City of Bhavnagar in particular and the State in general cannot be underestimated. Never has the State of Bhavna!!ar -experienced years of such extraordinary commercial expansion which was foste~ed and nurtured by the wise and foreseeing statesmanship of its rulers. The Port of Bhavnagar has undergone great transformation, and the facilities of transport in the shape of railway communications, financial help to merchants in the shape of loanson easy terms by the State Bank on the security of goods imported coupled with the advantage of a bonded ware-house have during the past 10 years attract- ed a considerable amount of trade, foreign and coastal, to its harbour. The Department of Commerce and Industries for the first time brought into heing as a trial measure for two years in 1922, was found necessary and useful and made permanent. Large consignments of articles of foreign produce or manufacture like sugar, coal, hardware, .haberdashery, glassware, piece-goods, rice, timber, ,iron, metal sheets, wet and dry dates, paper, etc., are now imported to Bhavnagar •wa Bombay or direct from foreign ports. In 1923-24 only 5 ocean liners visited Bhavnagar, but the close of the decade saw the Port visited by 53 ocean liners •of which 18 brought sugar, 11 dce and timber, 3 coal, and 21 iron from the Continent. In addition to the above, the steamer "Skrimer" made 6 trips with .coal from Calcutta for the Bhavnagar State Railway. A clear idea of the ,growth of the sea-borne trade of Bhavnagar during the past decennium, will be afforded by the marginal statement reproduced from the Administration
Report,1929-30. It supplies the figures of the total value of exports and imports during the period 1920-30. The rapid expansion of maritime trade which commenced since 1917 continued unabated during practically the whole of the past decade. If necessary allowance be made for the difference in the level of prices ruling the market at the beginning and end of the past decennium, it will appear that both the export and import trade was steadily on the increase. If the
year 1929-30 which was affected by an abnormal fall in the level of prices be left <lut of account, the imports rose from Rs. 2,84,27,171 in 1921 to Rs. 3,49,55,364 in 1928-29. But the increase will be found to be much more, if measured in tenns of commodity as the price level was higher in 1921 than in 1929. The exports also correspondingly increased, the very low figure for 1929-30 being due to the unfavourable cotton season which reduced the export of cotton bales by 10 1 lacs.
The industrial and commercial activities of the past decennium outlined above were mainly instrumental in attracting a fair number of immigrants to this State, more particularly to the City of Bhavnagar. They account to no mean extent for the growth of numbers revealed at the current Census.
VARIATION IN THE POPULATION OF THE STATE AND MAHALS
33. Variation during 1921-1931.-Against the background of the general, physical, agricultural, and economic conditions which have been succinctly depicted should be presented the discussion of the changes in the population of the State and Mahals during the past decennium. There is an increase of 73,870 or 17•3 per cent. in the total population of the State as it stood in 1921. The conditions outlined in the preceding paras bear ample testimony to their exhilarating effect upon the growth of numbers during the decade under report. It is a record rise in the State population ever since the commencement of the Census era. No other intercensal period has had the good fortune of registering 6uch a high percentage or numerical rise in the State population. The rise is uniform all throughout the State. The net variation by way of increase during'
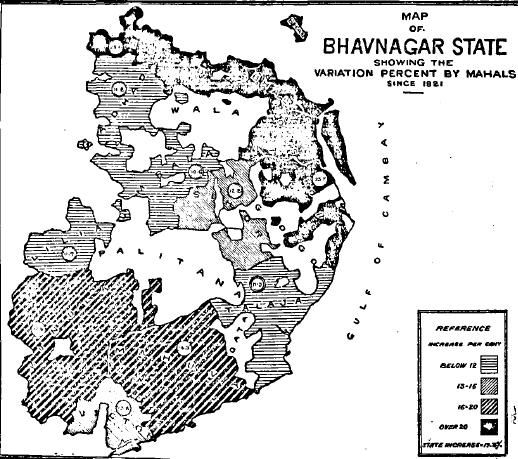
the past fifty years comes 'to '25 per cent. or 99,951 souls. The City of Bhavnagar and the Mahals of Daskroi and Botadhaveeach risen over 25 per cent. Ma:, huva ~d Kundla Mahals have risen respectively by 16:3 and 17,6 per cent., TaJaja by 11 5 per cent" whereas no,other Mahal shows a rise of less than 10 per cent. The diagram on page 21 illustrates the percentage variation in the population by Mahals, from the figures of 1921 adjusted upon the basis of areas as they stood" in 1931. ,
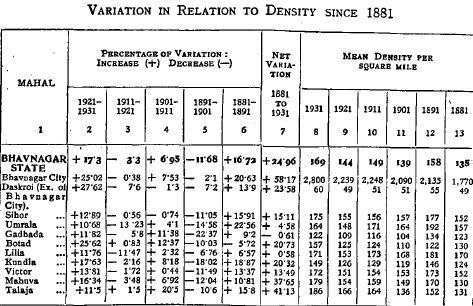
34. Variation in Population by MahaIs,-The movement of the State population has been considered, It will now be worthwhile to notice its variation by ~~hal~,. The follov:ing Subsidiary Ta,ble supplies the, figures of percentage variatIOn In the population of the State, City and Mahals In relation to density since 1881.
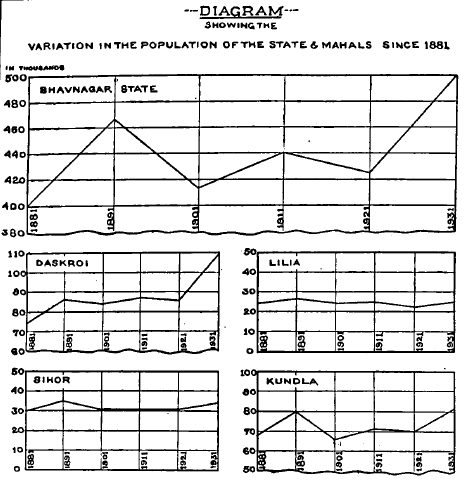
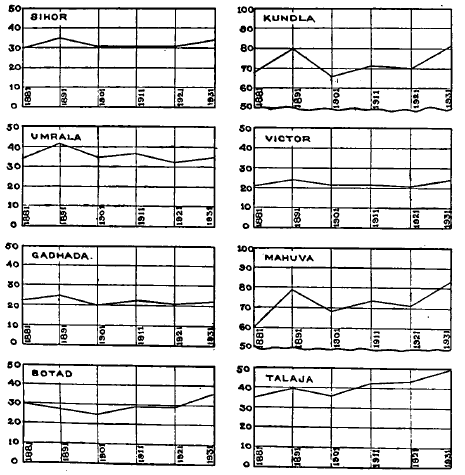
35, Diagram.-On the opposite page is given the diagram showing the
variation in the population of the State and Mahals since 1881. It will help the
understanding of the review that follows.
36. Daskroi Mahal.-The fate of the Daskroi Mahal has been mixed up
with that of the City of Bhavnagar, whose progressive growth has influenced the
movement of its population, The City may well be referred to in brief, deferring
its treatment in details to the next chapter. A rise or fall in its population has
responded to a rise or fall in the general population, though of course, not to the ..
same extent. Whenever there has been a rise, the City'S rise has been greater
than that of the State, whereas its fall has been smaller than that of the State.
Subsidiary Table IV will clearly illustrate this point, This is due to the
growing, character of the capital and the greater resisting power of the urban
population. Bhavnagar has been an emporium of trade, the growth of its port
during the past decade being responsible for an unprecedented rise in its popUlation.
During the past decade alone it bas grown by 25 per c~nt., while during
the last half a century it has added 27,802 souls or risen by 58 per cent. Excluding
the City, the decrease in the population recorded during the decade 1911-21,
when it was hard hit by influenza came up to 7'6 per cent. But the resisting,
power of the people of the Mabal which was greatly impaired since the Chhapania
Famine remarkably improved during the last ,intercensal period when it
registered an increase of 27'6 per cent" while the net increase during the last fifty,
years is found to be 6,102 or 23'5 per cent.
37. Sihor MahaL-It ia an old Mahal of the State' and was once the 'seat of the Ruling Family before the present capital was founded. D~ the last fifty years, the population of this Mahallike others that ,,!iIl be conslCiered hereafter reached its zenith in 1891, but suffered a heavy fall In 1901. It' has failed to come up to that ,level even during th7 present C~DSUS when. it ~ds at 34471 and faUs short of It by 313 persons. Smce 1891 Its population IS on the d~line, and it was the only Mahal along with Daskroi which showed a fall of '0'74 per cent. in its population, when all the other Mahals of the State recorded varying degrees of progress in 1911. Along side with the effects of famine and plague are to be seen the influences of the migratory tendency of the inhabitants .of the Mahal who went out to Bombay and Rangoon and other industrial centres for earning their livelihood. But in 1921 when this outward flow was at its nighest throughout the Mahals of the State, and when mortality from influenza greatly reduced the population of some of the Mahals, a very small decrease of '5 per cent. only was registered in the population of Sihor. In 1931,a rlseof 3,938 .or 12'8 per cent. is returned, whereas the net gain from 1881 to 1931 is 4;527 or 15'1 per cent.
38. Umrala Mahal.-Like, Sihor, Umrala is also o~e of.th~oldest Mahals of the State, and enjoyed the favour of being the original seat of the Gohel dynasty of Bhavnagar. It falls in line with Sihor in not coming upte the level of 1891 to a greater extent than Sihor. In that significant year the population of the Mahal was 41,072, upon which the present figure shows a d~ficit of 5,995 persons. It lost 14'5 and 13'2 per cent. respectively at the Censuses, of 1901 and 1921 owing to the Great Famine and influenza. To this should be added a succession of lean years, and reduced fertility of the soil, all of ,which jointly conspired to reduce the vitality and staying power of the people of this Mahal. But the period 1921-31 sees it successful in regaining much of the lost ,ground which is covered with an increase of 3,388 or lO'7 per cent. over the population of 1921. The incubus is gradually raising itself, though the effects of the past sufferings are stilI there, and are visible from th~ percentage of increase at this Census being the lowest in this Mahal. The net increase in its populatipn' .is, however, 1,538 or 4'6 per cent. during the last fifty years. '" ,
39, Gadhada Mahal,-Gadhada finishes' the trio of those Mahils of the
Northern Division whose present population shows a decline on the figure' of'
1891. It seems to have been the most hard hit by the famine of 1900 which:
must be held responsible for the loss of 22'4 per cent" the highest of all the
Ma,hals, w,hic~ it ,suffered at the Cens,!s of 1901. But during the br.eathing
period which It gamed from 1901-1911, It struggled bravely for a recuperation of•
11'4 per cent. Then a loss of 5'8 per cent. from influenza was followed by a
,gain of 11'8 per cent. at the present Census. A deficit of 2 294 souls over its
population as it stood in 1891 and a net losS of 143 for the past fifty years are
not a'very pleasing spectacle for the Mahal of Gadhada. The effects of i900
visitations are still there, though they are gradually disappearing. Nature's share
jn bringing about this result is not small. A series of bad years on account of
the failing and decreasing rainfall and a population laid low by the effects of
famine hav~ greatly checked an ev~~ growth of numbers. The figures of rainfall
for this Mahal show very strikmg results. The average rainfall for the 35
and 44 years from 1885 works out to be 17'13 and 17'78 inches respectively"
whereas the average for the past .ten years has gone down to 14'7 inches. Th~
soil of this Mahal is in no way inferior, and is in some way superior to some of
~he oth~r Mahals like Daskr~i, and Talaja. But to have good lands is by itself
msu~clent, For, the prospenty of an ~gric~lturai tract is mainly dependent upon
&uffi~le":cy ~f ramfaII ~celved at required Int~s without which unhampered
cultivatIOn IS not poSSible: Gadhada has been deprived of this bounty of Nature,
and hence the results noticed above. But the opening of the railway line from
Nmgala to Gadhada, and the tedencies to revival shown by this Mahal at 'every,
.alternat,e Census allay to some extent suspicions' about the future course of its
populatiOn. . .
40. Botad MahaL-Botad is now one of the progressive Mahals of the State. The cause for apprehension which it gave in 1891 when it had been singled out for a decrease of 1,714 or 5'7 per cent., and that too at a time when the rest of the Mahals had shown remarkable advance in their population is. removed by the subsequent movement of its population. This departure fro~ a uniform rising tendency exhibited by Botad in 1891 is rather hard to explain away easily. The failure of rains in the year preceding the Census of 1891 when it received only 8'40 inches cannot fully account for this exceptional re~lt submitted at the end of a decade. Want of proper enumeration cannot but have something though not much to do with this deficit. The rising tide is noticeable since 1911, as no area ca~ claim to exclude itself from the ;uinous and devastating effects of the Great FamlDe of 1900. The 1911 Census registered a si"nificant rise of 12'4 per cent., which was continued even during the period 1911-21 ;hich showed a uniform decrease allover the State owing to the heavy influenza mortality. This. rise is to some extent due to its favourable position on the BhavnagarState Railway which had by. this time. enable.d .it. to .develop into a prosperous cotton growing tract. Botad IS gradually IDdustnallzlDg Itself; and the present Census sees it at the• peak of prosperity giving it a very high increase of 25'6 per cent. Its total gain during the last fifty years is 6,208 or 20'7 per cent. and bears out the remark made in the Revision Settlement Report that Botad has adapted itself more strenuously to the changed circumstances with advantage.
41. Lilia MahaL-The Mahal of Lilia lines itself with some of the other Mahals of the State which have not come up to the population level of 1891. On account of the favoured position which it enjoys as regards soil and the preponderance of Kanbis who are the best cultivating popUlation of the State, it did not suffer so much as many other Mahals of the State daring the famine of 1900. The gain of 6'57 per cent. realised in its population in 1891 was, therefore, followed by a nearly equal loss of 6'7 per cent. in 1901. The rich black soil of the Kharopat with its dry and healthy climate seems to have endowed the Kanbis of Lilia with greater resisting and sustaining power. During the decennium 1901- •11, there is an insignificant increase of 2'3 per cent. only; whereas the influenza of 1918 brings about a deficit of 2,932 or U'S per cent. But the present Census. registers an increase of 2,661 or U'8 per cent. Examining these figures for the last fifty years the nef variation by way of increase in the population of the Mahal of Lilia is recorded to be 148 or 0'58 per cent. Over the population as recorded in 1891, a deficit of 1,503 is still to be made up.
42. Kundlil Mahal.-In KundJa, the later acquisition of the State, the soi1 is generally hilly and stony and though adjacent to Lilia does not enjoy the benefit of having fertile soils in some of the villages of the Tappas of Thordi and Vijapadi. It is one of those Mahals which have shown progressive tendencies. It. suffered heavily from the effects of the Chhapania Famine which was instrumental in bringing about a decrease of 18'02 per cent. in 1901, which in its tum was. preceded by an equal increase of 18'8 per cent. in 1891. But a material rise of 8'2 per cent. at the succeeding Census and a decrease of 2'1 per cent. in 1921 in spite of heavy influenza mortality testify to the greater staying power of the population which is prepondering Kanbi and to prosperous nature of the Mahal. A dry and healthy climate has also had its necessary beneficent effect on the growth of its population. The conjoint effect of these causes has been to give to KundJa a very enviable increase of 17'6 per cent. in its population at the present Census •• The growth of numbers has been also promoted by the extension of the Bhavnagar State Railway from KundJa to Mahuva which, has enabled the town of Kundla to develop into a flourishing market town and facilitated the disposal of its agricultural produce. Like Botad, though to some less extent. Kundla too has raised itself to the status of an important and growing cotton centre, and possesses a press and ginning factories. The last but not the least of the contributory causes to this happy result are the benefits of a settled and ordered government during the Census era which enable the people to abide in peace and grow. This last factor is not peculiar to KundJa alone, butalso holds. VICTOR. MAHUVA AND TALAJA IoIA.HALS good in the case of the Mahals of Mahava and Talaja whi~h were harasse<! by the robbers on the high seas popularly known as chanchJa8 and the Kathi outlaws or bahat'fJatias on the high roads.
43. Victor MahaL-The two Tappas of Doongar an~ Rajala were ~nstituted into a separate Mahal in the year 1881. The changes In the population of these two Tappas, therefore, constitute the history of the movement of population of this Mahal. There is very little to note except that it is one of the two Mahals of the Southern Division which are struggling to raise themselves to the stature of 189!. The present Census shows it to have well nigh, recovered its 1891 position which exceeds the present figure by 136. But there has been a net increase of 2,891 or 13'5 per cent. in the population of this Mahal since 188!.
44. Mahuva MahaL-The coastal Mahal of Mahuva is one of the highly progressive Mahals of the State. The population of the Mahal which was 60,508 in 1881 has riscn to 83,293 in 1931, showing a net variation of 22,785 or 37'6 per cent. within the last ~fty re~rs. The causes of decrease, viz., a b~g famine in 1900 and an influenza epidemiC 10 1918, are very nearly the same as 10 the case of other Mahals of the State. Practically the same movement of population is noticeable a Census of famine followed by a Census of slight increase, and then again a d;crease from influenza in 1918. The difference, however, lies in the stamina and resisting power varying with the economic and other conditions of the people. Among the factors that have stimulated the rapid growth in the population of this Mahal should be described the general fertility of soil which with its rich cocoanut and mango plantations has earned for it the title of the 'garden land' of the State i a low pitch of assessment i well distributed and sufficient rain-fall ~ facilities of railway communications i the convenience of a port helping it to industrialize and commercialize itself i and easily accessible market facilities. To these should be added as in the case of Kundla the sense of security accruing from a beneficent and progressive administration which reacts healthily on the growth of population. The past decennium alone is responsible for a rise of 11,703 souls or 16'3 per cent. in its population.
45. Tala;a Mahal.-This is another of the Coastal Mahals which has. shown a very striking rapidity of movement in its population. The extent of progress of Talaja is greater than that of Mahuva. For, while the increase in the population of Mahuva since 1881 is 37'6 per cent., that of Talaja is 41•!. It stands next to Daskroi from the point of growth. The march to prosperity commenced after the Big Famine, i.e., during the decade 1901-11, when the percentage of increase variation came up to 20'5. This onward march was characteristically maintained even during the influenza Census of 1921, and like Botad registered an increase of 1'5 per cent., while the rest of the Mahals showed a downward movement. The causes for these rapid strides taken by the Mahal of Talaja are to be sought in its comparative fertility, which of course cannot come on par with Mahuva, sufficiency of rains, and a comparatively low incidence of assessment. It seems to have been the most favoured from the point of rainfall the averages for this Mahal being the highest for the periods of 35 and 44 yea~ from 1885 as also for the past decennium. They are found to be 25'2 25'9 and 24'7 inches respectively. Its backwardness and late association with rail~ay communic,,: tions as not encouraging the e~igration of the people may have something to do With the growth of n~bers dunng 1901-~1. For whereas during that decennium thepercentagevanation was 20'5, thatdurmg 1921-31 which saw the construction of. the Tram Line from Bhavnagar to Talaja came to U•S per cent. The extstence of a port and a pleasant climate should also be alluded to. It need har~y be reiterated that it has shar«;d in common with Kundla and Mahuva, the blesslOgs of a peaceful rule, harhounng contentment and prosperity which accelerated the movement of their population •
-46:• Diagtllm.-The• actual• population• of' the •Mahals of the State as returned by the current Census is shown below by bars arranged in the order of their magnitude.
DIAGRAM SHOWING THE ACTUAL POPULATION OF MAHALS ARRANGED IN ORDER OF' MAC;;NITUOE
47. By the density of a tract is meant the number of persons dwelling upon a unit area of land, such as a square mile or an acre, assuming it to be uniformly distributed, which is usually not the case. This is what is known as the crude or mean density as distinguished from the spatial density which involves economic considerations to be reviewed later on. The ratio representing the crude density is one of convenience, and its variations within the area under consideration are tacitly assumed. This will be clearly observed from the fact that in one and the same Mahal, the density of different Tappas is not the same. Density serves as an index of pressure which the population of a tract exerts in relation to the similar figures of average density of other tracts. The area of the State of Bhavnagar is 2,961 square miles or 18,95,040 acres of land, and assuming uniform distribution, the average density of the State is 169 persons per square mile or 3'77 acres per person.
48. Density of Other States Considered. -It will be instructive to examine here the figures of area and population of some of the States in Western India
States Agency, and other Indian States and Provinces in British India. But such a comparison can be best instituted by examining their varying densities. The relevant statistics are shown in the margin. Among the Kathia war States, the State of Cutch stands first with an area of 8,249 square miles. Then follow Nawanagar and Junagadh with their respective areas of 3,791 and 3.337 square miles. Bhavnagar is fourth with an area of 2,961 square miles. But from the point of mean 'density the State of Palitana which has an area of only 300 square miles tops the list with 207 persons to the square mile. Gondal is second with 201 persons per square mile. But among the rest with larger areas Bhavnagar occupies the. favoured position with
a density of 169 perSons to the sqUare mile. The respeCtive densities of )unagadh and Nawanagar are 163 and 108, but the density of Cutch is 62, the lowest of all the Kathiawar States noticed above. But the mean density of the Westen} India States Agency is found to be 113. Similar statistics for other Indian States are intere;ting. The Southern India States of Cochin and Travancore have 814 and 668 persons per square mile respectively. The crude density of 814 for the State of Cochin whose area is only 1,480 square miles is certainly very high. But the premier Indian State of Hyderabad has got a density of only 174 persons per square mile which comes very near to that of this State. Baroda is fairly dense with 299 persons to the square mile. But the States of Gwalior and Bikaner which come next to Hyderabad from the point of area have a density of 134 and 40 persons respectively. The areal density of England according to the Census of 1931 is 685 persons to the square mile, and that of Belgium 686. But the density of the vast Indian Continent is 196 persons to the square mile. •
The foregoing statistics can be best understood from the following diagram which compares the density of the State with those of other States. Provinces, and England and Wales. The Mahal densities are also compared.
p d. The growth of ClYihullon, wh,ch•tmplies-mastefYove. uatare•iil ... higher
degree, and tbe development of industry and trade, make it pogsible to become Independent of
agricultural conditions, and caose a heavy density of population also in places poorly endowed
by nature. Tbe great increase of populatioo among modern civilized peoples i. doe to tbe growth
of trade aod industry.'"
. Different sets of causes combine to determine the density of a tract. The factors that generally influence the density of an agricultural locality are the fertility of soil, adequacy of rainfall, configuration of the surface, sanitation or climate and to some extent the incidence of land tax. The last two, however, do not play so important a part as the first two, as the proverbial attachment of the Indian peasant to his ancestral horne renders him immobile, and makes him stick to it even under adverse circumstances. As regards an industrial centre, the set of circumstances that will operate to make it dense will be the opportunities for employing one's self profitably, facilities of transport and communications, and a prosperous trade and thriving commerce. The flourishing City of Bhavnagar is a striking instance to this point. The density of the City which was 1,770 persons to the square mile in 1881 rose to 2,800 in 1931.
50. As in the case of the State, so in the case of the City and Mahals, density has responded to a rise or fall in the populatipn at each'successive Census. The above map illustrates the varying densities of the Mahals of the St~t~. Roughly speaking the Coastal ~ahals are denser than al! the re~t ~xcept LIlia and Sihor, the Mahal of Daskrol being the densest. Its high denSity IS due to the inclusion of the populous City of Bhavnagar. The Bhal forms a Tappa of the 1. S,~IiIu, B",o, :rou, p. 81~ QUQt~ by Prof. Brij Naroi~ in his PopulatiOI' o/India. p. 62.
Da~kroi Mahal, but it has been purposely kept blank to show it:: sparseness. Because it will be hardly fair to attribute the denseness of the whole Mahal which ,contains 192 persons per square mile toa part which contains only 18. The effe;ct of the fertility of soil is noticeable in the Lilia Mahal. Net variation in its increase since 1881 is 20'7 per cent. compared to 58 per cent. for Botad and yet it is denser than the latter. Even with all this expansion duing recent years the mean density of Botad comes up only to 157 persons per square mile j whr;reas the density of the fertile Mahal of Lilia is 171 and was 181 in 1891. Similarly the combined effect of fertility and of inadequacy of rainfall upon the density of a locality is vividly illustrated by the Mahal of Gadhada which has been continuously SUbjected to decreasing rainfall. From the point of net variation since 18Bl, very little difference in the population of the Mahals of Gadhada and Lilia is found. For, while the former registers a net increase of 143 souls, the latter shows a deficit of 148. But the differences in their densities are very great. The lowest density of Gadhada is found to be 104 in 1901, and that of Lilia to be 153 in 1921 jwhereas their highest densities were 134 and 181 respectively in 1891. These two Mahals which show very little divergence in the net variation of their population, point out to a very striking divergence in the fif,'1lres of their mean densities, owing to differences in climatic and soil conditions. The same phenomenon operates to its logical extent in the saIt fiat of Bhal which is totally unhealthy and unfit for cultivation. 51. Again the striking connection between rainfall and density will be seen from the margin which gives the figures of density and of the decennial average rainfall of each of the Mahals. The order of Mahals according to rainfall more or less follows the same order as that of density, with the exception of the Mahal of Daskroi whose density is in the main affected by con' siderations other than those of rainfall, as it includes the figures for the City of Bha vnagar. So barring Daskroi, Talaja which is the first from the point of rainfall is the first also in the order of density, and Gadhada which is the last from
is the last also in ~he order of density. Mahuva, Sihor' and Victor maintain the same order both 10 respect of rainfall and density j but not the, remaining Mahals. For, the Mahals of Lilia, UmraIa, Kundla and Botad whose decennial averages vary from 19,03 to 19'63 inches change places amongst themselves and do, not follo~v exactly the same order as rainfall. Lilia which is eighth from the pomt of raI,":fall naturall~ stan,ds, fifth from the point of density owing to its greater fert,lltty. But thi~ vanation on~y cautions us against assuming any the ,clo~~ relatIOn between ramfall and denSIty. Because a high rainfall in the hills of l\~l,tialaort~e salt, flat of the Bhal will not by itself affect their density. Nor will fertlltty avail Itself 10 the absence of adequate rainfall What really matt ' f,e r t'1l e SO'L, Iacco'mpdame by "tlm ely rams well distrib• uted over the. seasoe rs IS Iat, IS the total.number of e~c:ctive ra!ny days properly spread over the monsoo~'that: counts. EIther the fertil~ty or raInfall alone will not explain the phenomenon of •a great~r or lesser d~nslty. To these must also be added the factors of the pro~rtions of the cul~lvable ar~ to the total, and of the cultivated area to the, .culuvaJ:!le, ,all of :which combme to make up the environment of a locality and ,determme Its deDSity. ~
