Elections in India: behaviour and trends (historical)
This is a collection of articles archived for the excellence of their content. Readers will be able to edit existing articles and post new articles directly |
Contents |
Sources include
One MP for 16,00,000 voters
Mind the gap: 1 MP for 16L voters
Keeping In Touch With Electors Tough
Subodh Varma | TIG
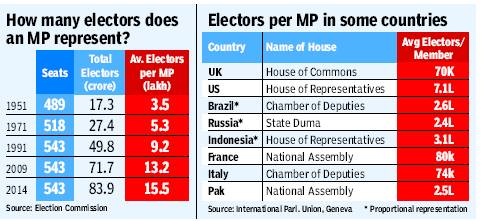
For the 2014 general elections, over 84 crore/ 840 million people are registered as voters as per the latest Election Commission figures. They will elect 543 MPs. That means on average, each MP represents over 15.5 lakh voters. That’s almost four and a half times the number of voters per MP in the first general elections held in 1951-52.
Voters have been increasing because population is increasing. But the number of seats in Lok Sabha has not increased since 1977. As a result, an MP has to represent more and more people with each passing election.
This anomaly gets stranger if you look at statewise averages of voters per MP. For the coming election, a Rajasthan MP will represent nearly 18 lakh voters on average, while one from Kerala will represent just 12 lakh voters. This is among the bigger states, not counting the smaller states and UTs where MPs can get elected with as low an electorate as 50,000 as in Lakshadweep or four to eight lakh in the Northeast.
In the 2008 delimitation, standardization of constituencies did not take place as it would have meant creating more constituencies in states like Rajasthan or Bihar with higher population growth rates, and cutting down in states like Tamil Nadu or Kerala with lower population growth, says election expert Sanjay Kumar, director of New Delhi-based think tank Centre for Studies of Developing Societies.
“It would have meant penalizing states that have successfully restricted their population. This was not fair,” he explained.
So, constituency numbers were kept the same within states, leading to the present anomalous ratio of voters per MP. Nowhere in the world is there such a high ratio of voters per elected representative. The closest would be the US where the average number of voters per House of Representatives member is about 7 lakh.
All this leads to an increasing disconnect between people and elected representatives, turning serious as elections approach. In two weeks candidates have to somehow contact 15 lakh people. With increasing restrictions on overt spending – on posters, vehicles or public meetings – the dynamic of contesting elections is fast changing. And so is covert spending. Increasing use of electronic media or Web-based platforms is also driven by this compulsion.
Once the MP is elected, the responsibility of staying in touch with the voters also is more difficult.
Although the MP is not supposed to be looking after day-to-day issues like roads or drinking water or whether doctors are there in health centres, in India’s topsy turvy democracy it doesn’t work like that.
“People expect their elected representatives to solve everything. They don’t make a distinction between what an MP is responsible for and what a local councillor is supposed to do,” says Kumar.
In reality, the elected representatives too don’t follow these distinctions when it comes to promises, so the people can’t be blamed.
So, what is the solution? In the future, there is no option but to increase the number of seats in the Parliament opines Kumar. But for now, the unwieldy electoral system will have to bumble along.
Candidates elected by at least 50% of the voters
Only 120 winning candidates in ’09 got over 50% votes
TIMES NEWS NETWORK
New Delhi: Is our democracy truly representative? Election Commission (EC) data on percentage of votes secured by winning candidates shows it may not be so. In the 2009 general elections, only 120 winning candidates out of the 543 could secure 50% or more votes polled in their respective constituencies.
This meant that on remaining 423 seats (nearly 78% of seats), the winning candidates had the approval of less than half of the electorate. Elections to the Lok Sabha are carried out using the first-past-the-post electoral system, in which the candidate securing the maximum votes of the total votes polled is declared elected, irrespective of the percentage of votes polled or the total number of eligible voters.
The EC data has a silver lining though. Delhi, Rajasthan, West Bengal, Kerala, Gujarat and Maharashtra are some of the better states in terms of consolidation of votes in the favour of winning candidates. While Delhi had six out of seven candidates winning more than 50% votes, Rajasthan was second best with 15 of the 25 winning candidates in that category.
Half of the 42 winning candidates in West Bengal secured the approval of more than 50% of the electorate. Among the worst performing states is Andhra Pradesh where only one out of 42 candidates could get more than 50% votes polled.
DELHI TOPS
Delhi first in vote consolidation, Rajasthan second
Half of the 42 winning candidates in Bengal got over 50% votes
Andhra the worst with only one out of 42 getting over 50% votes
Corruption does not bother the voter
Is graft really a big election issue? Stats say otherwise
Deeptiman Tiwary TNN
New Delhi: Is corruption really an issue in elections? Some surveys claim people worry more about the economy than corruption. Data for 2004 and 2009 general elections show that not only do parties continue to repeatedly field candidates facing graft charges, people even vote for them.
Analysis of affidavits filed by Lok Sabha candidates shows that in 2004, parties fielded a total of 12 candidates facing cases under Prevention of Corruption Act (PCA). Of them, nine won. In 2009, 15 candidates with PCA cases were in the fray with four emerging victorious. Both elections combined, 27 such candidates contested and 16 of them won — a success rate of almost 60%.
Data also shows only one of 2004’s winners (SP’s Rashid Masood) with graft cases lost in 2009. Of the nine winners in 2004, only three (including SAD’s Rattan Singh and RJD chief Lalu Prasad) contested in 2009. Among other winners of 2004, BSP chief Mayawati was UP CM at the time of the 2009 polls and SAD’s Sukhbir Singh Badal was Punjab deputy CM. One candidate died while others did not contest.
A recent survey by Lok Foundation and University of Pennsylvania’s Centre for Advanced Study of India says corruption has found some traction with voters this election, but is still at second position compared to economic growth.
Social and political theorist and Centre for the Study of Developing Societies professor Aditya Nigam says though people seemed to have accepted graft as a part of life until recently, this election could be different. “Giving bribes at every step for decades had made people accept corruption as their destiny. But the Anna Hazare-led anti-corruption movement and Arvind Kejriwal’s AAP have changed that feeling. Economic growth is too abstract an idea to attract masses unless someone breaks it down for them.”
Opinion polls in India
Why opinion polls are often wide of the mark/ Poor Don’t Always Reveal Their Mind, Middle Class Vocal Atul Thakur | TIG The Times of India
An analysis of past five general elections shows that opinion polls tend to overestimate BJP, underestimate Cogress and at times go very wrong in assessing regional and smaller parties.
2009
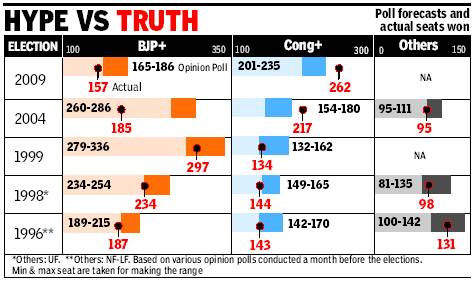
For instance, in 2009, pollsters predicted a near neck-and-neck fi ght between Cogress-led UPA and BJPheaded NDA. It was a general consensus among various poll pundits that although UPA had an edge over NDA, the latter could not be written off. If we take the minimum and the maximum seat forecast of opinion polls, conducted just before the elections, it works out that UPA was supposed to get between 201 and 235 seats while the corresponding numbers for NDA was between 165 and 186 seats. The individual forecast for India’s two largest parties ranged between 146 and 155 for Cogress and from 137 to 147 for BJP.
The actual results surprised everyone—pollsters, media and parties. UPA got 262 seats while NDA was confined to just 157. Party-level predictions also went completely wrong—Cogress went ahead to win 206 seats while BJP could manage to bag just 116 Lok Sabha seats.
2004
For BJP, the 2009 results was perhaps a scaled-down replica of the 2004 debacle. After the good showing in assembly elections in four states, the NDA government decided to go for early polls. Initial opinion polls suggested that NDA was going to sweep the elections. According to poll results of India Today-ORG Marg, published in February 2004, NDA was supposed to get 330-340 seats while Cogress and allies were to be confined to 105-115.
Later the predictions were revised to 260-286 for NDA and 154-180 for Cogress and allies. Then PM Atal Bihari Vajpayee became so confident by what the opinion polls had to say that in an April 17 rally at Nagpur (three days before the elections), he expressed his discomfort with the coalition government and said, “My worry now is, if we are again saddled with a 22-party coalition... such a situation is better avoided.” Perhaps he was indicating that it would be easier to govern the country if his party secured a majority. The results, however, shocked BJP as NDA was reduced to 185 seats, while Cogress and allies won in 217 constituencies.
1999
In the 1999 elections as well, the initial poll predictions suggested that NDA would emerge a clear winner. An opinion poll conducted by DRS for TOI for the August 5-9 period—about a month before the elections—suggested that NDA would get 332 seats while Cogress and allies would manage only 138. India Today-Insight opinion poll also confi rmed TOI’s prediction, giving 322-336 seats to NDA and 132-146 to Cogress and allies. Both opinion polls suggested that BJP and Cogress would increase their individual tally by cutting into the votes of regional parties.
The newspapers were full of stories about a “Vajpayee wave”, which was the focus of BJP’s election campaign. A news report based on TNS MODE survey even suggested that Sushma Swaraj was going to beat Sonia Gandhi in Bellary. The estimates were later revised to 279-336 for NDA and 132-162 for Cogress and allies—much closer to the actual results. Swaraj, however, lost from Bellary and state parties won 162 seats.
1998 and 1996
Opinion polls for 1998 and 1996 elections were, however, closer to the actual results.
Why do opinion polls go wrong in India?
Why do opinion polls tend to favour a particular coalition while underplaying others? First, unlike Western countries, India’s population is not homogeneous—caste, religion and region play an important factor in elections. Also, people, particularly from the weaker section of society, are reluctant to reveal which party they are going to vote. BJP might be getting overplayed because the main support base of the party is the middle class—a section which is not afraid of any post-election harassment and hence they are vocal in sharing their views. On the contrary, key voters of other parties are from vulnerable sections of society and hence they are afraid to share their opinion.
Experts also argue that opinion polls work much better in bipolar elections. In India, where elections are multi-cornered, it is possible that pollsters fail to estimate the strength of regional parties.

