Cleanliness ranks of Indian cities, districts: 2018
This is a collection of articles archived for the excellence of their content. |
Contents |
2018 ranks
Graphic: in a nutshell

From: May 17, 2018: The Times of India
See graphic:
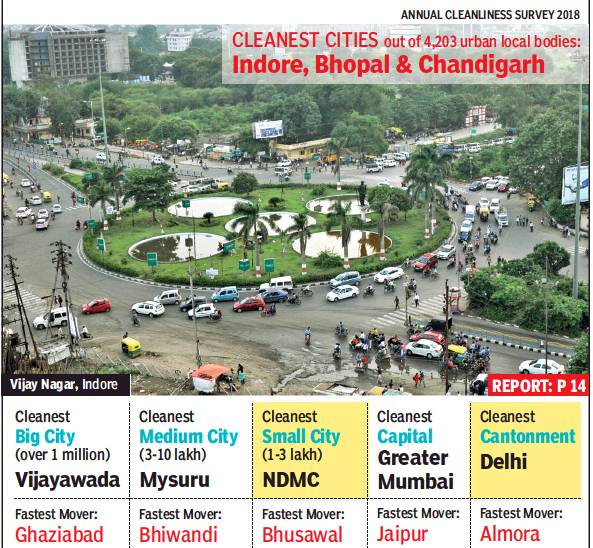
The highlights of the annual cleanliness survey, 2018
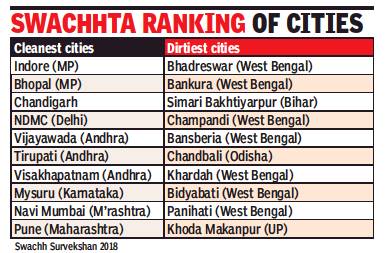
The best and worst cities
Dipak Dash, ‘Bengal home to seven dirtiest municipal areas’, June 24, 2018: The Times of India

From: Dipak Dash, ‘Bengal home to seven dirtiest municipal areas’, June 24, 2018: The Times of India
Indore, Bhopal Retain Cleanest City Tag: Survey
West Bengal is home to seven of the ten dirtiest municipal areas in India while Uttar Pradesh has three dirtiest cities, including Khoda Makanpur in Ghaziabad district, according to the latest cleanliness ranking of municipalities by the Centre. Two municipal areas from Bihar and one from Odisha have also been ranked as the among the dirtiest.
Gonda in UP, which ranked 434 and was the dirtiest municipal area in 2017 survey, has climbed up to 228 among the 485 municipalities having more than one lakh population. West Bengal for the first time participated in the Swachh Survekshan this year, covering 4,203 municipal areas across the country. The report was released by PM Narendra Modi on Saturday.
Indore and Bhopal retain their earlier top two positions. While three cities — Chandigarh, Pune and Vijayawada — have made it to the list of best 10 urban areas. Surat, Tiruchirappalli and Vadodara have been pushed back. Chandigarh climbed to the third rank this year against its earlier rank of 11 while New Delhi Municipal Councilimproved its position to occupy the number 4 slot as compared with the seventh position in 2017. Tirupati has jumped to number six as compared to its ninth position last year while Navi Mumbai slipped by one rank to number nine. Mysuru’s has tumbled from number five to number eight in this year’s survey. The PM’s constituency of Varanasi has improved its position from 32 in 2017 to 29 this year.
The housing and urban affairs ministry said the an nual survey is aimed at bringing greater competition among urban local bodies to do more to make cities cleaner. The assessment of ‘swachhta’ involving citizens’ feedback in one year was termed as one of the biggest-ever surveys undertaken by any government across the globe.
Modi said the dream of a clean India is not far away. “During the past four years, we have built more than 8.3 crore toilets in rural and urban areas,” he said.
Individual regions
Bengaluru: Why it is not in the list
HIGHLIGHTS
Experts blame the assessment parameters of Swachh Survekshan for Bengaluru’s poor show
The survey focused more on surface cleanliness rather than ensuring sustainability
The list of cleanest cities in India has been made public by the Union ministry for housing and urban affairs, but Bengaluru has failed to feature among the top three despite being known as the most dynamic city. Why?
This has been the most discussed poser in civic corridors after the Swachh Survekshan 2018 results were declared two days ago. The survey covered 4,041 cities and urban local bodies and the parameters to adjudge cities included collection and transportation of waste, processing and disposal, sanitation, no open defecation and behavioural change brought about by information, education and communication.
Experts blame the assessment parameters for Bengaluru’s poor show, saying more weightage has been given to things like dustbins and hoardings instead of sustainability being achieved via long-term measures. Sandhya Narayan, member of the solid waste management round table, said though the blueprint of the micro plan remained largely on paper, there should have been a special mention of Bengaluru’s waste-processing capacity.
“I don’t think a good ranking could have been expected considering that a turnaround would have to be achieved in just a year. The assessment parameters of the survey are flawed to an extent: A lot of emphasis was given to dustbins in public areas but when waste is not collected and transported, the dustbins overflow and become black spots. The survey focused more on surface cleanliness rather than ensuring sustainability,” she said.
Adding that the feedback section of the survey is also questionable as citizens don’t know much about the ground reality, Narayan highlighted another problem — that of scale. “Cities with a population of 10 lakh can’t be compared to a city housing 100 lakh people. I’m not absolving BBMP of any responsibility, but problems in evaluation exist. We should have got a special mention for our comprehensive micro plan as well as our processing potential, which is presently at 2,300 tonnes,” she said.
The micro plan, launched by the health and solid waste management wing of BBMP’s health department last year, divided each ward into blocks of 750 households with designated facilities for each block.
Door-to-door collection
Swati Singh Sambyal, programme manager, waste management, Centre for Science and Environment, said cities should be evaluated on more than door-to-door collection systems. “In the 52 categories, a majority of the cities are only visibly clean with no appropriate systems for processing and disposal. They continue to indiscriminately dump waste in under-functional processing sites/landfills,” shesaid.
See also
Cleanliness ranks of Indian cities, districts: 2014-15
Cleanliness ranks of Indian cities, districts: 2016
Cleanliness ranks of Indian cities, districts: 2017
Cleanliness ranks of Indian cities, districts: 2018