Exports, imports (international trade): India
(→2013-16) |
(→2013-16) |
||
| Line 66: | Line 66: | ||
In a separate reply , she said India's exports have been adversely affected by recessionary trends across the globe, including in the EU and the US. India's agriculture exports during April-February 2016 worked out at $18.8 billion as against $18.7 billion in 2014-15, the minister said. | In a separate reply , she said India's exports have been adversely affected by recessionary trends across the globe, including in the EU and the US. India's agriculture exports during April-February 2016 worked out at $18.8 billion as against $18.7 billion in 2014-15, the minister said. | ||
| + | |||
| + | ==2014-17== | ||
| + | [[File: India’s external trade, 2014-17, FDI inflows, 2013-17.jpg| India’s external trade, 2014-17; <br/> ii) FDI inflows, 2013-17 <br/> From [http://epaperbeta.timesofindia.com/Gallery.aspx?id=04_09_2017_015_027_010&type=P&artUrl=Focus-on-jobs-export-push-Prabhu-04092017015027&eid=31808 The Times of India], September 4, 2017|frame|500px]] | ||
| + | |||
| + | See graphic, ' India’s external trade, 2014-17' | ||
==Nov 2016-April 2017== | ==Nov 2016-April 2017== | ||
Revision as of 00:54, 5 September 2017


This is a collection of articles archived for the excellence of their content. |
Contents |
Vulnerable India's trade-GDP ratio higher than US, China's
The Times of India, Aug 30 2015
Atul Thakur
India's trade-GDP ratio higher than US, China's Country
More vulnerable to global crises
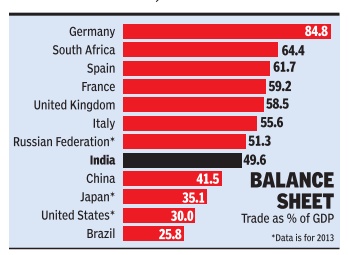
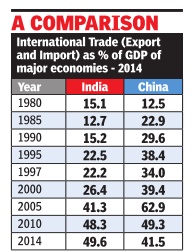
Historically, India has been viewed as being far less vulnerable to global financial crises than other large economies because it was much less integrated with the global economy than countries like, say , the US or China. Today , however, at least as far as trade goes, the opposite is true. World Bank data shows that in 2014 India's total trade (exports plus imports) was equivalent to about 50% of its GDP. This was higher than the trade to GDP ratio of the US, Japan or China. Dur ing the 1997 Asian financial crisis, which India escaped relatively unscathed, total foreign trade was equivalent to only 22.2% of the country's GDP.
One way to measure the extent to which an economy is globally linked is by comparing its international trade with its GDP. By this yardstick, India's aggregate exports and imports of goods and services was 49.6% of the country's GDP in 2014, compared to China's trade to GDP ratio of 41.5% for the same year. In 2013, the year till when Bank data is available for the US and Japan, international trade was about 30% of GDP for America and 35.5% for the Japanese economy . Of course, the US, China and Japan are far larger economies than India at the nominal exchange rate and hence a lower trade ratio doesn't mean their trade volumes are lower than India's.
The data shows that among major economies, countries of Western Europe have the highest degree of integration with the global economy . For instance, the ratio was 84.8% for Germany , Europe's largest economy . For the UK, Italy , Spain and France, trade was about 60% of GDP .
Three decades ago, in 1984, China and India had a similar degree of globalization with the trade to GDP ratio 16.6% for China and 13.8% for India. The Chinese economy experienced exponential growth thereafter and it was reflected in the growth of its international trade as well.The trade to GDP ratio steadily increased to a peak of 64.8% in 2006. Since then it has been decreasing as China's domestic market has expanded with increased per capita incomes.
India, on the other hand, continues to be in a phase where its global trade expands at a faster pace than its economy , resulting in a steadily climbing trade to GDP ratio.
2012-13: Export of creative goods and services
The Times of India, September 25, 2015
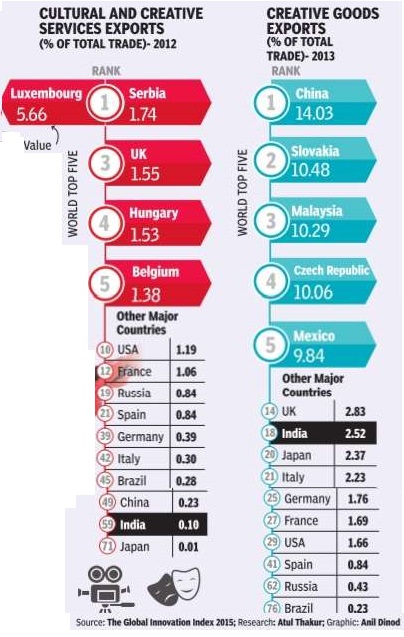
India's soft power through the export of entertainment movies, music, television sitcoms and cricket -is indisputable. Data on the export of creative goods and services as a proportion of total exports, however, suggests it is a bit overrated. According to the recently released global innovation index, India was 59th in the world in the export of cultural and creative services (audio visual and other recreational services). In exports of creative goods (merchandise, processing and repairs of goods categorised as creative), India is ranked 18th.Interestingly, China is ranked above India in both these categories.
Trade deficit
2005-16
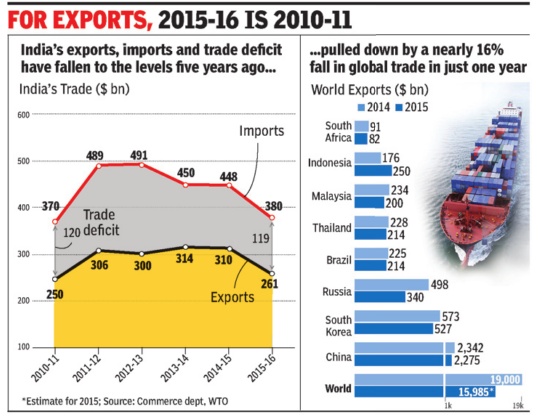
See graphic
2013-16
The Times of India, May 10 2016
India has trade deficit with 27 countries
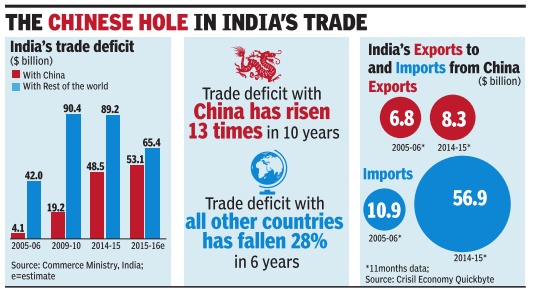
India has a trade deficit with as many as 27 major countries, in cluding China, Australia, Iraq and Iran, during the last three years. With these countries, India has trade deficit continuously during the last three years, commerce and industry minister Nirmala Sitharaman said in a written reply to the Lok Sabha.
She said India generally runs a deficit with those countries from which highdemand commodities are sourced. These include items like crude oil, gold, diamond and fertiliser.
In 2015-16, India's trade deficit fell 14% to $118.4 billion. Other countries with which India has a trade gap include Indonesia, Korea, Germany , Canada, Taiwan, Russia and Ukraine.
In a separate reply , she said India's exports have been adversely affected by recessionary trends across the globe, including in the EU and the US. India's agriculture exports during April-February 2016 worked out at $18.8 billion as against $18.7 billion in 2014-15, the minister said.
2014-17
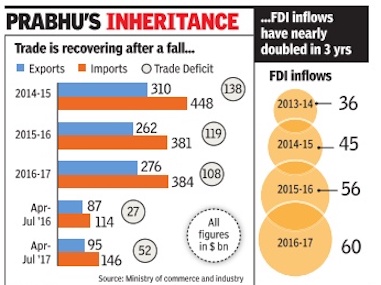
ii) FDI inflows, 2013-17
From The Times of India, September 4, 2017
See graphic, ' India’s external trade, 2014-17'
Nov 2016-April 2017
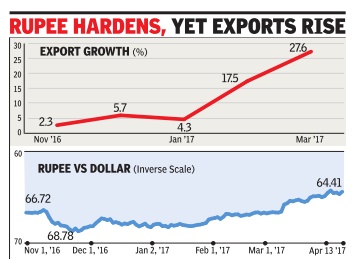
See graphic.
