Government finances: India
(→What the taxes were spent on, 1997-2018) |
(→What the taxes were spent on, 1997-2018) |
||
| Line 158: | Line 158: | ||
''Interest Payment to Tax Revenue, 1997-2018'' | ''Interest Payment to Tax Revenue, 1997-2018'' | ||
| − | ==1997-2018: == | + | ==1997-2018: Pensions to Total Expenditure, 1997-2018== |
[[File: Pensions to Total Expenditure, 1997-2018.jpg|Pensions to Total Expenditure, 1997-2018 <br/> This is the money government spends on pensions to retired employees, as a proportion of its total spending.Data source: Government of India budget documents<br/> From: [https://timesofindia.indiatimes.com/business/india-business/budget/data-hub January 29, 2018: ''The Times of India'']|frame|500px]] | [[File: Pensions to Total Expenditure, 1997-2018.jpg|Pensions to Total Expenditure, 1997-2018 <br/> This is the money government spends on pensions to retired employees, as a proportion of its total spending.Data source: Government of India budget documents<br/> From: [https://timesofindia.indiatimes.com/business/india-business/budget/data-hub January 29, 2018: ''The Times of India'']|frame|500px]] | ||
| Line 165: | Line 165: | ||
''Pensions to Total Expenditure, 1997-2018'' | ''Pensions to Total Expenditure, 1997-2018'' | ||
| − | ==1997-2018: == | + | ==1997-2018: Subsidies to Total Expenditure, 1997-2018== |
[[File: Subsidies to Total Expenditure, 1997-2018.jpg|Subsidies to Total Expenditure, 1997-2018 <br/> Subsidies are any good or sevice provided below costs to sections of people as part of its duty (for example, on fertilisers, train tickets, LPG or metro rail fares in big cities). This chart measures the amount it spends on subsidies as a proportion of its total spending.Data source: Government of India budget documents <br/> From: [https://timesofindia.indiatimes.com/business/india-business/budget/data-hub January 29, 2018: ''The Times of India'']|frame|500px]] | [[File: Subsidies to Total Expenditure, 1997-2018.jpg|Subsidies to Total Expenditure, 1997-2018 <br/> Subsidies are any good or sevice provided below costs to sections of people as part of its duty (for example, on fertilisers, train tickets, LPG or metro rail fares in big cities). This chart measures the amount it spends on subsidies as a proportion of its total spending.Data source: Government of India budget documents <br/> From: [https://timesofindia.indiatimes.com/business/india-business/budget/data-hub January 29, 2018: ''The Times of India'']|frame|500px]] | ||
Revision as of 21:16, 31 January 2018
This is a collection of articles archived for the excellence of their content. |
Budget deficit
Estimated and actual deficits, 2015-17

From: Surojit Gupta, January 29, 2018: The Times of India
See graphic:
Estimated and actual budget deficits, 2015-17
Fiscal deficit
2015-16
The Times of India, Jun 01 2016

The government managed to rein in fiscal deficit marginally below the revised estimate for 2015-16, despite mopping lower than budgeted taxes. But, it also meant that the finance ministry had to curtail spending below the revised estimates for the last financial year. With the provisional estimate of GDP higher than the advance estimate, the Centre's fiscal deficit was estimated at 3.92% of GDP compared to 3.94% in the revised estimate. Against the revised estimate of Rs 5.35 lakh crore of fiscal deficit, the Centre closed the year with a deficit of Rs 5.32 lakh crore, data released by the controller general of accounts showed.
Fiscal deficit is the difference between the government's total spending and receipts, which include tax, non-tax revenue as well as capital receipts such as proceeds from disinvestment.
This was the second year in a row that the government met the fiscal deficit target, but it did not have to significantly cut spending to meet the projections. With private sector investment remaining subdued, the government has been forced to step up public expenditure and lower oil subsidies last year helped keep keep deficit under check.
The government, however, slipped marginally on revenue deficit, which brea ched the revised estimate of Rs 3.41 lakh crore to close the year at a little over Rs 3.42 lakh crore. Revenue deficit is the difference between receipts and expenditure, such as interest payments and other spending to keep assets running. The government is hoping to meet the deficit targets during the current financial year too.
“The fiscal space available to enhance capital spending in 2016-17 has been limited by the Pay Commission and OROP-related (one-rank, one-pension) commitments, despite the revenue augmentation measures introduced in the Budget for 2016-17. The evolving buoyancy of tax and non tax revenues during the current fiscal would critically impact the headroom available to the government to boost spending on identified priorities such as infrastructure creation and PSU bank recapitalization,“ said Aditi Nayar, senior economist at ratings agency ICRA
2016-17: Target of 3.5% deficit was met
Govt meets 3.5% fiscal deficit target for 2016-17, June 1, 2017: The Times of India
The government on Thursday said it has achieved the fiscal deficit target of 3.5% of GDP in 2016-17.
“Fiscal deficit is 3.51% of GDP or Rs 5.35 lakh crore in 2016-17,“ the Controller General of Accounts (CGA) said while releasing the provisional accounts for the last financial year.
For 2017-18, the government aims to further bring down the fiscal deficit -the gap between expenditure and revenue -to 3.2%. The CGA further said that revenue deficit during the last fiscal was 2.02% of GDP. As per provisional data, the fiscal deficit in April 2017 was Rs 2.05 lakh crore, which is 37.6% of the Budget estimate, as against 25.7% in the yearago period. Total expenditure of the government in April was Rs 2.42 lakh crore, or 11.3% of the full-year estimate.
Revenue collection was Rs 35,081 crore, or 2.3%, of the estimate. Total receipts of the government -from revenue and non-debt capital -in April stood at Rs 36,529 crore. Revenue deficit during the month was Rs 1,78,383 crore, or 55.4%, it said. Revenue deficit refers to the shortfall in total government revenue realisation from targeted figure.
Tax base
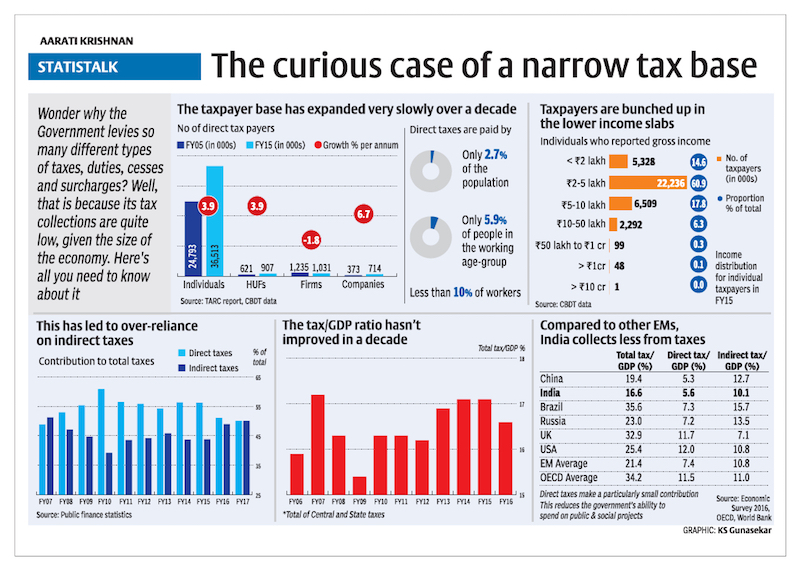
The curious case of a narrow tax base:FY05-FY15
Please see graphic
40% Of Indirect Taxes are From petrol, diesel
Mopped Up 40% Of Indirect Tax Kitty From Fuels
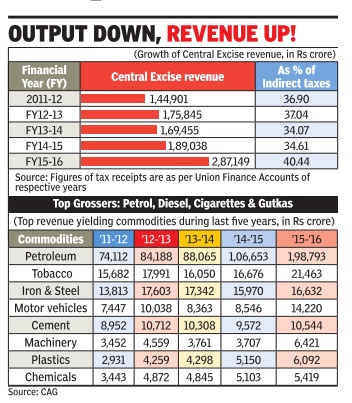
The massive jump in excise duty on petrol and high speed diesel helped the government mop up nearly 40% of its indirect tax kitty from the two auto fuels in 2015-16, compared to 34% in the previous financial year.
A study by the Comptroller and Auditor General (CAG) showed that Union excise duty collection shot up almost 70% from Rs 1.69 lakh crore during 2013-14 to Rs 2.87 lakh crore in 2015-16, with a majority of the contribution being from petrol, diesel, cigarettes and gutka. The indirect tax kitty includes duties from customs, central excise and service tax.
Excise revenue from petroleum products, which made up for 52% of collections in 2013-14, went up to almost 69% during 201516 as the government resorted to a massive increase in levies in the wake of falling global prices.
The central excise duty on petrol and high speed diesel increased from Rs 1.2 per litre and Rs 1.46 per litre to Rs 8.95 per litre and Rs 7.96 per litre respectively during the last two financial years. Revenue from petroleum products went up from Rs 88,000 crore in 2013-14 to Rs 1.99 lakh crore in 2015-16. Tax on sin goods (mainly tobacco products) at Rs 21,000 crore was second highest contributor to indirect taxes.
Compared to countries like Pakistan and Sri Lanka, India has one of the highest retail prices of fuel oil in the subcontinent. The high price of petrol and diesel in India was contrary to the international trend in crude oil prices that crashed from a high of $112 a barrel in 2014 to as low as $30.
Though the lower oil prices substantially reduced India's oil bill as the country depends on 80% imports, domestic prices were kept high by increasing central excise duties. The excess revenue earned was meant to fund government's social sector schemes. The CAG, which tabled its report in Parliament on Friday, however, highlighted the issue by pointing out how the government has been losing major revenue by giving exemptions to industry . The revenue forgone on account of different exemptions come up to more than Rs 2 lakh crore a year which the auditor has said need to be rationalised.
The revenue forgone for FY2016 on excise duties was Rs 2.25 lakh crore -Rs 2.06 lakh crore as general exemptions and Rs 19,000 crore as area-based exemptions. This was over 78% of total revenue earning from central excise.
The auditor has observed that though the main objective behind issue of exemption orders is to deal with circumstances of exceptional nature, but this objective was not properly defined. “As such, the duty forgone on account of issue of special exemption orders is not being calculated towards revenue forgone figures,“ it noted.
Where the taxes came from, 1997-2018
2017 was a watershed year for India with GST completely changing the way we pay our taxes. Click on the dropdown menu above for more details on how the Government of India gets it money and choose the trend you want to see: personal income tax, corporate taxes, service tax, excise or custom duties.
All sources

Tax revenue is the government’s income from different kinds of taxes: direct taxes (personal income tax and corporate tax) accounted for 51.3% of total revenues in 2016-17 and the rest came from indirect taxes. Because of the introduction of GST from July 2017, the government’s revenues are undergoing a makeover from this year as all indirect taxes (with the exception of customs duties) are now decided by the GST Council and not the Government of India.Data source for this chart: Government of India budget documents
From: January 29, 2018: The Times of India
See graphic:
Tax revenue is the government’s income from different kinds of taxes
1997-2018: Corporate Tax to Tax Revenue

This is the proportion of tax revenue that comes from company profits.Data source for this chart: Government of India budget documents
From: January 29, 2018: The Times of India
See graphic:
Corporate Tax to Tax Revenue, 1997-2018
1997-2018: Customs to Tax Revenue

Revenues from import duties are the only major indirect tax that the Government of India still controls after the introduction of GST in July 2017.Data source for this chart: Government of India budget documents
From: January 29, 2018: The Times of India
See graphic:
Customs to Tax Revenue, 1997-2018
1997-2018: Excise Duties to Tax Revenue
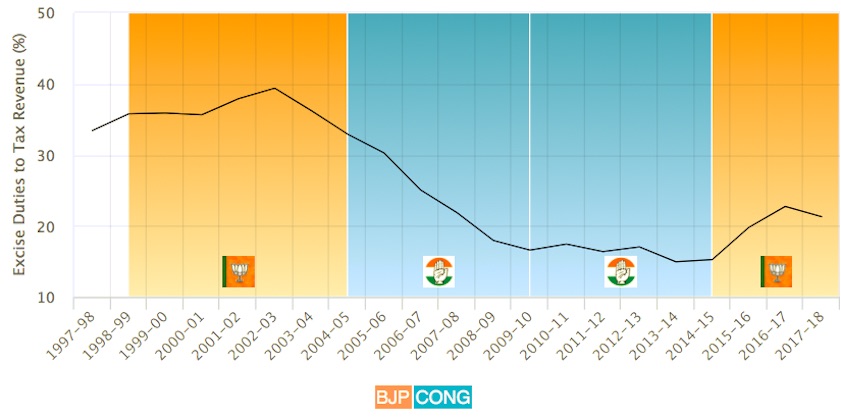
This the contribution to government funds that comes from taxes on manufacturing.Data source for this chart: Government of India budget documents
From: January 29, 2018: The Times of India
See graphic:
Excise Duties to Tax Revenue, 1997-2018
1997-2018: Personal Income Tax to Tax Revenue

This is the proportion of tax revenue that comes from the incomes of Indian citizens. Data source for this chart: Government of India budget documents
From: January 29, 2018: The Times of India
See graphic:
Personal Income Tax to Tax Revenue, 1997-2018
1997-2018: Service Tax to Tax Revenue

This the contribution to government funds that comes from taxes on services (like say eating out in restaurants, on mobile phone bills, for upscale hair dressing etc).Data source for this chart: Government of India budget documents
From: January 29, 2018: The Times of India
See graphic:
Service Tax to Tax Revenue, 1997-2018
What the taxes were spent on, 1997-2018
All-expense heads

This chart explains how and where the Government of India spends its money.Data source: Government of India budget documents
From: January 29, 2018: The Times of India
See graphic:
What the taxes were spent on, 1997-2018
1997-2018: Capital Expenditure to Total Expenditure

This is the spending by government on investments in long-term projects that give future economic returns like highways, ports, electicity grids etc. as a proportion of its total spending.Data source: Government of India budget documents
From: January 29, 2018: The Times of India
See graphic:
Capital Expenditure to Total Expenditure, 1997-2018
1997-2018: Defence Spending to Total Expenditure
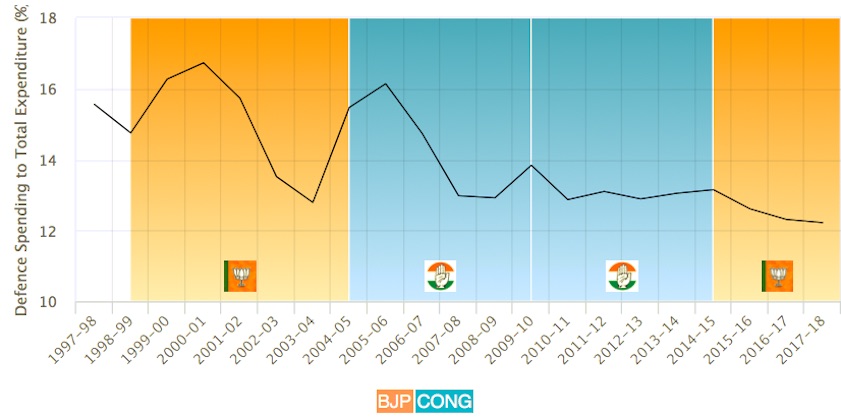
This is the spending by government on defence as a proportion of its total spending. Data source: Government of India budget documents
From: January 29, 2018: The Times of India
See graphic:
Defence Spending to Total Expenditure, 1997-2018
1997-2018: Defence Spending to Total Expenditure

This is the money government pays as interest on all its oustanding debt on past borrowings which haven’t yet been paid back, as a proportion of its total spending.Data source: Government of India budget documents
From: January 29, 2018: The Times of India
See graphic:
Interest Payment to Total Expenditure, 1997-2018
1997-2018: Interest Payment to Tax Revenue

This measures how much the Indian government pays on interest as a proportion of its tax revenues. Think of this as the amount you pay in interest on loans for every Rs. 100 you earn.Data source: Government of India budget documents
From: January 29, 2018: The Times of India
See graphic:
Interest Payment to Tax Revenue, 1997-2018
1997-2018: Pensions to Total Expenditure, 1997-2018

This is the money government spends on pensions to retired employees, as a proportion of its total spending.Data source: Government of India budget documents
From: January 29, 2018: The Times of India
See graphic:
Pensions to Total Expenditure, 1997-2018
1997-2018: Subsidies to Total Expenditure, 1997-2018
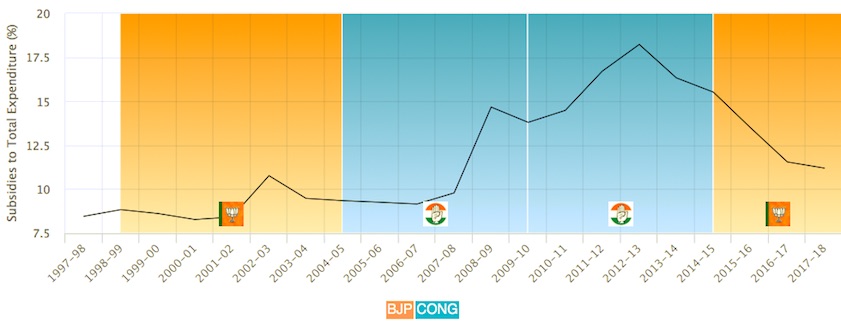
Subsidies are any good or sevice provided below costs to sections of people as part of its duty (for example, on fertilisers, train tickets, LPG or metro rail fares in big cities). This chart measures the amount it spends on subsidies as a proportion of its total spending.Data source: Government of India budget documents
From: January 29, 2018: The Times of India
See graphic:
Subsidies to Total Expenditure, 1997-2018
See also
Government finances: India