Air pollution: South Asia
This is a collection of articles archived for the excellence of their content. |
Impact
Impact on health, life expectancy
In 2018

From: Nov 9, 2019: The Times of India
See graphic:
The impact of Air pollution on life expectancy in Afghanistan, Bangladesh, India, Nepal, Pakistan and some other countries, presumably as in 2018.
Air pollution: the economic cost
‘Air pollution costing economy 3.75L cr a year’
Dipak Kumar Dash | TNN 2013/07/18
New Delhi: Outdoor air pollution in urban areas by itself claims 1.09 lakh lives of adults and 7,513 lives of children below 5 years, annually, says a latest report of World Bank. The study released on Wednesday revealed that the annual cost of environmental degradation in India is about Rs 3.75 lakh crores, which is equivalent to 5.7% of the country’s GDP.
The study commissioned by the central government has brought out how urban growth centres are choking and claims that outdoor and indoor air pollution have the maximum share of this annual burden on India’s economy. According to the estimates of the bank, outdoor air pollution accounts for 29% of this, followed by indoor air pollution (23%), cropland degradation (19%), water supply and sanitation (14%), pasture (11%) and forest degradation (4%).
The first national level economic assessment of environmental degradation in India focuses on particle pollution (PM10) from the burning of fossil fuels. This has serious health consequences, amounting up to 3% of India’s GDP and results in losses due to lack of access to clean water and sanitation, besides depletion of natural resources.
Pollution, region-wise
2014: Higher in North India than South
The Times of India Dec 28 2014
North India's cities the most polluted, south's cleanest Almost all of the most polluted cities in India are located in the north with Uttar Pradesh, Punjab and Rajasthan dominating the list, according to a WHO report on the most polluted cities in the world published in 2014. Incidentally, UP, Punjab and Delhi also lie in the fog belt of northern India and there's evidence to show that air pollution is worsening the problem. Early in 2014, TOI had reported on a study which found that average fog hours in the month of January in Delhi had increased by as much as eight hours since 1989 -a trend attributed to rising pollution.
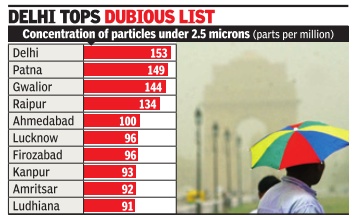
When the WHO report came out in May, 2014, much was made out of the fact that Indian cities dominated the list, with Delhi earning the dubious tag of the most polluted city in the world. But not as much attention was paid to the most polluted among Indian cities.
Of the worst 30 cities, UP laid claim to nine, Punjab to five and Rajasthan to four. Madhya Pradesh and Maharashtra had three cities each while J&K, Bihar and Uttarakhand had one each. Raipur in Chhattisgarh, Ahmedabad in Gujarat and Delhi rounded out the list. In all, 124 Indian data stations -mostly in cities -were featured in the WHO report.
On the other hand, the five cities with the cleanest air are all located in south India. Five Indian cities with the cleanest air were all in the south, a WHO study has found. Two were in Kerala (Kollam and Pathanamthitta), one in Karnataka (Hassan), one in Tamil Nadu (Madurai), and Pondicherry .
WHO used the concentration of particles in the air under 2.5 microns to determine how bad air pollution is. Such particles cause the most damage to health because when inhaled, they can penetrate deep into the lungs, whereas larger particles are generally filtered out before they reach that far. Pathanamthitta, the cleanest city on the list, recorded a concentration of 10 parts per million of particles under 2.5 microns. However, Delhi has a concentration of 153 parts per million of such particles -more than fifteen times that of Pathanamthitta.
Dr Gufran Beig, the director and chief scientist of System Air quality Forecasting and Research (SAFAR), said, “In addition to local sources of pollution, Indo-Gangetic cities also get pollution from neighbouring regions and other parts of India, so as a result the pollution level becomes very high.“ Because of the location of the Indo-Gangetic plains, climate conditions are such that air masses often converge in plains.
The Pollutants
EVERY BREATH YOU TAKE
Rukmini Shrinivasan | TIG
First the bad news: More than half of 130 Indian cities being monitored for air pollution are at critically polluted levels.
Now the good news: Air pollution in Indian cities has been proved to be reversible, with improvements in public transport or changing over to greener fuels, reducing pollution levels.
But, now the really bad news: With industries being relocated to the peripheries of cities, growing urbanization and poor scrutiny outside big cities, small towns are emerging as India’s pollution hotspots.
According to WHO estimates, roughly 0.1 million premature deaths annually can be attributed to air pollution. Exposure to air pollution causes both short-term and long-term health effects, from eye irritation and headaches to reduced lung capacity and lung cancer, with vehicular pollution being particularly harmful. The poor are the worst off, facing higher exposure and being unable to afford high healthcare costs. A 2005 World Bank report estimated that 13,000 lives and $1279 million were saved annually between 1993 and 2002 in five cities Delhi, Kolkata, Mumbai, Chennai and Hyderabad — as a result of measures taken to improve air quality.
A look at data for 2008 recorded by the Central Pollution Control Board (CPCB) shows that Indian cities are choked. Of the 130 cities monitored, 70 have hit levels defined as critical for the presence of PM10, tiny particles of less than 10 microns in size regarded as the most dangerous pollutant as they can go deep into the lungs. However, the top five cities are Ludhiana, Khanna (both in Punjab), Ghaziabad, Khurja and Firozabad (all in UP). Delhi, the city where judicial activism for cleaner air has led to the ejection of polluting industries, comes in at sixth place. The improvements in some major cities and the simultaneous emergence of several smaller towns as pollution hotspots shows that what we are seeing is national policy failure, says Anumita Roychowdhury, associate director of the CSE.
Northern India is far more polluted than the south, with Gobindgarh (Punjab), Kanpur (UP), Indore (MP) and Raipur (Chhattisgarh) rounding out the top-10 list. Some cities in south are showing rising PM10 trends — Hyderabad, Tuticorin, Bangalore and Coimbatore in particular. While particulate matter comes from a variety of sources, PM10 is largely from vehicles.
Eastern India, meanwhile, shows high levels of nitrogen dioxide which is fast emerging as a national challenge, according to the Centre for Science and Environment. In 1998, only five cities exceeded the national standards for presence of NO2. In 2008, 15 cities showed violations, most of them in eastern India: Howrah, Asansol, Durgapur and Kolkata have India’s highest NO2 levels. Increasing numbers of diesel cars, particularly in Delhi, is also a major cause of rising NO2 levels, according to the CSE.
The pollution control efforts in Indian cities show, however, that air pollution is not irreversible and this is not a lost battle. Public and judicial activism have resulted in eight cities — Delhi, Kanpur, Lucknow, Ahmedabad, Hyderabad, Bangalore, Chennai, and Sholapur being directly monitored by the Environment Pollution (Prevention and Control) Authority under Supreme Court orders. Mumbai and Kolkata are under the scrutiny of their high courts. According to a CSE report, Ahmedabad has reduced its PM10 levels by nearly 50%, Solapur (Maharashtra) by 57% and Chennai, Pune and Kolkata have stopped its growth.
Pollution levels have stabilized to some extent in some of these cities, but in the absence of aggressive action, these gains are in danger of being reversed. In Delhi, for example, the significant gains made from decades of public activism have been reversed and PM10, NO2 and ozone levels are rising fast according to CPCB data.
At the heart of the matter lies the fact that the bulk of pollution in Indian cities is caused by cars, and despite changes to greener fuels and improvements in public transport, direct curbs on number of cars on roads seems to be inevitable to manage pollution. In Delhi alone, 1100 vehicles are being added to the city’s five million every day, with car ownership growing at 10% annually since 1995.
Public ridership, meanwhile, has dropped from 60% in 2000-1 to 43% in 2008. In addition to investing in public transport, restraints on car ownership and usage are unavoidable if pollution is to be brought down to acceptable levels, says Roychowdhury.SMOKE ALARM 70 ( cities in terms have of hit PM ‘critical 10 presence ’ levels )
The top five polluted cities are Ludhiana, Khanna (both in Punjab), Ghaziabad, Khurja and Firozabad. Delhi is at number six
Northern India is far more polluted than the south, with Gobindgarh (Punjab), Kanpur (UP), Indore (MP) and Raipur (Chhattisgarh) rounding out the top-10 list
Some cities in south showing rising PM10 trends — Hyderabad, Tuticorin, Bangalore and Coimbatore
Eastern India shows high levels of nitrogen dioxide. Asansol, Durgapur and Kolkata, all in West Bengal, have India’s highest NO2 levels
Ahmedabad has reduced its PM10 levels by nearly 50%, Solapur (Maharashtra) by 57% and Chennai, Pune and Kolkata have stopped its growth
PM10 are tiny particles of less than 10 microns in size regarded as the most dangerous pollutant as they can go deep into the lungs
While particulate matter comes from a variety of sources, PM10 comes largely from vehicles Increasing numbers of diesel cars is a major cause of rising NO2 levels
Indoor air pollution is mainly due to burning of wood in rural India.
PM10 stands for particulate matter up to 10 micrometers in size and include smoke, dirt and dust from factories, construction sites, farming and roads. Annually, over 3.7 lakh hospital admissions are reported due to outdoor air pollution in urban areas.
According to the report, India can make green growth a reality by putting in place strategies to reduce environmental degradation at the minimal cost of.02% to .04% of average annual GDP growth rate.
Vehicular pollution
Rumu Banerjee & Jayashree Nandi, Dec 06 2014
For the owners, old vehicles are still gold.
Some Don't Want To Give Them Up For Old Times' Sake whereas others can't afford to buy again.
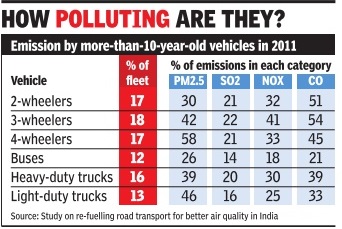
The government says old vehicles are not good for the environment. Even if they are properly maintained, they cannot comply with current emission norms. A research paper published in Energy Policy journal by air pollution and transport experts Sarath Guttikunda and Dinesh Mohan states, “The share of emissions from older vehicles, especially among light and heavy duty vehicles, is significant. ... We estimate that at least 30% to 50% of the total road emissions originate from vehicles older than 10 years”.
YEAR-WISE STATISTICS
1990-2015: deaths due to air pollution in China, India

From: Jayashree Nandi , India, China account for over half of global deaths due to air pollution, April 19, 2018: The Times of India
A US-study has estimated that India and China together account for more than half of global deaths due to air pollution. The US-based Health Effects Institute’s State of Global Air study, released in Boston on Tuesday, has also found that increasing exposure to air pollution combined with an ageing population has led to India rivalling China in health burden from bad air.
The report states that China’s PM2.5 pollution levels have started stabilising and people’s exposure to particulate pollution has also started declining but it’s on a steep rise in India. The death rate (deaths per lakh), however, is seeing a declining trend in both the countries.
In 1990, China saw 146 air pollution-related deaths per lakh of its population. This decreased to 80 for 2016. India on the other hand saw a steady decline in death rate between 1990 and 2010, when it fell from 150 to 123. The rate, however, has marginally increased in six years between 2010 and 2016 — the year for which the latest data is available.
“Although China experienced substantial increases in population-weighted exposures (PM 2.5) before 2010 — reflecting in part the dramatic scale of economic development in recent decades — since then the exposures have stabilised…,” the report states.
The burden of non-communicable diseases among the ageing population is increasing in developing countries. For example, among those of 70 years of age or older, PM2.5-attributable ischemic heart disease alone accounted for 16.2% of life years lost due to disease or what medical experts call disability adjusted life years (DALYs) in China, 17.8% in India and more than 20% in parts of sub-Saharan Africa, North Africa and the Middle East in 2016.
The report further states that Indian and China could be experiencing a “double burden” due to combined exposure to outdoor air pollution and household air pollution. In 2016, a total of 2.45 billion people (33.7% of the global population) were exposed to household air pollution. “India and China — with 43% and 30% of their populations, respectively, using solid fuels — had the largest numbers of people exposed to household air pollution in 2016: 560 million in India and 416 million in China,” the report reads.
“Impact and benefits of action are showing up in health indicators in China. Scale and stringency of action have certainly made a difference,” Anumita Roy Chowdhury, executive director, Centre for Science and Environment (CSE), said in reaction to the study.
The report acknowledges that the Indian government has begun taking action to improve air quality. But it says India needs to take aggressive action on reducing emissions from household biomass combustion, coal burning and dust pollution. Overall, the report stated that seven billion people — more than 95 per cent of the world’s population — live in areas with unhealthy air.
2012: Emission of green house gases
The Times of India, Jun 25 2015
Vishwa Mohan
On per capita terms, India far behind top 3 emitters
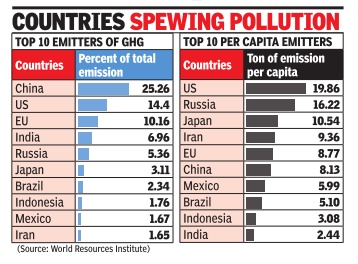
As the global community gears up for the crucial Paris climate summit, the World Resources Institute (WRI) -a global research organization -has come out with its latest analyses of the country-wise emissions of climate-damaging greenhouse gases. It shows India, despite being the fourth largest carbon emitter, continues to be far behind the other three top big emitters in terms of per capita emission. Though the data, released by the WRI, cannot be used as an excuse by India for not acting against its emission, such figures will certainly give the country an upper hand while negotiating for a global climate deal. India invariably uses the `per capita' yardstick while insisting on more comprehensive actions from rich nations. However, developing countries like China, Mexico and Brazil too are way ahead of India in terms of their per capita contribution to the overall emissions. And, this is the reason why a section within the Indian government has time and again argued not to compare the country's action with that of the Chinese goal.
The WRI analysis is based on data from its Climate Analysis Indicators Tool (CAIT) that has recently released its emission figures for the year 2012. It also came out with details as how the various economic sectors have contributed to the overall emission. “Per capita emissions are still distributed unequally“, it said, pointing out that the per person emissions still vary among the top 10 emitters, with the United States' per capita emissions eight times that of India.
According to the figures, the largest emitters contribute a majority of global emissions as the top 10 emitters contribute over 72% of global greenhouse gas emissions (excluding land use change and forestry). On the other hand, the lowest 100 emitters contribute less than 3%.
“While universal climate action is necessary, significant mitigation actions are needed by the largest emitters, taking into account that they have different capacities to do so,“ said the WRI in its document.
It shows the energy sector is the dominant source of greenhouse gas emissions. It contributes more than 75% of global emissions. “ A rapid transformation of the energy sector by 2050, as the G7 (top rich countries) suggested in their announcement, is necessary to avoid the worst impacts of climate change,“ it said.
The analysis also shows that emission sources vary by country . While the energy sector dominates, industrial emissions in China contribute more than 3% of global emissions and new data from the Food and Agriculture Organization (FAO) indicate that agriculture contributes a notable share of Brazil's and Australia's emissions.
“Mitigation policy options that countries should therefore align with their national circumstances“, the WRI suggested while sharing and analyzing those figures. Six of the top 10 emitters are developing countries. China contributes approximately 25% of global emissions, making it the top emitter.
South Asia: 2014
The Air We Breathe
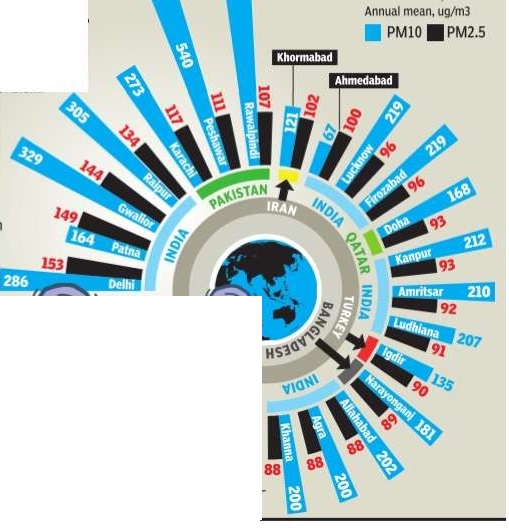
In May this year, a WHO report revealed that Delhi was the world's most polluted city. So which other cities suffer particularly bad smog?
It turns out India dominates the list, with more than half of the world's 20 most polluted cities.Including cities in Bangladesh and Pakistan, South Asia has a shocking 85% of them.
Not surprisingly, air pollution is the fifth largest killer in India, the cause of 6.2 lakh deaths last year.
The most polluted cities were determined by the annual mean of particulate matter smaller than 2.5 microns, considered the most harmful for health
2006-15: Acute Respiratory Infections (ARI)
The Times of India, Aug 07 2015

Vishwa Mohan
MoEF finally admits air pollution kills
Union environment ministry said in Parliament that more than 35,000 people had died due to acute respiratory infections (ARI) across India in over nine years. More than 2.6 crore cases were reported every year during the period. Although international studies have attributed far more deaths to air pollution in India, this was a rare official admission that pollution could be causing deaths on a large scale. The number of annual ARI cases reported by environment and forest minister Prakash Javadekar was high by any measure. “Air pollution is known to be one of the aggravating factors for many respiratory ailments and cardiovascular diseases,“ Javadekar stated, sharing the data provided by the health and family welfare ministry .
According to the data, 3.48 crore cases came to light in 2014, which means more than 95,000 Indians of all ages were reporting acute respiratory infection every day .
Responding to a Parliament question on impact of air pollution, the minister in his written response in the Rajya Sabha stated, “Asthma, chronic obstructive pulmonary disease, chronic bronchitis etc are the diseases caused by exposure to increasing air pollution.“
2015: 19 of the 20 most polluted cities
The Times of India, Sep 25 2015
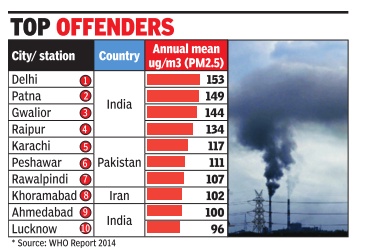
Dipak Dash
Delhi's air worst among 381 cities: World Bank
The latest World Bank report on leveraging urbanisation in South Asia has identified “air pollution“ as a big challenge for major cities in the region, including Delhi.While Delhi is the worst among 381 cities from developing countries, 19 of the 20 most polluted cities are from South Asia, the report said quoting the recent findings of World Health Organisation report on ambient air pollution. The report also mentions how for the “very poorest in Bangladesh, India, Nepal and Pakistan, under-five mortality is higher in urban areas than in rural settings“.
Referring to the WHO report with regard to the level of Particulate Matter (PM) 2.5 in the ambient air in cities, the World Bank said that of all the sources of congestion associated with the growth of cities, one of the most serious for health and human welfare is ambient air pollution from vehicle emissions and the burning of fossil fuels by industry. * Source: WHO Report 2014 High concentrations of fine particulate matter, especially that of 2.5 microns or less in diameter (PM 2.5), which can penetrate deep into the lungs, increases the likelihood of asthma, lung cancer, severe respiratory illness, and heart disease.
“Delhi is far from unique in South Asia in having dangerously high concentrations of PM2.5. Among a global sample of 381 developing-country cities, 19 of the 20 with the highest annual mean concen trations are in South Asia.And the issue is not just in India -Karachi, Dhaka, and Kabul all feature in the top 20,“ the World Bank report said.
It said given the lack of availability of and access to clean public transport in India, one can speculate that, for any given increase in demand for mobility associated with a given increase in population density , more air pollution will occur there than elsewhere.
2016
WHO urban air quality report
The Times of India, May 13 2016
Jayashree Nandi
Delhi has got rid of the `world's most polluted ity' tag. The World Heath Organization urban air quality database released ranked the capital 11th among 3,000 cities in 103 countries on PM2.5 (fine, particulate pollution) levels and 25th in terms of PM10 (coarse pollution particles) levels.
Delhi had emerged as the most polluted city in WHO's 2014 database, with a mean annual PM2.5 level of 153 mgm3.That number has come down to 122 in the latest report. However, the improvement may not be a fallout of action on air pollution and is most likely the result of the way air quality data has been assessed this time.
In the latest database, Zabol in Iran is the most polluted city in the world. Gwalior and Allahabad are a close second and third in terms of PM2.5 levels, associated with more serious health impacts than PM10. Patna and Raipur rank sixth and seventh respectively . In all, four Indian cities are among the world's 10 most polluted cities while 10 out of the worst 20 cities are in India. For Delhi, WHO took data from 10 stations for its 2016 report, including some in the less polluted residential areas. In 2014, just five station were taken into account.This time, data was taken not just from government agencies but also from open government data and US air quality mission.
In a clarification to TOI, a WHO official said, “In 2014, we had data for 2013 only . This time, we had both 2013 and 2014. From one database version to the other, we may have more stations, different stations for a given city,“ the official said. Another reason for the improvement in the Delhi ranking was the inclusion of 1,400 more cities in the list.In 2014, WHO ranked 1,600 cities but this time it considered 3,000 cities in 103 countries, which just brings more polluted cities under focus.
In WHO's 2014 report, 13 out of 20 most polluted cities were in India. This time two Chinese cities -Baoding and Xingtai have figured in the top 10, so have two Saudi Arabian cities -Riyadh and Al Jubail. In 2014, Riyadh, Al Jubail and Xingtai were not monitored.
Delhi's annual mean PM2.5 levels are three times the annual national standard and 12 times the WHO standard of 10 micrograms per cubic metres, highlighting how the city's air quality continues to be very poor.
Delhi also remains the most polluted among mega cities (more than 14 million population) followed by Cairo and Dhaka. Experts also advised against comparing cities Indian cities with each other simply because many cities are not adequately monitored. For instance, in Gwalior, Allahabad and Raipur, the PM 2.5 figures have been extrapolated from PM10 data, which could have a higher error margin.
Meanwhile, Delhi government issued a press statement claiming that “the decline in air pollution levels in Delhi is a collective effort and the government is committed to continue the war against air pollution with active cooperation of the residents.“ The statement said, “According to information provided by Delhi Pollution Control Committee scientists, important factors behind the reduction in air pollution measurements for Delhi during the last one year are increased awareness about pollutants, availability of the pollution-related data in the public domain, concrete action to control emissions from construction activities and control on industrial emissions.“
Since WHO has considered 2013-14 data, it's clear that the improvement in Del hi's ranking were not a result of AAP government's strategies. However, DPCC scientists told TOI they are seeing an arrest in PM2.5 levels. According to them, the city's average was 130 mgm3 in 2011, 168 in 2012, 143 in 2013, 151 in 2014 and 118 in 2015.
WHO's report may also be giving a slightly skewed picture because its database is only based on PM 2.5 levels.Many European cities have higher NOx and ozone (O3) levels but that isn't getting reflected because those parameters are not being monitored at all. In fact, if you consider cities that are breaching the WHO standard, France alone has 247 such cities, Italy has 216 while India has 121. This could be highly dependent on better monitoring coverage.
“Advanced countries that have shown progress in reducing air pollution are also facing newer challenges. Mix of pollutants and nature of health risks are changing, setting new goals for mitigation. For instance, over the last two years, several European cities have reported violation of NOx standards.UK was dragged to the European Court of Justice for not meeting the standards.While particulate matter has strong health impacts, the gases are the next generation challenge that other regions are dealing with. WHO should capture these shifting nature of pollution challenge,“ said the Centre for Science and Environment.
2018: 9/10 most polluted cities were in South Asia
March 5, 2019: The Times of India

From: March 5, 2019: The Times of India
Seven of the top 10 most polluted cities in the world are in India, according to a new study showing South Asia's battle with deteriorating air quality and the economic toll it's expected to take worldwide.
Gurugram, located southwest of India's capital New Delhi, led all cities in pollution levels in 2018, even as its score improved from the previous year, according to data released by IQAir AirVisual and Greenpeace. Three other Indian cities joined Faisalabad, Pakistan, in the top five.
The index measures the presence of fine particulate matter known as PM2.5, a pollutant that can fester deep in the lungs and bloodstream of human beings.
"This has enormous impacts, on our health and on our wallets," Yeb Sano, executive director of Greenpeace Southeast Asia, said in a statement released with the figures. "In addition to human lives lost, there's an estimated cost of $225 billion in lost labor, and trillions in medical costs."
India, the world's fastest-growing major economy, makes up 22 of the top 30 most polluted cities, with five in China, two in Pakistan and one in Bangladesh. India racks up health-care costs and productivity losses from pollution of as much as 8.5 percent of gross domestic product, according to the World Bank.
China made marked progress in its usually dismal pollution levels, with average concentrations falling by 12 percent in 2018 from the previous year, according to the data. That should help the message President Xi Jinping will share with political party leaders on progress across three so-called " critical battles" during the National People's Congress meetings.
2019
Vishwa Mohan, August 18, 2022: The Times of India
From: Vishwa Mohan, August 18, 2022: The Times of India
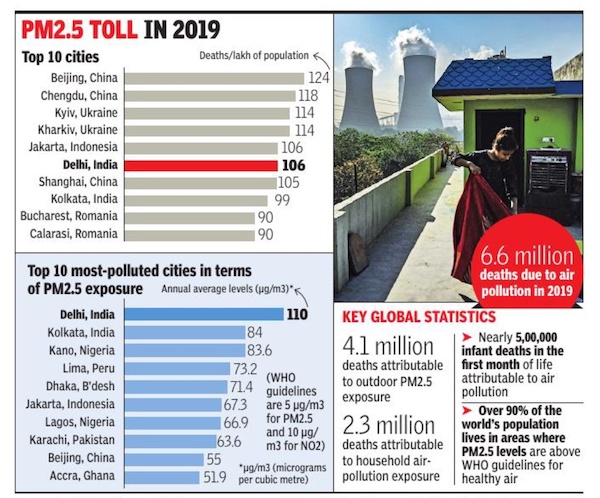
New Delhi: Most global cities far exceed World Health Organisation’s (WHO) air pollution guidelines, posing serious health risks, with Delhi and Kolkata figuring as the top two most polluted cities in terms of exposure to hazardous fine particulate matter (PM2. 5), said a new report released by the US-based Health Effects Institute (HEI) on Wednesday. Mumbai is 14th in the list in terms of being exposed to PM2. 5 in 2019.
In terms of impact, Delhi and Kolkata reported 106 and 99 deaths respectively per lakh of population due to exposure to PM2. 5 in 2019, while Beijing in China reported the highest number of deaths — 124 per lakh of population. The report, ‘Air Quality and Health in Cities’ that used data from 2010 to 2019, underlined that India is home to 18 of the 20 cities with the most severe increase in PM2. 5 pollution during the period; the other two cities are in Indonesia. The Indian cities/towns include Prayagraj, Varanasi, Chunar, Mirzapur, Rampur, Bhadohi, Rewa, Satna and Gopalganj. All these cities saw an increase of more than 30 micrograms per cubic metre (µg/m3) of PM2. 5 during the decade. The report analysed data of 7,239 cities across the globe and found that of the 50 cities with the most severe increase in PM2. 5, 41 are in India and nine are in Indonesia. Meanwhile, all the 20 cities with the greatest decrease in PM2. 5 from 2010 to 2019 are located in China.
“Delhi and Kolkata — with the highest PM2. 5 exposures, and ranking sixth and eighth for PM2. 5-related disease burden (impact) respectively — need the most stringent time-bound multi-sector action to meet the clean air benchmark,” said Anumita Roychowdhury, air pollution expert and executive director of the Centre for Science and Environment (CSE).
She emphasised Indian cities need to draw lessons from the fact that Beijing, despite lowering its PM2. 5 ex- posures substantially, has the highest PM2. 5-related disease burden due to its baseline disease rates and ageing population. The report highlights data gaps in lowand middle-income nations, a key aspect to understanding and addressing the health effects of air pollution. “Based on the 2022 WHO Air Quality Database, of the 20 cities with the steepest rise in PM2. 5 exposures in our data, only two (Satna and Varanasi in India) have an official monitoring station at the ground level,” said the report. According to the WHO’s Air Quality Database, only 117 nations have ground-level monitoring systems to track PM2. 5, and only 74 nations are monitoring NO2 levels.
Inhalable PM2. 5 is considered the most hazardous among all classical pollutants as it gets deposited in lungs and causes serious respiratory problems. Roychowdhury noted more developed cities that have controlled PM2. 5 exposures are now in the grip of NO2 problem from vehicles and industry. “Our cities therefore need to speed up multi-sector and multi-pollutant action,” she said.
See also
Air pollution: South Asia
