Bihar: Economy and development
This is a collection of articles archived for the excellence of their content. |
Contents |
Caste and economic status
Poverty among ‘upper’ castes
2022
Manoj Chaurasia, Nov 8, 2023: The Times of India

From: Abhay Singh TNN, Nov 8, 2023: The Times of India
See graphic:
Poverty among the ‘upper’ castes of Bihar, 2022
Patna : Alarming poverty levels beset Bihar’s Bhumihars, considered the biggest land-owing caste in the general category, and more than a quarter of the ruling Yadavs and Kurmis face deep deprivation, the state’s caste survey data suggests. SCs and STs are the poorest overall.
According to the report, 27.6% of the Bhumihar families are in the poor category, meaning they have a monthly income of less than Rs 6,000. Others in general-category poor are Sheikhs (25.8%), followed by Brahmin (25.3%), Rajput (24.9%), Pathan-Khan (22.2%), Syed (17.6%) and Kayastha (13.8%).
The poverty level is 42.9% in SCs and 42.7% in STs. It is 33.6% among extremely backward castes (EBCs), 33.2% in backward castes (BCs) and 25.1% in the general category. Poverty among the rest is 23.7%.
Among the most striking findings of the survey are its poverty numbers on the Yadavs and the Kurmis — who have governed the state for over three decades. According to the report, 35.9% of RJD president Lalu Prasad’s fellow caste members are poor; the number is 29.9% among CM Nitish Kumar’s Kurmi brethren.
Lalu became CM the first time in March 1990, and he or his party have been in office for over 15 years. Nitish has been in the saddle since November 2005. The two titans are now in a tango.
The findings assume significance after Union home minister Amit Shah on Sunday sought to discredit the caste survey by the Nitish government, alleging the number of Muslims and Yadavs had been “deliberately inflated” under Lalu Prasad’s pressure.
The survey says EBCs constitute 36% and OBCs 27.1% of the state’s population. Both are politically significant. SCs account for 19.6% and STs 1.7%. The general category is 15.5%.
Developmental indicators
1960, 2019

From: November 11, 2020: The Times of India
See graphic:
Bihar, Developmental indicators: 1960, 2019
1990-2020

From: October 31, 2020: The Times of India

From: October 31, 2020: The Times of India

From: October 31, 2020: The Times of India

From: October 31, 2020: The Times of India

From: October 31, 2020: The Times of India

From: October 31, 2020: The Times of India

From: October 31, 2020: The Times of India

From: October 31, 2020: The Times of India

From: October 31, 2020: The Times of India

From: October 31, 2020: The Times of India
See graphics:
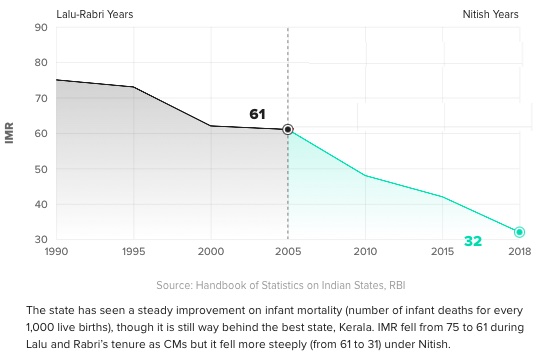
How safe is Bihar to be born in?
Life expectancy in Bihar, 1997- 2017
GSDP- Bihar, 1991- 2019
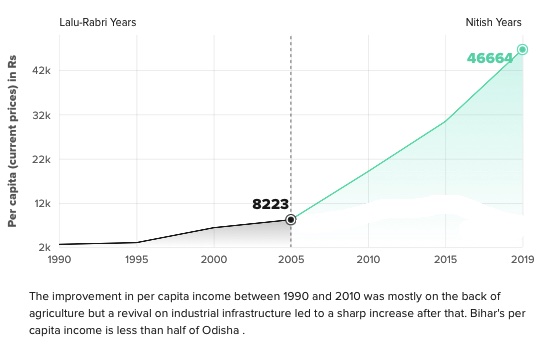
Per capita (current prices) in Rs., 1990-2019
No. of factories in Bihar, 1990- 2017
Total IPC crimes in Bihar, 1990-2019
Total IPC crimes in Bihar, 1990-2019
Murders in Bihar, 1990-2019
Rapes in Bihar, 1990-2019
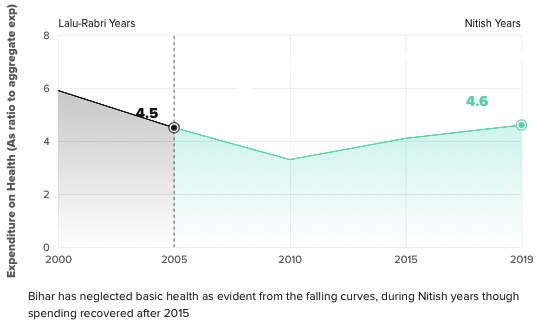
Expenditure on Health in Bihar, 2000-2019
Expenditure on Education in Bihar, 2000- 2019
2024

From: Oct 7, 2025: The Times of India
See graphic:
Bihar: developmental indicators, 1960s- 2024
Economic/ developmental indicators
Per capita income
1960-2024
Oct 25, 2025: The Times of India

The nation
Some selected states
From: Oct 25, 2025: The Times of India
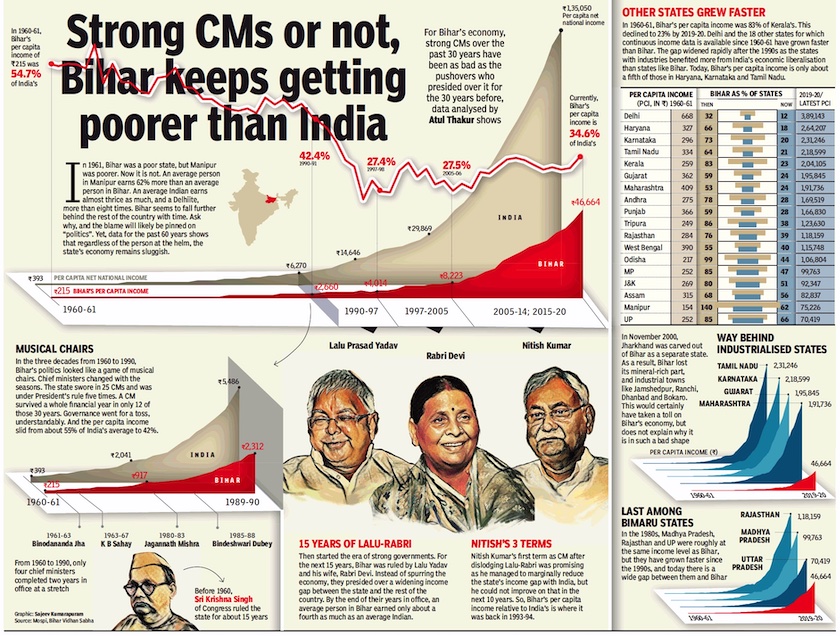
Starting in 1960-61 — that’s when state-wise per capita income data became available — Bihar’s politics till now can be divided into two broad categories: first 30 years of instability — when no CM could complete their full term — and the next 35 years of stable politics, when the chair was shared mainly between two political figures. Despite the dramatic change, the income gap between Bihar and other states kept on widening.
1960-2020

From: October 16, 2020: The Times of India
See graphic:
Bihar, economic indicators, 1960-2020
Electricity, piped water
2012-2024

From: Nov 15, 2025: The Times of India
See graphic:
The availability of electricity, piped water in Bihar, 2012-2024
Per capita income Urbanisation, employment, poverty
2023

From: Nov 15, 2025: The Times of India
See graphic:
Bihar: Per capita income Urbanisation, employment, poverty, 2023
2004-15

See graphic:
Bihar, developmental indicators, 2004-15 (The ‘Nitish Kumar years')
Employment
Unemployment
2018,2019
Atul Thakur, October 26, 2020: The Times of India
The latest estimate of the Periodic Labour Force Survey conducted by the National Statistical Office, which is the primary source to gauge the job situation in the country, shows that between July 2018 and June 2019, Bihar saw one of the country’s highest youth unemployment rates.
Among large states, only Kerala with 35.2% reported a higher unemployment rate among the youth (15-29 years of age) than Bihar’s 30.9%. About a third of youth in these two states couldn’t find jobs despite actively seeking employment.
‘Once a biz hub, Mokama shadow of former self’
Akhilesh Kumar, a 21-year-old youngster from Puraibagh village in Barh Vidhan Sabha constituency, says job prospects in the state are bleak. Kumar, who stays in Patna and is preparing for various competitive exams, asserts that hard work is the only key to success, and with perseverance he will soon land a government job. “What will Nitish do in this?” he asked. Kumar’s words are echoed by Pawan, a younger relative who too is a student in Patna. Both are satisfied with Nitish Kumar and say their families will vote for him this time too.
“Our first duty is to stop ‘Jungle Raj’ from coming back,” says an assertive Gyan Ranjan Kumar, a 25-year-old Rajput youth who, like Akhilesh and Pawan, is sure that the BJP candidate will win easily in Barh constituency. Rajgir Yadav, who is approaching his 40s, works in Gujarat and has been stuck in his village for the past few months, agrees that BJP has an edge in this seat as the caste arithmetic is working in its favour.
On the way from Barh to Mokama, this reporter met three more youngsters who were contractual employees of NTPC Barh and were on their way home. While they complained about the exploitative nature of contractual employment and the absence of public transport, they refused to be named in the story.
“A few days ago, a 21-yearold drowned at this ghat,” says Amit Kumar from Mokama Ghat. A 25-year-old unemployed B.Com graduate, Kumar is a Paswan who usually lives in Benaras for his exam preparation but has been stuck in Mokama since the lockdown. “Every year, at least 20 people drown here and nobody seems to be concerned,” adds Jwala Kumar, a 20-year-old Chandravanshi Kahar, who was forced to discontinue his studies and supports his family by doing various odd jobs that also include manual labour.
Asked why youths were seeking only government jobs, Amit points to the lack of decent private jobs in the state. “Today we have to migrate to other cities, but Mokama was once an industrial town that attracted migrant workers from elsewhere,” he says. Among large states, Bihar has the lowest labour force participation rate (LFPR) among its youth (15-29 yrs population). Economists blame the low LFPR to unwilling withdrawal of labour from the job market. Compared to the national average of 38.1%, only 27.6% of Bihar’s youth actively seek jobs.
Incidentally, Jim Corbett started his career from Mokama, where he, as an 18-year-old teenager, was employed by the railways at Mokama Ghat. “Today, the city is a shadow of itself. Factories of Bata and United Spirits have shut down and there is no hope of them reopening,” says Amit. Tarun Kumar, a footwear engineer who was a contractor with Bata, says, “The Bata factory ceased operation in 2014 while the whiskey factory shut down in 2016.”
2017-2024
Richa Gandhi, Nov 10, 2025: The Times of India

From: Richa Gandhi, Nov 10, 2025: The Times of India
Bihar’s overall unemployment rate dropped from 8% in 2017-18 to 3% in 2023-24. Youth unemployment followed a similar path, falling from 31% in 2018-19 to 4.3% in 2022-23, before rising again to 16% in the past couple of years.
However one may look at the numbers, it can be argued that unemployment isn’t perhaps one of the biggest challenges facing the state — on paper at least. That’s because Bihar’s unemployment rates have been well above the national average in recent years. But it’s important to look beyond these numbers and consider the kind of work people are doing, not just whether they’re employed.
Regular wage or salaried employment, the jobs that bring steady income, benefits, and some measure of security, remain painfully scarce in Bihar. Among all major states, Bihar ranks the lowest in this category. The share of people with regular wage jobs was already weak, at around 10%, before the pandemic. It has slipped further since then. That means even if more people are technically “employed”, far fewer have stable, decent work.
What has grown instead is informal, often unpaid, labour within households. The category of “helpers in household enterprises”, usually family members assisting in small, unregistered businesses, has surged dramatically. In 2017-18, they made up around 5% of Bihar’s workforce. By 2023-24, that share had gone up to 21%. These jobs rarely come with fixed hours, wages, or social protection. They signal survival, not opportunity.
This shift helps explain why Bihar’s unemployment rate looks deceptively low. Many people who would otherwise be counted as unemployed are instead absorbed into informal, unregulated work. These are not jobs created by a growing economy but by necessity, people working because they cannot afford not to. It’s a kind of hidden underemployment that keeps the headline numbers comfortable even though the reality may be bleak.
Finances of the state government
2021-2025

From: Nov 15, 2025: The Times of India
See graphic:
The Finances of the state government of Bihar, 2021-2025
Incomes
2022
Madan Kumar, Nov 8, 2023: The Times of India
Patna : Nearly a crore of families in Bihar, about a third of the total, are making ends meet at an income of a meagre Rs 200 or less per day, revealed the economic data of the state’s caste survey tabled in both houses of the legislature.
More than 94.4 lakh families live in poverty, with a monthly income Rs 6,000 or less. The state has a total of just under 2.8 crore families. Rs 6,000 a month translates to Rs 200 a day. Considering that the latest minimum wages for agriculture labour have been notified at Rs 376 per day, that’s equivalent to one member of the family being employed for barely 16 days a month at the minimum wage.
“Altogether 94,42,786 families can be considered ‘economically poor’ based on their total monthly income (from all sources) which is up to Rs 6,000 or less,” the survey reportsaid. Another 81.9 lakh families (29.6%) have monthly incomes between Rs 6,000 and Rs 10,000, just under 50 lakh families (18%) have incomes between Rs 10,000 and Rs 20,000, and 27.2 lakh (9.8%) earn between Rs 20,000 and Rs 50,000. A mere 10.8 lakh families (3.9%) have monthly incomes of more than Rs 50,000.
Interestingly, almost 12.4 lakh families (4.5%) preferred not to reveal their monthly income to the surveyors, the data of the caste survey revealed.
Among Birhor, one of the scheduled tribes (STs), 78% of families are poor, the highest proportion, followed by Chero (59.6%), Sauria Pahariya (56.5%) and Banjara(55.6%). Among the scheduled castes, Musahar, to which former CM Jitan Ram Manjhi belongs, had the highest proportion of families being poor (54.5%), followed by Bhuiyan (53.5%) and Dom (53.1%).
The Musahar caste has a total of 8.7 lakh families across the state. Of them, 4.8 lakh fall under the category of economically poor.
As per the survey, Bihar has 215 castes. Altogether nearly 13.1 crore people were covered in the survey.
Speaking in the assembly after tabling of the caste survey report on Tuesday, CM Nitish Kumar said his government was planning to provide an assistance of Rs 2 lakh each to these 94.4 lakh families for taking up some form of economically productive work. Besides, the state government has also planned to give Rs 1 lakh to each family identified as having no house, to help them construct their habitats, Nitish said.
Literacy
2011-22
Manoj Chaurasia, Nov 8, 2023: The Times of India
Patna: The Bihar Caste Survey report tabled on the floor of the state assembly has also brought to fore a positive change in the society: A significant 18% increase in literacy rate in the state in the past 12 years.
According to the 2011 census, the literacy rate in the state was just 61.8%, which has now gone up to 79.70% in the current caste survey conducted by the state government.
“While literacy rate among the males has gone up to 84.91% from 71.20% earlier, it has moved from 51.50% to 73.91% among females,” parliamentary affairs minister Vijay Kumar Choudhary told the assembly.
As per the caste survey, the literacy levels in general category at primary level and higher secondary level are 17.45 and 13.99%, respectively while in the case of backward castes, it is 21.69% and 10.69%, respectively.
The report also finds the literacy rate quite impressive among the extremely backward castes, SCs and STs at 24.65, 24.31 and 24.52% at the primary level. At the higher secondary level, it was found at 7.95, 5.76 and 7.48% among the EBC, SC and ST communities.
The report also states that 3.15% people have been using internet among the general category while in the case of OBCs, EBCs, SCs and STs, it is only 1.27%, 0.64%, 0.37% and 0.62%, respectively.
The caste survey report has also revealed that every community owns six-wheelers whether it is general, OBC, EBC, SC or ST categories. But very strangely, 92.36% people in the general category don’t have any vehicle. The percentage of people not owning any vehicles in the OBCs, EBCs, SCs and STs is 94.45, 96.31, 97.83 and 96.53, respectively.
We also published the following articles recently
Bihar caste survey manipulated to underestimate EBC figures: Amit Shah
Home Minister Amit Shah criticized the Grand Alliance government in Bihar for manipulating the caste survey and underestimating the numbers of Extremely Backward Castes (EBCs) for political reasons. Shah accused the government of inflating the numbers of Yadavs and Muslims while undercounting others, resulting in a grave injustice to the EBCs. He also accused the government of indulging in the politics of appeasement and opposed their opposition to the interests of OBCs. Shah highlighted the BJP's support for the survey but criticized its findings, aiming to win over the EBCs and weaken Nitish Kumar's support base.
18% increase in literacy rate in 12 years, finds study
The recently tabled Bihar Caste Survey report has shown a significant 18% increase in the state's literacy rate over the past 12 years. The current survey conducted by the state government reveals that the literacy rate has risen from 61.8% in 2011 to 79.7% now. The report also highlights the increase in literacy rates among males and females, with males at 84.9% and females at 73.9%. Furthermore, the report provides insights into literacy levels among different caste categories and internet usage. Additionally, the report reveals that every community in Bihar owns six-wheelers.
At 28%, Bhumihars in Bihar poorest in general category: Survey
The caste survey data in Bihar reveals that poverty levels are alarmingly high among Bhumihars, the largest land-owning caste in the general category, as well as a significant portion of Yadavs and Kurmis, who have been ruling the state for over three decades. The survey also highlights that SCs and STs are the poorest overall. The report indicates that poverty levels are highest among SCs, STs, and extremely backward castes (EBCs), while the general category has the lowest poverty rate. The findings are significant in the context of recent controversies surrounding the caste survey.
Migrants’ incomes, Remittances
1981-2017

From: Nov 15, 2025: The Times of India
See graphic:
Outward migration from Bihar, 1981-2017