Census India 1931: Literacy
This article is an extract from CENSUS OF INDIA, 1931 Report by J. H. HUTTON, C.I.E., D.Sc., F.A.S.B., Corresponding Member of the Anthropologische Gesselschaft of Vienna. Delhi: Manager of Publications 1933 (Hutton was the Census Commissioner for India) Indpaedia is an archive. It neither agrees nor disagrees |
Literacy
Reference to statistics
For the purposes of census literacy was defined as the ability to write a letter and to read the answer to it, and the figures are therefore strictly comparable with those from 1901 onwards. They exclude those who can read but not write, of whom there is a considerable number, mostly Muslims able to read the Quran in Arabic. Particulars of this latter class have been recorded in Baroda State where they form 50 per mille of the population over 5 years old (males 32 females 18), but in the rest of India the population has been divided into litera t e and illiterate, alleged literates under the age of 5 being reckoned illiterate. T- ,3 vernacular script of literacy was not generally recorded, and a reference to this point with such details as are available will be found in the following chapter on Language. Literacy in English was, as hitherto, recorded in a separate column. The general figures of literacy will be found in Table XIII of part ii of this volume, Table XIV containing figures by literacy for selected castes, while the main aspects of literacy will be found more conveniently exhibited by proportional figures at the end of this chapter.
Increase since 1921
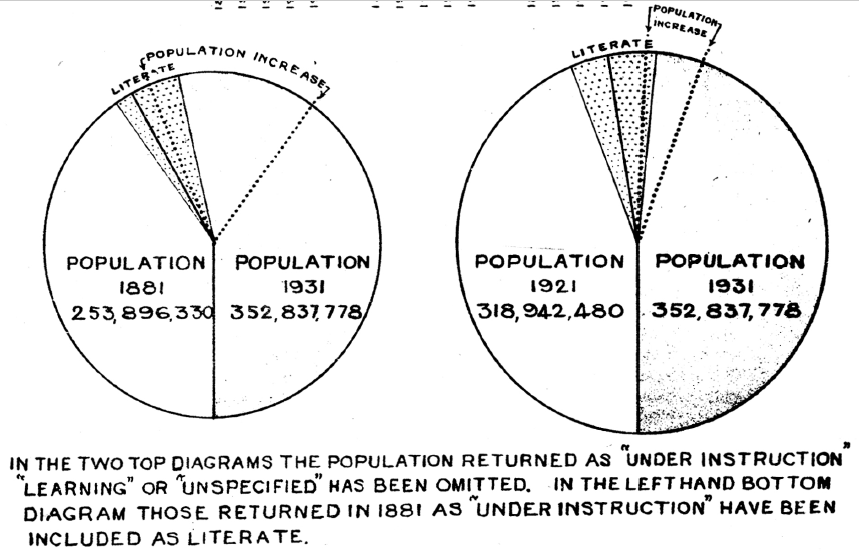
The actual number of literates has increased since 1921 by 5,515,205 persons, that is by 24 . 4 per cent. as compared to the increase in the total population of 10 . 6 per cent., and of 10 . 9 per cent. in the population enumerated by literacy. The literates in 1921 numbered 22,623,651, that is 7 . 1 per cent. of the total popul, 'on ; the actual increase of literates ha. been 16 .3 per cent. of the actual increase of population, so that there has been an increase of literacy relative to the total population in 1931 as compare but seeing that the total in, although literacy has increased appreciably faster than the population, the percentage correspondingly literate now is still not more than 8.0.
The marginal table shows the percentage of increase in each province taking its number of literate 1921 as 100, and including in the provincial figures the figures of the states in political relations with each. The second table shows in the same way the states which formed separate census units. Excluding the Andamans and Nicobars, where the decrease is due to the abandonment of the penal settlement, the only unit showing a decrease is Aden. The provinces in order of extent of literacy in 1921 were Burma, Bengal, Madras, Bombay, Assam, Bihar and Orissa, North West Frontier Province, Central Provinces, Punjab and the United Provinces. To some extent therefore, but by no means consistently, most progress has been made where there was most room for it.
Bihar and Orissa proves an exception, while Burma and to a less extent Assam have increased more rapidly than some provinces with more room for expansion. The order of literacy in the States and Agencies in 1921 was Travancore, Cochin, Baroda, Mysore, Sikkim, Gwalior, Rajputana, Central India, Hyderabad, Jammu and Kashmir, so that the same principle of an increase in literacy being most usual where there is most need of it is still at work, though Cochin and to a less extent Baroda are exceptional in a direction the reverse of Bihar and Orissa's. If the increases in states are noticeably higher on the whole than in British India, this is merely another instance of the same thing, as the states as a whole were behind British India in literacy in 1921, though Travancore, Cochin and Baroda, were ahead of all units but Burma. In considering the proportion of literacy to the population, however, it is usual to exclude at least that part of the population aged 0-5 years, and also that part of the population (3,078,460) not enumerated by literacy. The total population figure to be considered therefore with reference to the figure of literacy is 296,294,029 (males 153,770,850, females 142,523,179) and subsequent calculations will be based on that figure.
The figures above represent the actual variation of literates since 1921 in each of the units named, . but the real variation of literacy can only be accurately estimated by the variation of the ratio of literates to the population as a whole. A small increase in literates, such as that of 1 per cent. in Sikkim may, and in that case does, represent an actual decrease of literacy, which has failed to keep pace with a growth in population. The marginal table therefore shows the numbers literate per mille of the total population aged 5 and over, and of the corresponding male and female population separately, in 1931 as compared to 1921.
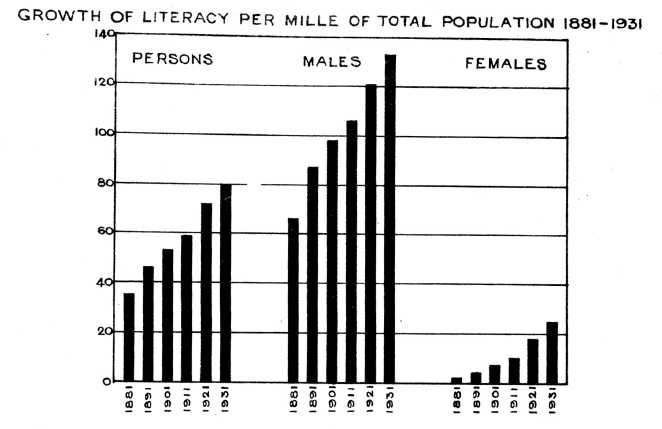
Subsidiary Table V shows the growth per mille since 1901. Before that the classification of literacy was into illiterate, learning and literate, and in the diagram showing the growth of literacy since 1881 those shown as " under instruction " in 1881 and as " learning " in 1891 have been excluded from the total taken as literate, the loss of those who were under instruction but would in 1901 and after have been returned as ' literate ' is perhaps balanced at any rate in 1881 by the exclusion of the very large number whose literacy or illiteracy was unspecified in the return and most of whom were probably illiterate ; since 1901 the return has been literate ' or illiterate ' simply. The diagram is also based on the figures per mille of the total population, not on that aged 5 and over only. For the purpose of demonstrating growth the standard taken is immaterial and age groups are lacking in the literacy table of 1881.
Distribution of Literacy
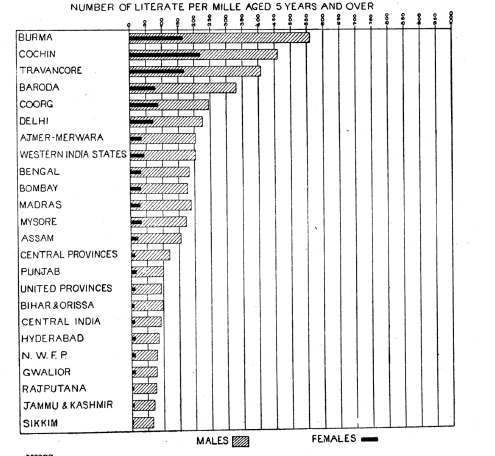
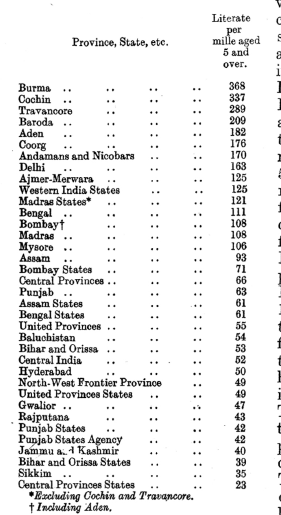
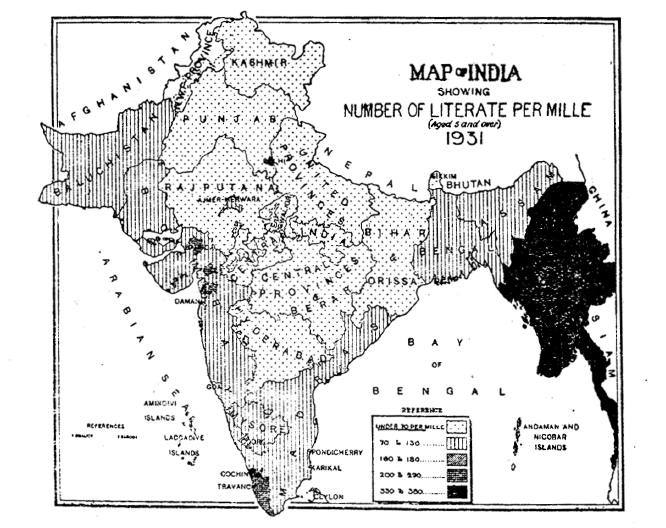
The literacy of different provinces is given by ratio per mille in Subsidiary Table II at the end of this chapter, and its progress is illustrated in Subsidiary Table V. It is also illustrated graphically in the accompanying diagram
based on the figures of provinces (British territory) and of major states. A warning must here be given against certain figures in the Subsidiary Tables. The exceptionally high figures for Baluchistan and the North-West Frontier Province Agencies and Tribal Areas are entirely misleading, as they are calculated on a very small proportion of the population consisting principally of troops and persons living in cantonments or frontier posts and having no reference at all to the real inhabitants of the area to which they refer.
In the marginal table, the North-West Frontier Province agencies are omitted and the Baluchistan figures, British territory and States together, are calculated roughly on the whole population aged 5 and over instead of only on those enumerated by literacy ; as however there are no figures for the whole population of Baiuchistan by age, the figure for those aged five and over is only an estimate, and Baluchistan is given credit in the accompanying map for a somewhat higher rate. In comparing these figures with those of 1921 some difficulltty ise reienxce in tahatt the 1921 India Report gives no separate figures for provincial states, whereas on this occasion the figures for British India have been separated from those of the states in political relation with various provinces.
The marginal table shows the present positon of literacy calculated per mine of the population da g5ea nadn over foarl la r opvinces and states, taking the sexes together.
This probably gives the truest impression of the real distribution of literacy, as a literacy which is confined to males is apt to be of rather a special nature, and, except in those castes or classes in which male literacy and learning is a natural heritage or a religious necessity, is apt to be a mere economic implement—necessary to business, a means of livelihood, a political weapon, or useful for intercourse with the external world, but of little value for its own sake. It is not perhaps until literacy becomes a domestic acquisition taken for granted among members of both sexes, that it will cease to be regarded as a mere doorway into government or other service and principally valued for its potentiality to that entry.
The Census Superintendent of Cochin State ascribes a definite falling off in the number both of institutions and of pupils in the lower secondary and in the primary classes less to the general economic depression than to a growing realisation that literacy is losing its economic value as a qualification for a career. He points out that graduates of Madras University join the Police Department on a salary of Rs. 10 to Rs. 12 per month and are held fortunate in getting employment at all. On the other hand there is no falling off in the higher secondary classes but a continued increase, which he ascribes to such pupils having gone too far to withdraw. The falling off in primary education he rightly regards as a bad sign, and he argues the necessity of completely recasting the educational system. However that may be, the distribution of male literacy shows some divergence from that of general literacy, as may be seen in the accompanying diagram in which provinces and states are arranged in order of general literacy but in which male and female literacy are taken separately for graphic representation.
In the relative position of provinces and states in order of literacy there is little change during the decade. Cochin State, in spite of a very rapid growth in population, has been able to do more than keep pace with that growth, in spite of having started with a very high ratio. Burma easily maintains her lead, for there literacy even if not of a very high order, is a habit, traditional in both sexes and all classes, both boys and girls being taught in the monasteries of which almost every Burman village has at least one. No need perhaps for compulsory education here. In India however it had been introduced by 1930 in 133 urban areas and in 3,137 rural areas of which 2,303 are in the Punjab, though apparently with no very marked success.
Literacy in Cities
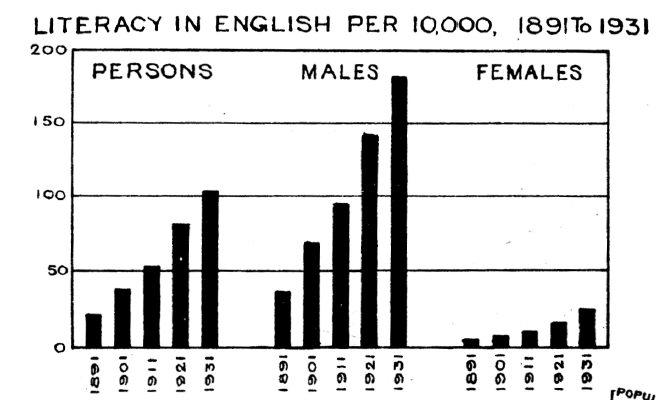
It is a commonplace that literacy is much more prevalent in towns than in the country, as both the need for it and the opportunities of acquiring it are greater. Thus an examination of the 34 cities tabulated in Table XIII shows that of the total population the proportion literate per 1,000 is 348 males and 149 females as compared to 133 and 25 respectively in India as a whole. A reference may also be made in this respect to the table in paragraph 41 of chapter H. There is naturally a still greater contrast in literacy in English, the figures for the same 34 cities being 1,473 males literate in English per 10,000 of the total population and 434 females, as compared to 181 and 23 respectively for the whole of India.
Female Literacy
The distribution of literacy among females has already been indicated when dealing with the distribution of literacy generally, and a reference to the diagram above will show that the extent of literacy among women is not necessarily determined by its extent among men, but is generally correlative though much less in extent.
It will also show the comparative absence of female literacy throughout India proper except in Kerala. In the Bihar and Orissa States, to take an extreme case, there is only one literate female to every fifteen literate males, and in Sikkim less than one to every twentytwo
- even in Burma there are 3 . 5 literate
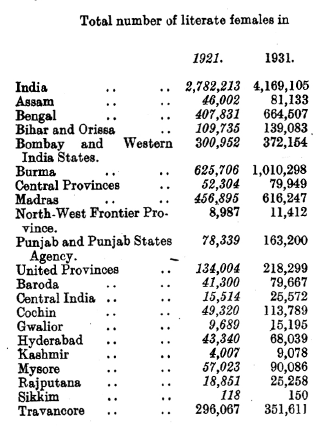
males to every literate,female. In Kerala and Baroda alone is the situation other than in, the rest of India, for Cochin State has more than one literate female to every two literate males and Travancore only a little less, while Malabar has nearly one to every three, Coorg a little less than one to every three, Baroda a little fewer and Mysore one to every five. Cochin now leads India in female literacy with Travancore a fair second and Burma a very close third.
Comparative progress is illustrated in Subsidiary Table V at the end of this chapter, and the marginal table gives the crude numbers for the larger provinces and states for 1921 and 1931, the figures of provinces being in this case inclusive of the states in political relation with them. It shows an increase of almost 50 per cent. against an increase of 11 .4 per cent. in the female population enumerated by literacy, but the figures of female literacy are still absurdly low. Besides the difficulty, still felt very strongly in most pro. vinces, of getting good women teachers, one of the most serious obstacles to the spread of female education is the early age of marriage, which causes girls to be taken from school before they have reached even the standard of the primary school leaving certificate. The report on Education in India in 1929-30 gives a table, reproduced in the margin, showing that of 1. 3 million girls in class I only 26 per cent. went on to class II, of 311 thousand in class II only, 63 per cent. went on to class III, and of 183 thousand in class III only 58 per cent. went on to class IV.
The total wastage involved is about 90 per cent. Here we are found in a vicious circle, since the early age of marriages prevents the growth of female literacy, while the absence of female literacy seems largely responsible for the absence of any general change in the early age of marriage. Burma and the Malabar Coast are the two exceptions and in Cochin State an increasing tendency is reported for women to seek careers of their own in preference to marriage at all. For the extent of female literacy in different communitie&- and in different castes, a reference may be made to the marginal tables given in paragraphs 140 and 141 below.
Literacy by community
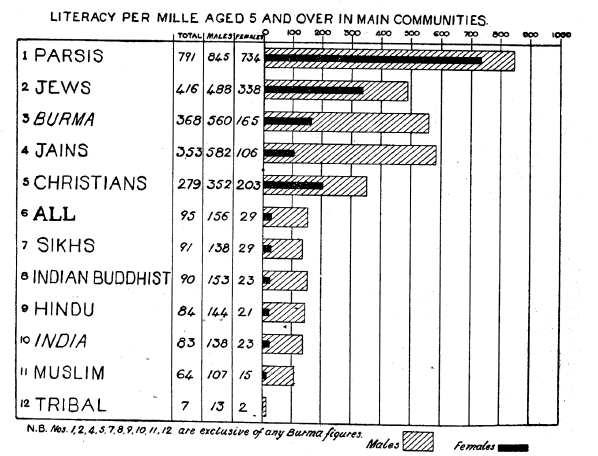
The accompanying diagram shows the number per mille literate in each sex in the different main religions and in Burma. Owing to the tabulation's having been based on racial instead of religious group in Burma the figures of literacy by religion are to this extend descripant with those of last census as the latter including Hindus Muslim etc, in Burma, whereas the present one are confined to India proper and the figures for Burma are not distinguished by religion except in the case of Hindus and Muslims. This being so it has been thought better here as elsewhere to show Burma as a single unit in the subsidiary tables in this chapter; it is predominantly composed, of course, of Burmese Buddhists, and though figures for Indian Hindus, Indian Muslims and other Indians will be found in Table XIII, the general standard of literacy in Burma is determined by that of the Buddhist Burmese. Taking the figures as a whole, the greatest progress has been made by Sikhs, Jains, Muslims, and Hindus in that order, while Tribal, Parsis and Christians have all declined in their proportion of literacy since 1921. The unexpected decline among Parsis is confined to males and it is just possible that it can be ascribed to the economic depression. The decline among both Christians and Tribal is to be put down if not wholly at any rate in part, to the exclusion of Burma figures, though it is also possible that the figures of Christians have suffered by the inclusion of illiterate converts and those of Tribal by the return of literate tribesmen as Hindus.
The marginal table shows the variations in the descending order of total increase, but it will be noticed that this order is not always retained if the sexes are taken separately. Thus both Parsis and Tribal show a slight increase in feminine literacy in spite of the fall of literacy on their whole pcipulation. Again Jains although only second in the rate of growth of general literacy come first in growth in literacy among females, but are' behind both Hindus and Muslims in growth among males. The growth in Sikh literacy is noticeable, as they showed hardly any increase at all in the preceding decade and the Census Superintendent of the Punjab in 1921 wrote of their educational stagnation. This time they easily lead in rate of increase except among women, where they are second to the Jains. It is hardly necessary to point out that the high standard of literacy among Parsis, Jews and Jains is partly due to the fact that they are mainly composed of trading classes for whom literacy is essential, and that where literacy is so ggeneral as it is among the Parsis, for instance, the rate of growth per mille is not strictly comparable to the rate of growth in a comparatively illiterate community. At the same time it is noteworthy that in Burma where the prevalence of literacy is much greater than in any Indian communities except Parsis and Jains the rate of increase should be as high as 51 per mille for the total population and 50 and 53 for males and females respectively. In considering literacy among the different communities it will perhaps be useful to examine briefly their respective position with regard to literacy of 20 years and over, since such figures might .affect any franchise Lased on literacy.
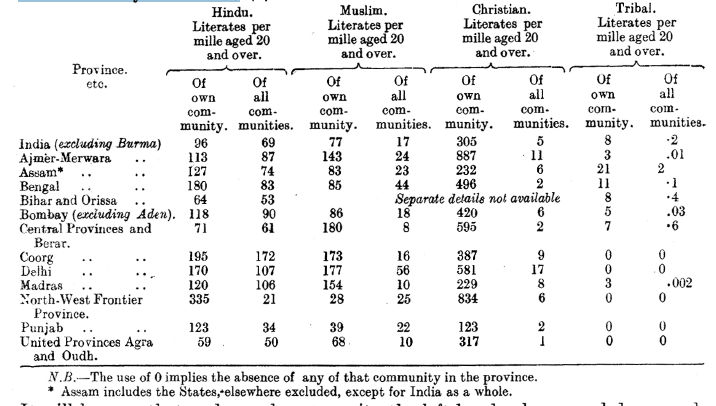
The marginal table gives the figures of literates per male aged 20 and over by communities for adults only of both sexes as cornpared to the figure when the whole popula- Lion over 5 years is considered. If females alone be considered the difference between the comparative figures is more marked and the order they appear in is in one case different, as Christians have a higher proportion of literate females than Jains have. Literacy figures by religion and sex for the various provinces will be found in Subsidiary Table III at the end of this chapter. The following table shows the number literate in British territory in each province in each main community per mille (1) of adults of the community concerned, (2) of all adults in the province :
It will be seen that under each community the left-hand column read downwards shows the relative literacy of that community in the different provinces, while the right hand columns read across show the proportions per 1,000 adults in each province who are literate in each of the four communities. Tribal figures ate shown in this table as, numerically at any rate, they age the fourth most important community in India excluding Burma, while in literacy they are exceptionally backward. In certain provinces however there are other communities of much local importance. Thus in Bombay Parsis, aged 20 and over have 853 literates per 1,000 of their own community and 4 per 1,000 of the adults in the province. In the same province Jains have 391 literate of every 1,000 adults and very nearly 4 literate of every 1,000 adults in the province. Of every 1,000 literates in Bombay Province 30 are Jams and 32 are Parsis. In the Punjab Sikhs have 110 literate of every 1,000 adult, 15 literate in every 1,000 adults of the province, and 1 - 0 --, literate in every 1,000 adults in India proper ; of literate adults in the Punjab 200 in every 1,000 are Sikhs. Literacy in Burma has been tabulated by race, qualified in the case of Indians by the differentiation of Hindus and Muslims.
The marginal table shows the figures corresponding to those in the table above for India. The difference in literacy between Burma and India is very marked.
literacy by Caste
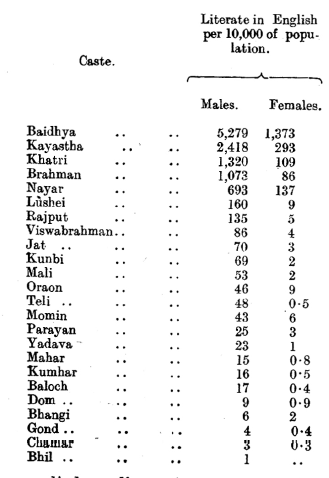
The two dozen castes and tribes shown in the marginal table arranged in oerder of trotal liateracy pter meille indi cate the extreme variation of literacy among different social or racial groups. It is not possible to give more than a sample here, and even the much larger number appearing in Table XIV, where castes are shown by literacy and by province, is merely a brief selection by way of illustrating the great divergence between the literacy of different castes in India and between the same castes in different provinces.
The proportionate figures for the same castes are given with reference to locality in subsidiary table V at the end of this chapter where comparative figures for 1921 are available. Those with a high social status are not by any meats always so high in order of literacy, though of necessity the trading classes are always high in male literacy, while the figures of feminine literacy do not necessarily correspond at all to those of masculine, except that they are naturall y always less than the latter in the same group ; only among the Baidhyas of Bengal and Assam do they reach 50 per cent. of the male figure. The primitive tribes generally are very low in the list except in Assam, where the Lushei show how literate an isolated hill tribe may become when given the opportunity. The high literacy of the Malabar Coast is exemplified in this list by the Nayars, but the high literacy of that coast, and of Travancore and Cochin States, in particular, has influenced the figures of some other castes including even those of the Paraiyans. As regards literacy among exterior castes the proportion per mille literate in each provinee and the total per mille literate in British provinces and in the States is shown in the marginal table ; in India as a whole the exterior castes of Hinduism are a little mitive tribes, but net very better equipped than the primuch.
The details of the castes contributing to the marginal figures are different in different provinces and. are detailed in the appendix on the Exterior Castes at the end of this volume. The primitive tribes are very many of them greatly handicapped in the acquisition of literacy by the faet that they are so often given their primary education in a language which is not them own. This is not the case in Assam, where the local vernacular is usuall y used in primary schools in hill districts, a policy the results of which. are refiectcA in the literacy of the Lusheis and Khasis ; if the Nagas are backward it is to he pot down largely to the incredibly polyglot nature of their habitat where there are ac many vernaculars in a small area: as will be found in the rest of India outside .A.ssam and Burma. Generally however the policy seems to be to use the vernacular of the adjacent plains for the primary instruction of hill tribes. and the bAckwa rdness of the Santals, for instance, in literacy is attributed by Mr. P. O. Bolding, the best authority on that tribe, to that policy. As regards tho difficulties in the way of acquisition of literacy b y the depressed classes reference ma y he ruade to Appendix I to this volume, on the Exterior Castes.
Literacy by Area
In any comparison between literacy in 1931 and in 1921 there is one factor that has to be borne in mind which has already been examined in Chapter VI, and that is the method of sorting by age. The number of literates at any given year will not necessarily be proportional to the total number of that year living, and when the years are grouped the upper limit of any group will contain a higher proportion of literates than the lower until majority is reached. The method of sorting therefore will exclude from the group 5 to 10 a certain number who have appeared in that group in 1921. Some of these will be correctly excluded owing to the preference for the digit 5 which then depleted in some degree the 4 year group in favour of the higher age, but probably more than the correct number will be exclu,- ded.
This matters little enough as far as real literacy is concerned, as literacy at the age of 5 is only nominal, but the comparative values will suffer a little, the actual position as compared to 1921 being really a little better than the bare figures indicate.
The comparable value of. the other figures of literacy by age will similarly be slightly impaired in regard to 1921, but the total figure of literacy of course only loses by the small number unduly excluded from the group 5-10 to the group 0-5, and this number can probably be ignored for practical purposes. Subject to this caution we may pro teed to compare the figures of literacy at different ages. The marginal table con - A the figures per mille for the different age groups in 1921 and 1931. Except for males aged 10-15 there has in all groups marked increase particulaxly in the proportion of literate females. In the lowest age group the numbers literate have doubled, and the loss in the 10-15 group is only 1 per mule in males, females gaining by 6 per mille. In 1921 also it was this group which showed the lowest ratio of increase over 1911. After group 5-10, group 15-20 shows the next highest increase.
It is this group which is usually regarded as most indicative of the growth of literacy, and the lower ratio of the subsequent group is in accordance with normal expectations. Obviously however this need not be necessarily illiterate permanently the case, since once literacy becomes general the reduction in literacy aged 20 and over will depend on the relative proportion , of literate to lliterate deaths and on the extent to which literacy is lost. Generally speaking it seems likely that the average literate leads a life less exposed to casual dangers than the average illiterate does, while there is less tendency to lose literacy if its use is involved in the calling pursued.
It is perhaps natural therefore that among Parsis, the most longlived community in India, and also one which is mostly engaged in trade and unlikely to suffer from loss of literacy, the ratio of literacy should be even higher above the age of 20 than it is from 15 to 20, and the same considerations may explain the same phenomenon among male Jews. It is also to he seen however among Burmese and among Indian Buddhists (vide Subsidiary Table I at the end of this chapter), and the explanations suggested in the India Report 1911 do not seem to account for this satisfactorily. Possibly the case of Burma is met by the fact that literacy is general enough among males to prevent any excess in the ratio literate from 15 to 20, but this explanation cannot be applied to Indian Buddhists.
Literacy in English
Literacy in English has increased, that is in ratio to the numbers of the community, among all communities except Christians, where it has failed to keep pace with the growth in numbers. Sikhs have shown the most rapid increase. having very nearly doubled their ratio during the decade, the next highest proportional increase being among Muslims. Subsidiary Table I shows the distribution of literacy in English among communities, Subsidiary Table IV shows it by age, sex and province, and gives comparative figures for 1921 and 1911. The proportional figures are too small to show conveniently per 1,000, so figures of literacy in English are given per 10,000 of the population aged 5 and over. The Parsis have 5,041, Jews 2,636, Christians 919, Jains 306, Sikhs 151. Buddhists 119, Hindus 113, Muslims 92 and Tribal 4 persons literate in English in every 10,000 of their population. As regards the provinces the figures are again deceptive unless read with caution. The figures for Baluchistan are fictitious for the reasons given in paragraph 137 above ; Delhi and Ajmer-Merwara show high figures on account of the very high proportion of urban population. As pointed out in paragraph 138 above, literacy in English is particularly high in cities on account of the greater opportunities for its acquisition and its greater economic value in use.
The high figures of the Andamans and Nicobars are also more or less artificial. Cochin State really leads in literacy in English with 307 so literate per 10,000 of her population aged 5 and over. Coorg follows with 238, Bengal being third with 211. The next is Travancore State with 158. The figures of literacy in English by caste are interesting, as these figures show some divergence from those for vernacular literacy, and the marginal table may be. compared with that given in paragraph 141 above.
Literacy for Franchise
It was suggested when the advent of the Franchise Committee was at hand in 1931 that figures should be obtained at the census of all persons who had reached the leaving standard of primary schools, since such statistics would be useful if any decision were made to base the franchise on some such qualification.
It was however found impossible to devise any uniform definition of the necessary standard which could be applied to all provinces. Apart from this it is obvious that the possession of a school leaving certificate, or another of a similar description, applied as a test of literacy would leave unqualified a large number of persons who are literate but possess no such certificate. Some will have left school before such certificates were given at all ; others will have neglected to sit for the examination ; others again will have acquired literacy by private tuition, at a private institution, or in the course of business. It is very doubtful therefore if such a test could conveniently be made use of in determining the qualification for franchise. Many provinces and states however did undertake an enquiry of this kind and the results are referred to in the provincial reports..
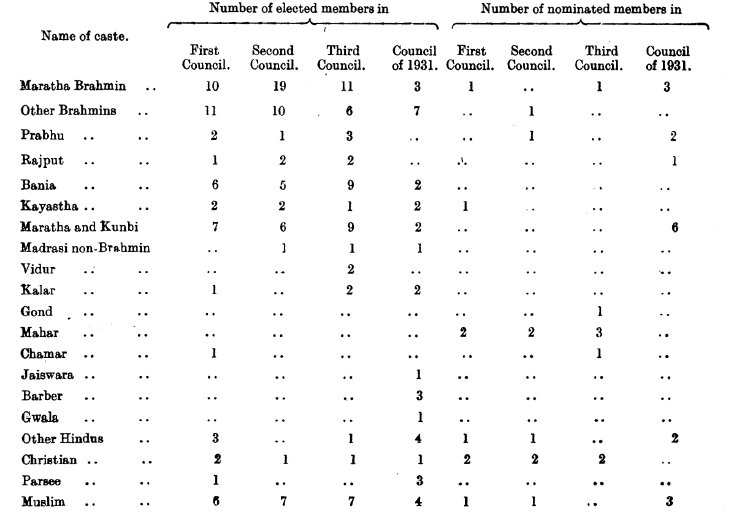
It is perhaps worth while in this connection to reproduce here an interesting paragraph from the Central Provinces Report. The Census Superintendent writes : "It seems proper, at a time when Franchise problems are claiming much attention, to place on record some figures to show to what extent the various tribes, castes and communities of the province are represented in' the local Legislative Council. The subjoined table gives those figures :—
The figures tell their own story. The note below recorded after the third Council explains the tendencies, further rapid development of which is evident from the statistics of 1931. The growth of the strength of the non-Brahmin party is obvious. The inadequate representation of the aboriginal tribes is most striking.
The strongest elements purely from the point of view of caste are the Brahmins, Banias and Marathas and Kunbis. Of these, the Maratha Brahmins and the Marathas and Bunbis each represent communities closely bound by caste, customs and geographical distribution, whilst " Other Brahmins " and " Banias " comprise a number of widely differing castes, in origin mostly foreign to the province, and possessing no such common characteristic as would constitute either of them distinct political entities. It will be noticed that Brahmins were most strongly represented in the second Council when the Swarajists decided to participate in the elections for the first time. The solidity of the Maratha Brahmin element will be realised when it is stated that they then held 14 out of the 24 non-Muhammadan seats in the Berar and Nagpur divisions. This number is now reduced to 8. The total number of Brahmins shows a heavy fall from 29 in the second Council to 17 in the present Council, justifying the inference that a political consciousness is being evoked in other communities. Even now, however, the higher castes account for over two-thirds of the members elected from general constituencies, and the only challenge, slight though it is, to their predominance, comes from the Maratha Bunbis who have succeeded in increasing their numbers in the Council and reproduce a powerful element in the electorate. Only one member of the depressed classes has been elected, and that in the first Council when owing to the boycott there was little competition. The number of members nominated from the depressed classes has been raised from two to four in the third Council, and is made up of three Mahars and one Chamar." Mr. Shoobert has drawn attention to the inadequate representation of the aboriginal tribes.
It should be explained that these tribes number over four million in the Central Provinces and attached states, and form between 4 fifth and a quarter of the total population, 1,969,214 being adherents of tribal religions while the remainder were returned as Hindus or Christians, but mainly as Hindus.
Comparison with returns of the Education Department
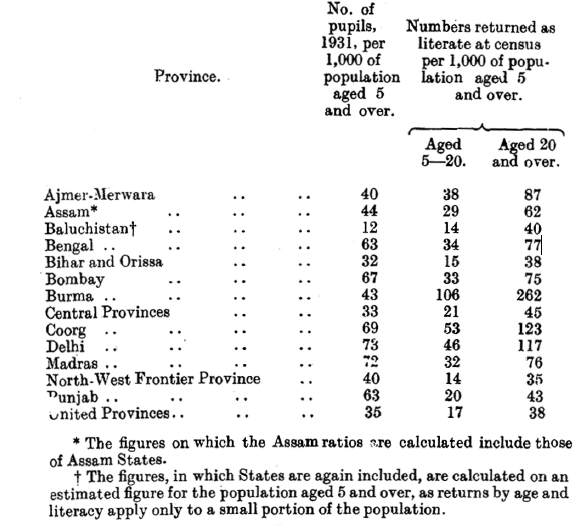
Some comparison is necessary between the figures of literacy returned at Education Depart- the census and the figures compiled by the Education Department showing the number of schools, colleges and other educational institutions, the pupils under instruction, and their proportion in differ- ent provinces and communities in British India. The departmental figures are taken from Education in India, 1930-31. The first marginal table therefore shows the number of pupils in 1931 distributed between the different communities and their ratio per mille on the figures of the same communities as obtained by the census returns.
These ratios may be corapared with the ratio of literacy in the same communities given above in paragraph 140. For calculating the ratio of Buddhists, Burmese have been taken as equivalent to ' Buddhists ' in Burma. The exact ratio is uncertain as there are many literate Shans and other Buddhists in Burma who are not included under the term Burmese, and probably many illiterate also. In any case the number of the Department's pupils in Burma bears little relation to vernacular literacy in that province.
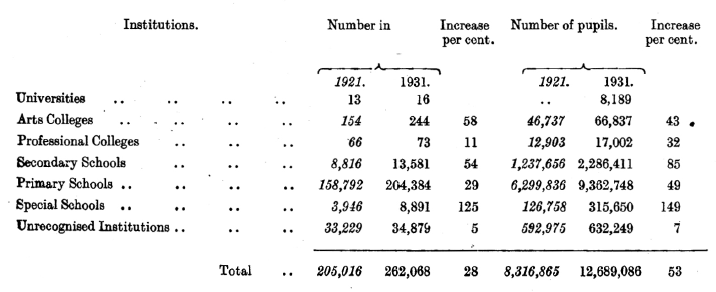
The second table below shows the number of institutions and the number of pupils in them in 1921 and in 1931 and the percentage of variation :—
It is to be noticed that 74 per cent. of the pupils are in primary schools, a decline of 2 per cent. in the proportion of primary pupils during the decade, so that the already unduly low proportion of primary to secondary education appeared to be falling instead of rising. This aspect of the relation between the two is indicated by the comparative rates of growth (vide Subsidiary Table VII at the end of this chapter). While since 1901 the number of primary schools has increased by 110 per cent., those of secondary schools have increased by 151 per cent. and those of colleges by 71 per cent. ; again since 1921 the growth in the number of primary schools has been 28 per cent. only, whereas secondary schools and colleges have increased by 51 per cent. and 44 per cent. respectively. This point is further emphasised by the statement of expenditure. About half the money spent on education is contributed by Government, and of-the whole amount, after the exclusion of Direction, Inspection, Buildings, Universities, Boards, Special Schools, and Miscellaneous, we find that Rs. 6,82,07,867 are spent on primary education as compared to Rs. 9,45,23,607 on secondary. Admittedly primary education cannot be extended without spending money on secondary education, but the sums spent on the latter and the number of. pupils under secondary instruction appear disproportionately high in view of the large illiterate population. It has been estimated that about two-thirds of the villages in India have no schools, and for the 500,000 census villages in British territory the Education Department figures show little over 200,000 recognised schools, while the addition of all unrecognised rural schools fails to bring the total to 230,000.
The average cost per pupil in all recognised institutions worked out at just over Rs. 23 for 1930, but a separate analysis of the cost of primary and secondary pupils respectively gave Rs. 8-5-5 and Rs. 179-4-3 as the cost of each primary and each secondary male pupil for that year, and Rs. 10-3-6 and Rs. 467-3-5 respectively as the corresponding costs of each female pupil (vide Education in India, 1929-1930). The high cost of girl pupils is no doubt due in a great degree to their comparative paucity, and is to that extent unavoidable, but the figures do suggest that the amount spent on secondary education is disproportionate to that spent on primary. The reason is simple enough. As a result of the caste system there is an insistent demand for education on the part of those castes who have been accustomed to look to literacy to provide them with a livelihood, and their tendency under competition is to demand higher education. On the other hand there is no widespread demand among other castes for education at all, and this is illustrated by the tremendous wastage in primary schools. This amounts to two-thirds of the total in the case of boys and a great deal more than that in the case of girls, who are apt to leave school when they are married.
This wastage again explains the inordinate excess of pupils shown by the Education Department as under instruction over the numbers returned as - literate aged 5-20 by the census, which might have been expected to show some relation to the number of pupils. The comparative figures are shown in the third marginal table, which shows also for comparison the number returned at the census as literate, 20 years and over. These figures may be regarded perhaps as those of effective literacy, which really only begins at about 20 years, and if they appear unduly low when compared to the figures of pupils under instruction, this must be put down to the wastage already mentioned which involves a discard of at least two-thirds of the primary pupils, that is of a half of the total number of pupils. Burma is of course exceptional as most of her literacy is obtained in village monasteries and not through the Education Department.
The high figure of Delhi is no doubt due in part to its being mainly an urban area and in part to the concentration there of ministerial officers of Government and their families.
The Education Department consider that four years at School is required to give permanent literacy, and that the number of literates turned out in any year can therefore be gauged by the number of pupils reading in Class IV in that year. The marginal figures give their numbers annually for the past decade, making a total of 7,660,419. Of these persons it is considered that at least 20% and possibly as much as 25% would be found unfit for promotion, that is to say they have not been rendered permanently literate, so that almost that portion of them may be regarded its having already relapsed into illiteracy by 1931, resulting in a minimum estimate of 5,750,000 persons rendered literate in British India during the decade. Now the actual increase in the number of literates ill British India since 1921 is 4,073,030 a figure which is fairly comparable with the Education Department's estimate when allowance has been made both for the decrease to be replaced among previous literates on account of their normal morality during the decade and for causalities among the new literates themselves. The next marginal table, for comparison with the number of pupils per mile of population shown in the third, shows the number of pupils of the Exterior Castes and the ratio of literacy returned by members of these castes at the census. It should be explained that the departmental figures of depressed class pupils have been taken and the ratio per mille at school calculated on the census figures of the Exterior Castes for the various provinces shown.
It is possible that the actual castes treated as depressed or exterior do not entirely correspond, and although the castes treated as depressed or exterior do not entirely correspond, and although the differences is likely to be small, except perhaps in Bengal, where the figures include all “educationally backward’’ classes, the ratios must be treated with caution on this account. It should be added that the census figures for literacy in exterior castes are not quite complete as literacy figures were not available for about 8 percent.
Of those treated as exterior. The ratio however has been calculated on this remaining 92 percent., so that the small deficiency affects only the third column of the table.
The final table in this paragraph shows the number of the school for defectives and the number of pupils attending them according to the Education Department's returns, together with the ratio of those under instruction to the total number of blind and deafmute aged 0-20 as returned at the census from each province possessing schools of this nature. In addition to the schools shown in the statement there is a mission school for the blind at Rajpur, Dehra Dun, for which statistics are not available. The totals in the fourth and seventh columns include certain figures for institutions or for pupils whose precise classification as blind or deafmute is unknown. The percentage in the last three columns suggest that the instruction provided by these schools for the defective is virtually irrelevant.
Educated Unemployed
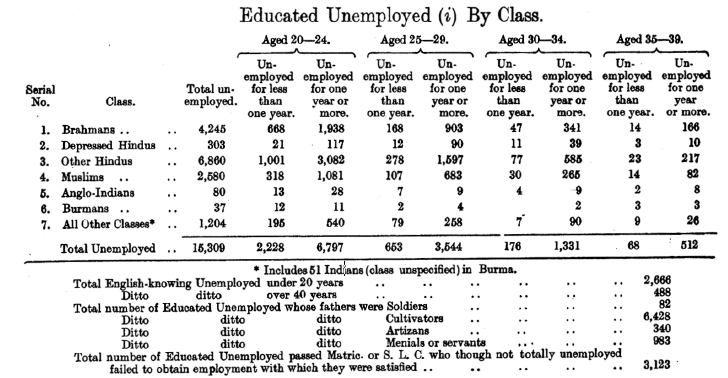
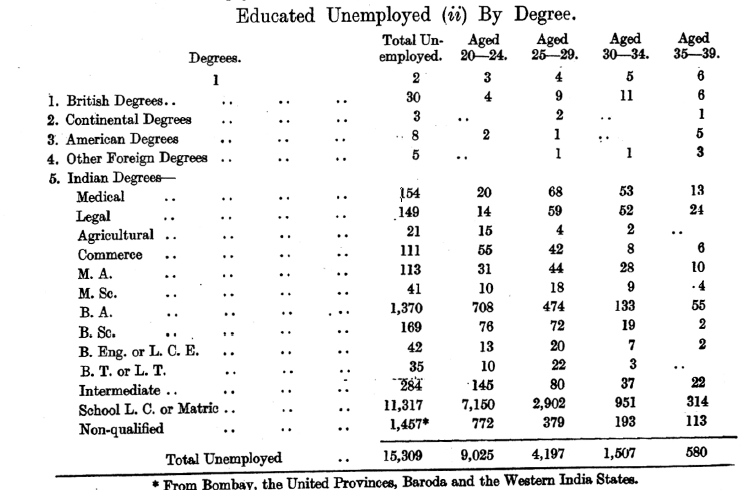
In response to requests from several quarters it was decided to attempt at the 1931 census to obtain figures of the educated unemployed generally believed to be exceedingly high. The general schedule was already inconveniently crowded, and as the return was intended to touch only those who were fully literate a separate schedule was prepared to be filled in by the enumerated himself and not by the enumerator. The instructions on the form employed stated that the information was required in the interest of the public, of the State and of the unemployed themselves, and it might have been anticipated that a general response would have been made to this effort to obtain information.
The attempt was however a failure, as though many forms were issued very few were filled in and returned to the enumerators, and although some provinces and states obtained figures which they considered were worth incorporating in their statistical tables, the results for India as a whole were so unsatisfactory that the figures must have been misleading if credited, and it was decided to omit them from part II of the India volume. Such as they are, they are included in this chapter, but the degree of their probable understatement may be inferred by a comparison of the figures with those obtainable from the Education Department. The latter showed that there were, in 1930, 25,716 candidates who passed for matriculation, 13,633 who passed the Intermediate Arts or Science examination, 9,300 who passed examinations for their B. A. or B. Sc., and 1,426 who passed examinations for their M. A. or M. Sc., a total of over 50.000 of whom over 10,000 were graduates, and the number of graduates turned out annually in India from 1921 onwards has not been less than 7,000 and has at least twice been over 10,000, making over 55,000 graduates alone between 1921 and 1930, apart from those who have failed to graduate ; in comparison with this the 15,000 odd returned as unemployed, most of whom were only matriculates, can hardly be regarded as affording a satisfactory explanation of the outcry there is about the lack of employment for the educated or the vast number of applications that are received for any vacancy for which some educational qualification is necessary.
The reasons given for the failure of the return were various. In Burma the educated but unemployed are largely Indians and mostly to be found in Rangoon.
The reason given for their failure to make the return was that they feared use would be made of it to repatriate to India those who were without employment. In Bengal the reason alleged was a fear on the part of the unemployed bhadralok that all that was wanted was a list of them for the police as political suspects, while another rumour accused the Government of trying to win over the unemployed from the congress party by false hopes of employment. In Madras the attitude of the recipient of the unemployment schedule was described as " You will not give me employment, why should I fill up your schedule ? " and it seems likely that this feeling, together with a dislike of admitting failure to have found employment and general apathy towards the census is to be taken as the most common cause of the schedule's failure. This failure is not only indicative of the uselessness of expecting to obtain a voluntary return of information failure to comply with which involves no penalty, but a warning against attempts to collect special information on separate schedules returned by the individual as distinct from information collected by an enumerator who retains the schedule himself throughout the proceedings.
In connection with educated unemployment and in explanation of what he aptly labels the cacoethes matriculandi the Census Superintendent for Assam quotes the following passage from a note written by Mr. Cunningham (many years Director of Public Instruction in Assam) for the Calcutta University Commission in 1917, and it is still true to-day :—
"There is a constant conflict in educational policy between the Government and people— the one desiring to improve the standard of education, the other crying on behalf of the hungry who are not fed, for the relaxation of standards and the wider spread of education, good or bad The privileged classes do not take to commerce or industry, the unprivileged follow the lead of the privileged. It has been said that in these parts the social order is a despotism of caste tempered by matriculation. It is only by matriculating and taking the part in the,after-life which has been reserved for those who have matriculated that the lower castes can raise themselves to consideration. It is only so that they can raise a representation strong enough to fight for their social and political interests ; and it is only by education that the privileged classes can qualify themselves to oppose effectively the conservatism of Government. On both hands this literary education is what every man desires. And if new ways are opened which lead to profit, the best amongst the lower classes will still press forward, undiverted, to the university unless the new employment is socially esteemed, and certificated by the fact that the bhadralog compete for it. "
The Census Superintendent himself sums up the position as follows :— " Matriculation has in fact assumed much the same importance in the social sphere as a public school education has done in England. The ambition to ' make a gentleman 'of their son is not confined to the parents of the lower classes of any one country and in Assam this takes the form of matriculation and a job which does not involve manual labour. The respectability of a community in Assam, can, in fact, be generally measured by the number of persons belonging to that community who are in Government service. "
