Census India 1931: Urban And Rural
This article is an extract from CENSUS OF INDIA, 1931 Report by J. H. HUTTON, C.I.E., D.Sc., F.A.S.B., Corresponding Member of the Anthropologische Gesselschaft of Vienna. Delhi: Manager of Publications 1933 (Hutton was the Census Commissioner for India) Indpaedia is an archive. It neither agrees nor disagrees |
Urban And Rural
Statistics of Urban and Rural Population
The statistics of the urban population are to be found in Imperial Tables I, III, IV and V. Table I gives the territorial distribution . of towns and villages and the figures of occupied houses and of the population separately for towns and villages ; Table III shows the population as distributed between villages and towns of different sizes ; Table IV gives the population of towns with the variations for fifty years, and Table V their territorial distribution and their composition by communities of different religions.
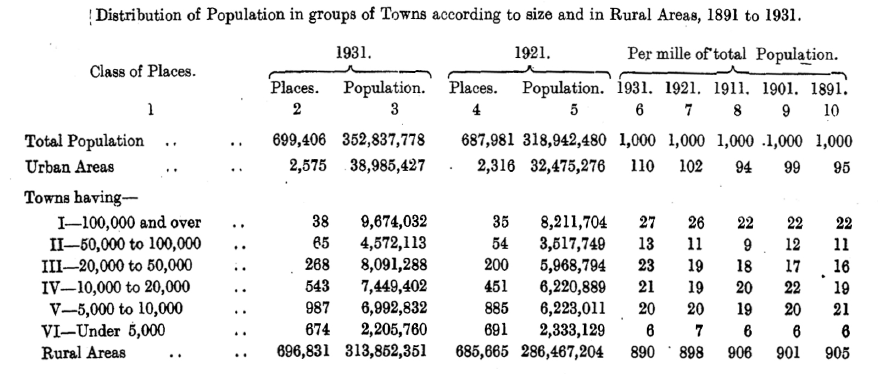
The floating population which cannot definitely be allotted either to the urban or to the rural totals, that is to say persons enumerated in railway trains, boats or temporary encampments, will be found separately in Table III, and is so small (0 . 14%) compared to the whole population dealt with that it can be ignored in any consideration of the comparative figures. The total percentage of the population censused as urban was only 11%, showing an increase in its proportion to the whole of 0 . 8% since 1921. That is to say 6,510,151 or 19.2% of the total increase of the population during the past decade has taken place in towns.
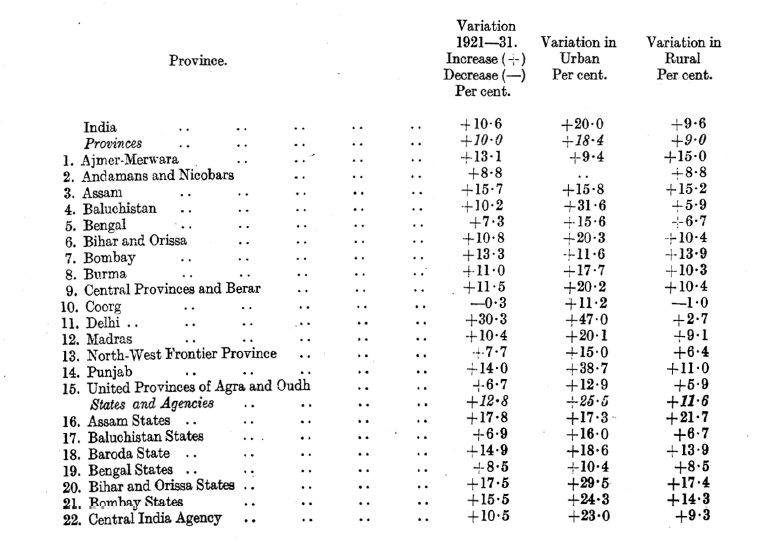
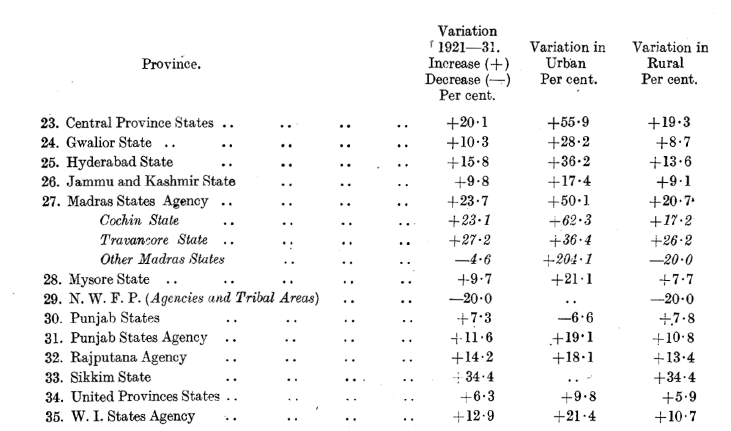
This increase is of course partly the natural increase of the pre-existing urban population and partly occasioned by migration from rural areas or by their incorporation into urban ones, while in estimating the growth of the urban population allowance must be made for the expansion of large villages to a size or importance which causes them to be classified as towns, and likewise for the omission of dwindling communities which fall out and are reclassified as rural. The tables therefore which deal with the changes in the urban population do not adhere to the population of the identical sites shown in the corresponding tables of former decades but give the total population enumerated in urban areas at the time of the census, as compared with the similar population ten years previously, the differences due to changing classification as urban or rural being shown in a supplementary table to Table IV. The accompanying table shows the variation in urban and rural populations respectively, and the very small proportion that the urban population bears to the whole is clearly indicated by the close relation between the variation in total population and that of the rural population as contrasted with the general antithesis between the total and the urban variations.
Definition of Urban Areas
Of a necessity the definition of a town for census purposes has resulted in a distinction which is sometimes arbitrary. Towns of not less than 100,000 inhabit- ants were to be treated as cities, and also an y other towns which the Superintendent decided to treat as cities subject to the sanction of the Local Government. But the Census Code further provided for the treatment as a town of every municipality, all civil lines not included in municipal limits, every cantonment and every other continuous collection of houses, inhabited by not less than 5,000 persons, which the Superintendent of Provincial Census Operations decided to treat as urban. in making this decision the Census Superintendent was instructed to take into consideration the character of the population, the relative density of the dwellings, importance in trade and historic associations, and to avoid treating as towns. overgrown ,villages without urban characteristics.
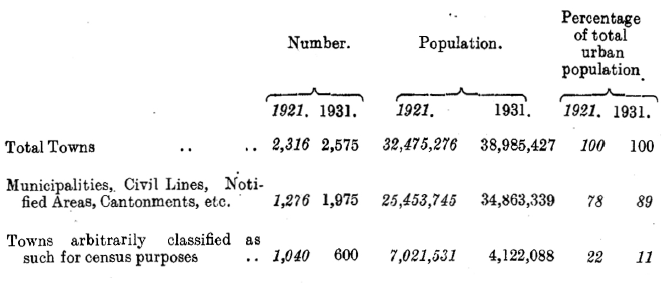
The effect of the latter provision is to be inferred from the marginal statement which shows that of a total of 2,575 places treated as towns in 1931 600, or 23'3°A, were places so classified by the Superintendent of Census Operations as (the quotation is from the Jammu and Kashmir State Census Code) " bearing the cachet of urbanity ", although not covered by the standard definition and therefore not possessing any urban self-government. On the other hand their inhabitants amount to only 4,122,088, or 10 . 6 % of the urban population, which indicates the comparatively small size of these towns. There has been inevitably considerable variation in the latitude observed by census superintendents in the exercise of this discretionary power of classification, with the result that the varying degrees of urbanization of different provinces cannot necessarily be taken at their face value. Thus Mysore appears as having a higher proportion of urban population than Madras, but 66 of its 108 towns have a population of less than 5,000, and if such towns be omitted altogether the position of the two units is reversed. Similarly both Bomba y and the United Provinces have large proportions of their total urban population represented by the inhabitants of small towns of 5,000 inhabitants or less.
In this connection it will be well to bear in mind that the distinction between a small town and a large village as far as the conditions of life or occupation of its inhabitants is concerned is often meaningless, and the treatment of any place as urban rather than rural dolls not necessarily imply any degree of industrialization and only the minimum degree of a corporate life distinct from that of the ordinary village ; to quote the Census Superintendent for Bengal " many of the non-industrial towns differ but little in their conditions from large villages, except in the provision of an infrequent lamppost ". A comparison with the figures of last census gives some indication of the spread of local selfgovernment.
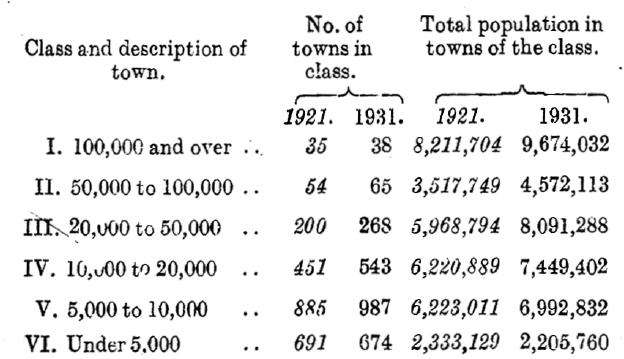
The greatest degree of growth has been in the number of towns with a population of from 20,000 to 50,000, the total population of which is now nearly double that of towns of 50,000 to 100,000 and not very much short of that of the 38 towns whose individual populations exceed 100,000. The number of towns has been increased at this census by the treatment of cantonments as separate entities instead of including their figures with that of an adjoining town.
Such inclusion may be justified in the case of suburbs, civil lines and notified areas which are more or less dependent for their existence on the proximity of a town, but a cantonment may be and frequently is not only of entirely independent origin and a self-contained unit, but actually indebted to the absence of a large urban population for the site chosen for occupation. Moreover even where it adjoins an old established urban area, the cantonment has a separate organisation and a corporate life of its own. Out of eighty-nine cantonments thirty- four have an elected board and thirteen a nominated board, the administration of the remainder being vested in a corporation sole All of these bodies have an executive officer usually provided in the case of the more important ones by the Cantonment Department. In any case the cantonment depends for its individual and separate existence on causes which are foreign to those governing the growth or decline of cities and towns, and it is therefore desirable to separate the population from that of the urban areas which they so often adjoin. This separation of cantonments has sometimes affected the classification of the town with which it was formerly combined.
The figures in the margin indicate how little change there has been in the size of towns during the decade and in urbanization generally.
Urban Population
The total urban population of India according to the above methods of classification comes to 38,985,427 or 11% of the total population. The distribution of the population between villages and towns is given in subsidiary table I to this chapter, the percentage of the population which is urban ranging from 3 '4% of the whole population in Assam to 22 6% in Bombay. Compared to this latter, the most urbanized of the major provinces of India., the proportion of the population classified as urban is 49% in France, 50 .8% in Northern Ireland, 53 .7% in Canada, 56 . 2% in the U. S. A. and 80% in England and Wales.
For reasons of economy in sorting, the available figures of internal migration are less detailed than in 1921, but the returns for twelve cities show that, out of a total population of 3,670,261, as many as 1,746,211 (1,155,543 males and 590,668 females) or 48% of the total population, were born elsewhere, the remainder being the' natives of their respective cities.
This, of course, does not represent the actual accretion from countries or towns, but indicates the maximum extent to which the population of urban areas is reinforced by immigration as distinct from natural increase. It is, of course, obvious that the composition of the truly urban population is likely to differ from that of the rural population of the surrounding area. It is in the nature of things that the more varied activities of towns should attract a mixed population with less homogeneity than that of the country-side. But beyond this, there appears to be a tendency for the population of towns in general to show different characteristics from those of rural areas in certain definite directions.
It is naturally to be expected that the percentage of literacy should be greater in towns, where opportunities for education are more readily available, and accordingly we find that 10% of the total literate population, and 29% of the total literate in English, is to be found in 38 cities, and the ratio of literacy to the total population is 27% in these 38 cities as against 8% in India as a whole. Figures for towns other than cities are not available but would probably much increase the ratio if they were.
The corresponding percentages for literacy in English are 10 . 3 and 1 . 0%. In the case of infirmities, no separate figures for cities are available but the figures for Bengal go to indicate that those infirmities to record which an attempt is made at the Census are not worse in cities than elsewhere, since the number of insane, for instance, returned from the Raishalli Division was 6,142 as against 4,245 returned from the Presidency Division. Census figures for infirmities are, however, notoriously unreliable and it is not safe to draw any conclusions.
Urban Sex Proportions
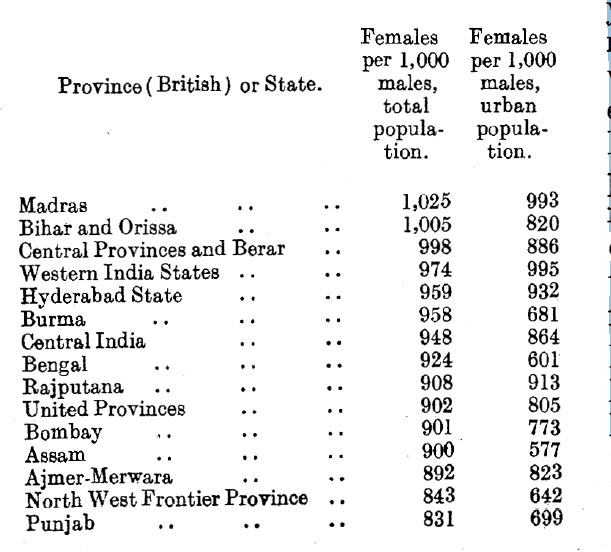
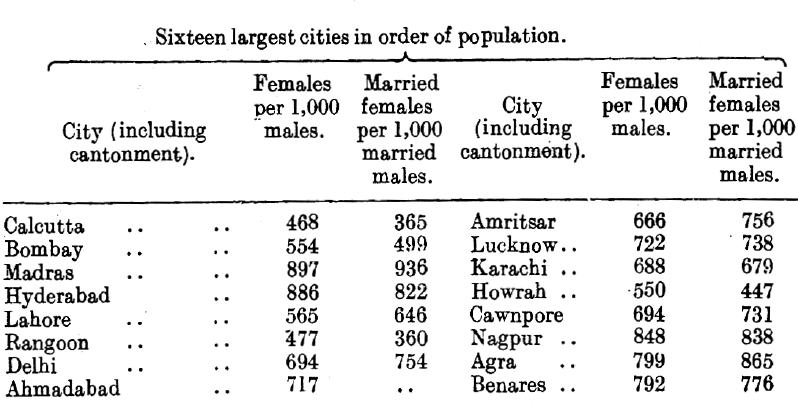
The figures for sex and age in cities have to be considered in the light of the common practice in India by which men leave their families in their homes in villages and go to earn their living as temporary or semi-permanent workers in towns. This naturally results in an excess of males of mature age in cities and towns which is illustrated by the figures in Table I for urban and rural population, where the number of females to every 1,000 males is 815 in urban areas, and 957 in rural as compared to 941 for India as a whole. Similarly the mean age for Calcutta males is 25 .8 and that for Bombay males 25 .6, years as compared with 23 .2 the mean age for males in India, as a whole.
This condition does not however apply to the whole of India, as in Rajputana the towns have 913 females per 1,000 males compared to 907 in rural areas*.
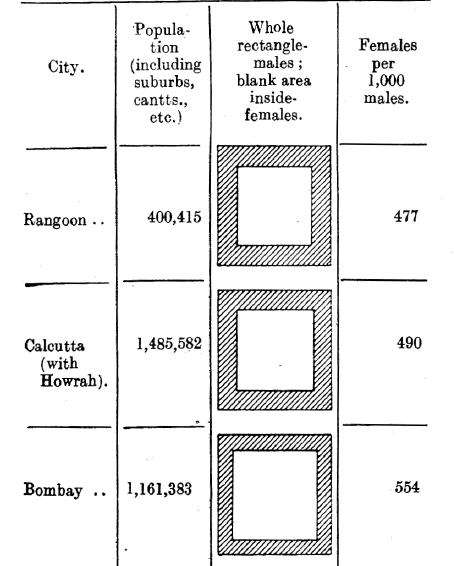
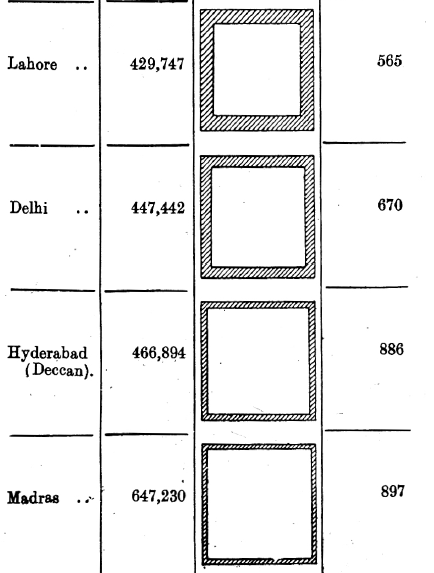
These towns are not, of course, industrial. The marginal tables show (1) the number of females in the urban population per 1,000 males for each of...the main provinces, and (2) for some of the principal cities, not only the number of females per 1,000 males but also the number of married females per 1,000 married males, indicating very clearly the unna aural life of the latter sex in some of the greater cities, which in the case of the men involves of course a corresponding number of women left by them in their homes.
A comparison of the 1931 figures for the provinces with those of 1921 indicates that there is nearly everywhere a considerable decrease from the 1921 ratio.
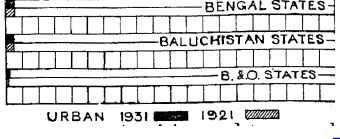
The only provinces or states in which the urban female ratio shows an increase are Burma, the North West Frontier Province, Baluchistan, Travancore and Cochin, while, excepting Burma, the decrease in the major provinces has been heavy. On the other hand Bombay City which had 664 females to every 1,000 males in 1881, 586 in 1891, 617 in 1901, when the impermanent population was depleted on account of the plague, 530 in 1911 and 525 in 1921 had 554 in 1931, showing a fair increase, probably due however, as in 1901, to depletion of floating male labour, this time on account of the depression in trade. In the accompanying diagram the figures represent the total figures, including suburbs omitted in the table preceding it.
In the more purely industrial towns such as those of Gujarat the ratio is much less unequal than in the cosmopolitan ports. It might be expected that decaying towns would show a rising female ratio since such a town not only fails to attract immigrants but might be presumed to tend towards sending out male emigrants to earn an industrial living by some urban occupation elsewhere.
The Census Superintendent of Bengal However, has shown that the decaying A towns of that province have a falling female ratio, a phenomenon often to be associated with a decline in population in other parts of the world, but not. „ apparently in India generally. In the case of cities which include cantonments allowance must obviously be made for the fact that a disparity in the numbers of the sexes is a necessary sail, concomitant of the concentration of troops. In the main India tables however, that is in Tables Ill, IV and V, cantonments have been separately shown and are not included in the figures for cities, though in the special tables for cities from Table VI onwards cantonments, etc., are generally included.
Race and Religion In Towns
It was suggested in the Census Report for 1901 that there were possible connections between race and religion and the practice of congregating in towns One of the reasons given for the comparative absence of the urban habit in Bengal was the presumption that its population contained a strong mongoloid element, and it was pointed out that the inhabitants of Assam and Burma, both much more mongoloid than Bengal, were even more markedly rural.
It may, however, be questioned whether race has in this case anything to do with the matter, and we should be inclined to account for the phenomenon not by race but by rainfall. The areas of the greatest precipitation in the peninsula are the Malabar Coast, Bengal, Assam and Lower Burma, and if living in cities is unpopular, as it certainly is, in these regions it is perhaps rather on account of the greater de gree-of discomfort which it involves than on account of the racial composition of the people. The population in at any rate two of these areas has an excessively high density, and one which easily compares with that of drier provinces of greater urbanization ; on the other hand it is spread, where it is thickest, through almost contiguous but rural habitations among coconut groves and rice fields. In northern India it is not impossible to live in a walled village or town and to move about freely on the face of the land during the greater part if not all of the year. In Eastern Bengal or Cochin the heavens are overcast and the land is awash for nearly half the year, and man or beast can only roam in or on the face of the waters, a condition which makes sanitation and evaporation very much more difficult to obtain in closely agglomerated habitations than in scattered homes each in its own demesne. On the other hand in southern India the Tamil as distinct from the Telugu, Kanarese or Malayali does appear to be predisposed towards urban life.
It was further observed in 1901, though no explanation was suggested, that towns attracted population of different religions in varying degrees, and it was pointed out that whereas in Bengal, Baluchistan, Assam and the Punjab the Muslim took less readily to town life than the Hindu, the case was reversed in most other parts of India, particularly in the TJnited Provinces, the Central Provinces and Berar, in Hyderabad, Madras, Mysore and Rajputana. Clearly the reason has nothing to do with religion. Probably it is to be traced to historical causes, and it would appear, as might perhaps be expected, that the intrusive population is that which tends to prevail in the towns. Thus in Rajputana, Bombay, the Central and the United Provinces, and in southern India generally Hindus represent the country stock established before Islam appeared, and it is natural to find that on the land the Hindu still predominates. Conversely in Baluchistan and the North .
West Frontier Province the Hindu is nowadays intrusive and we find that he tends there to congregate in cities. In the case of Burma both are intrusive, but the Muslim has shown a greater tendency to intermarry with the Burman and to settle locally, while many of the Muslims of Burma (Zerbadis and Yakaing Kalas) are more Burmese than foreign in descent. Consequently we find that the Muslim in Burma shows a greater tendency than the Hindu to leave the towns. The two provinces which at first sight appear to spoil this hypothesis are Bengal and the Punjab. Here, however, the inversion of the usual condition' would seem to be due not to a breach of the rule that the intruder clings to the towns but to the fact that the country dwellers have been converted on a much larger scale than elsewhere.-
The Muslim of East Bengal and of the Surma Valley in Assam seems to be descended for the most part from converted inhabitants, and similarly conversion to Islam was probably imposed on the Punjab with more persistence and efficacy than in parts of India more remote from the course of Muslim invasions and added later to the Mogul dominions. Apart from this the trading classes, which are often racial or religious, naturally tend to be town dwellers, so that Parsis and Jews can hardly be found elsewhere, and Jains, who include large numbers of the Marwari and Kathiawari traders, are more urban than communities of other faiths. Thus too Sikhs who are rural at home are town dwellers elsewhere, whither they go generally as mechanics or artificers of some kind. It remains to be added that the figures of some urban communities in the Punjab may have been slightly affected by intensive propaganda aimed at bringing rustics into the towns on census night to swell if possible the numbers of one electoral community or another, and one or two similar cases occurred in the United Provinces. Where this is alleged to have taken place, however, there seems to have been little or no change in the proportions borne by the community to another.
Cities.
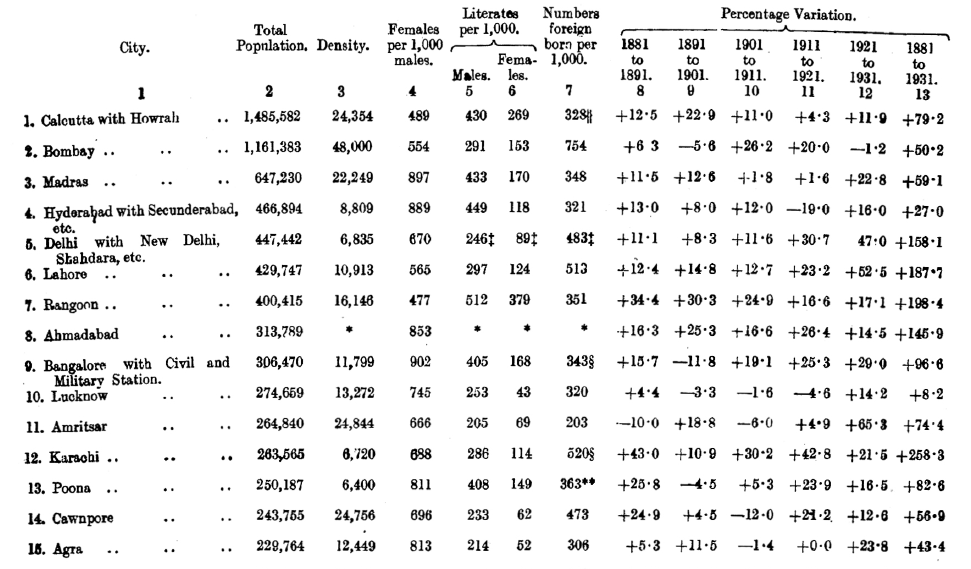
The table below gives a summary of certain information with regard to cities, that is with regard to those which have not less than 100,000 inhabitants. Their figure is moderate enough when compared with those of the west. The United Kingdom alone is unfortunate enough to have 56 towns of over this minimum compared to India's 39, while the United States of America have at least 70, though their population is only 123 million, little more than a third of India's.
The figures given in column 7 are not all strictly comparable one with another, as the definition of foreign born ' adopted by different provinces varies. Thus in Calcutta the figure refers to those born outside Bengal, in Hyderabad and Lahore to those born outside the City but in Srinagar to those born outside the State, and in the case of eight other towns tolorn outside the District.
Only seven of the above cities have more than 400,000 inhabitants, and these will be mentioned severally below. Of the rest it must be pointed out that the figures for Ahmadabad are more or less conjectural. That city determined on a boycott of the census in conformity with the Congress programme and the opposition was so well organised that a complete census could not be taken. Like other cities in Gujarat it consists largely of pols, that is of blind alleys tenanted by a caste community having their own outer gate which affords the only access to the individual houses in that particular block. These pOls shut and barred their doors on census night and defied the enumerators to enter. With the aid of police an entry was forced into many of the non-cooperating pas, but even then the obstruction to and interference with the enumerators was continuous and most of the inhabitants remained out of doors in the streets, making the taking of a census impossible in many parts of the city.
As it was, the census was carried out effectively in six out of 24 wards. In the other 18 wards the census was partially carried out with varying degrees of incompleteness. The total figures obtained by count were therefore much short of the total population figures given in Table IV, in which the figures formed represent a conservative estimate of the total population by sex, the actual figures obtained by enumeration appearing in Table V.
The Ahmadabad Municipality have since taken a census of their own (in July 1932), and though the result cannot be officially recognized and came too late to make possible a revision of our 1931 estimate, there is no reason to suppose that it is not substantially correct and it is certainly more likely to be accurate than the estimate adopted for the India Tables ; the population figure according to the municipal census is 382,768.
Calcutta
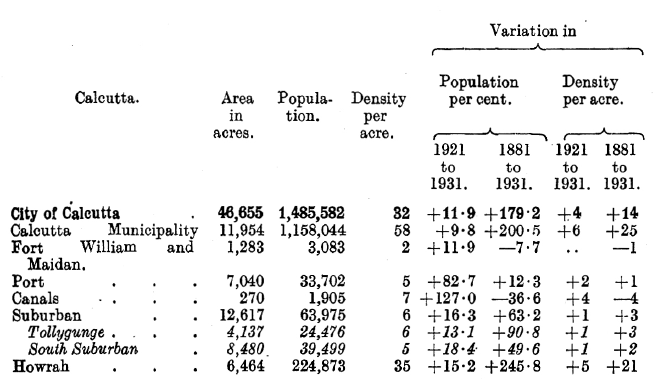
The City of Calcutta includes the municipality of Calcutta, with the military area of Fort William, the Port and Calcutta Canal area, the two suburban municipalities of Tollygunge and South Suburban and the municipality of Howrah west of the Hugh river linked to Calcutta by a bridge that has been inadequate now for many decades.
In addition to its permanent inhabitants Calcutta City contains by day a temporary population, which comes in to work and returns at night to homes outside, of not less than 26,000 (the number of season tickets in force on local railways On the night of the census) and probably of well over 30,000, for many 'buses serve the municipalities north of Howrah. One of Calcutta's wards, Muchipara, contains a population of over 80,000 and there are nine more with from over 40,000 to over 79,000 inhabitants. The average density of Calcutta municipality is 37,120 persons per square mile, and for the whole of the city east of Hugh it is 19,840, while Howrah has a density of 22,400 per square mile. In the centre of Calcutta the highest density is reached in six wards which have 112,000 per square mile or over, while there are another five with over 100,000.
The increase during the decade was 11.1 per cent. in Calcutta proper, 15.2 per cent. in Howrah and 16.3 in the suburban municipalities, figures however which barely reach the half of the increase that took place between 1891 and 1901 in the case of Calcutta and Howrah. Of the city's total population of 1,485,582, 998,656 were born in Bengal ; the two provinces contributing most heavily to the immigrant population are Bihar and Orissa, 264,332, and the United Provinces, 43,345, Rajputana coming next with 16,273. The latter immigrants are mainly traders with their dependants. The number of females per 1,000 males for the whole population is 490, but among immigrants taken alone there are only 236 females to every 1,000 males, and there are actually more females (361) per 1,000 males among immigrants from outside India then there are among immigrants from other Indian provinces. In every 10,000 of each sex 4,302 males are literate and 1,213 females, and the corresponding figures for literacy in English are 2,191 and 832.
The population of Calcutta City includes 16,234 persons of European race, 746 Armenians, 579 Japanese and 3,046 Chinese. Of those of European race 1,256 are non-British subjects. Anglo-Indians number 18,469.
Bombay
Bombay City includes the main island occupied by the town together with the four islands in the harbour, viz., Cross Island, Middle Ground, Oyster Rock and Butcher Island. Its area has increased by some 415 acres since 1921, as a result of the Back Bay reclamation. The census was taken by the Executive Health Officer, under the general supervision of the Census Superintendent, in circumstances of considerable difficulty on account of the civil disobedience movement, and showed a population of 1,161,383.
The Bombay-born population, which was only 16 per cent. in 1921, has gone up according to the figures of birthplace to 24 . 6 per cent., but there is some doubt as to whether the returns are accurate in this respect. On the other hand an increase was to be expected as a result of the absence of much of the periodic migratory population. Immigrants from Portuguese India number some 39,000, an increase of over 4,500, but Europeans have fallen from 13,544 in 1921 to 8,400 in 1931, 1,009 of whom are non-British subjects. This fall in number is largely but not entirely attributable to a reduction in the number of British troops.
A very high proportion of the Bombay population, 20 . 4 per cent., is drawn from the Ratnagiri District farther down the coast. As in other cities—Rangoon for instance—there is a disproportionate number of persons in the age groups from 20 to 40, and the female ratio, though higher than at any census since 1901, is excessively low, being only 554 females to every 1,000 males, though the ratio in the city-born population is 728. The percentage of literacy has increased from 23 to 24 only, but that of literacy in English from 8 to 11 . 6. The only industry conducted on any large scale in Bombay is that of cotton textiles ; shipping, including both owners and employed, brokers, mariners, boatmen, etc., only accounts for 25 per mille of the total following occupations of all classes. The mean density of the Town and Island in 1931 was 48,000 persons per square mile, a decrease on the density figure of 1921, probably to be accounted for by the absence in certain areas of the floating cold weather population owing to the trade depression. In most parts of the city, however, the density is very much greater than the mean figure.
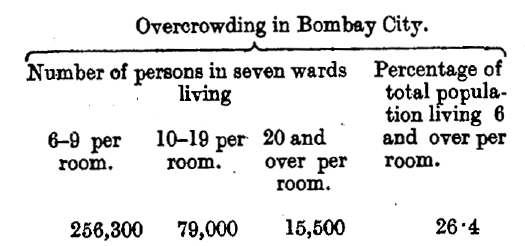
In the Kamathipura quarter it is 385,280 per square mile, in Nagpada II it is 407,040 and in the Kumbharwada quarter 465,280 persons per square mile. At least 36 per cent of the population of the city suffer from gross overcrowding
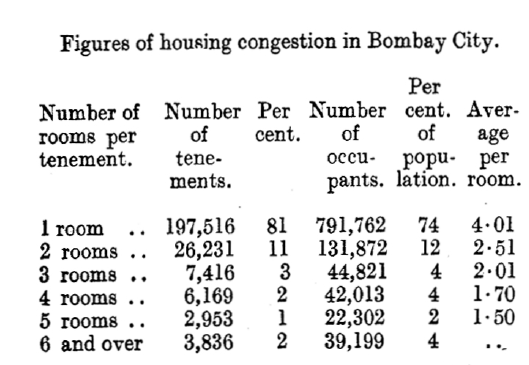
Of all tenements 81 per cent are one-roomed and the average number of persons to each of those rooms is 4 .01, but that gives little notion of the congestion at its worst, for 256,379 persons live in rooms occupied by 6 to 9 persons each, 80,133 in rooms of 10 to 19 persons each and 15,490 in rooms occupied by 20 or more persons to each room. These alone comprise between them 30 per cent. of the city's population, and it can hardly be imagined that all those living at the density of less than 6 to one room are free from overcrowding, and 74 per cent. of the city's population- close on 800,000 persons that is, live in one-roomed tenements. - Byculla, Sewri, Mazagaon, Parel and Nagpada II are the • worst quarters, and 99 per cent. of Byculla's population live in one-roomed tenements ; in Mazagaon, where 88 per cent. live thus, the average number per room is 4.95. For the vast majority of Bombay's population the available floor space per head is about six foot square, and while very few of Bombay's population live in tenements of as many as three rooms " there is greater pressure on the floor space of three-roomed tenements than there is on the floor space of one-roomed tenements in London ". Bombay is, therefore, to be congratulated that her population has at any rate fallen by 1 . 2 per cent. since 1921 ; probably the missing population is to be congratulated likewise.
Madras
The growth of the third presidency town has hi the past been very much slower than that of Calcutta or Bombay. There was some growth between 1881 and 1901 after which the population increased little during the next two decades The last decade however has shown almost double any previous recorded decennial increase.
This amounted to 22 . 8% as compared to 1.6 and 1.8 during the previous decade and the one before that respectively. Industrial development has been marked and the tariffs have enabled the creation of pencil, match and tobacco factories, bins being made and exported in some quantity. Communications within the city have been much improved and an extension to the south-west has added a populous and growing suburb of the garden-city type. Nevertheless Madras still has a higher number of persons per occupied house than any other town in the presidency, having 877. persons per 100 occupied census houses, a congestion on one aspect of which the Census Superintendent is quoted in paragraph 51 below. The actual state of congestion varies much between the true city area and the residential suburbs. Two-fifths of Madras' wards have 64,000 persons to the square mile.
Hyderabad
Hyderabad City, the capital of H. E. H. the Nizam's Dominions, tlYdOrabad' covers an area of some 53 to 54 sq. miles and includes not only the city proper but its suburbs, the Hyderabad Cantonment, the Residency area and the Secunderabad Cantonment with Bolarum and Trirnulgherry. The area occupied has doubled since 1901 but the population is now little more than it was at that census, although it was returned as over half a million in 1911. The mean density is 8,809 to the square mile, but rises to 9,956 for the total area within the walled city, while the various wards and suburbs vary from 3,692 persons per sq. mile in the Rerun ward VII to 65,141 in the Andarun ward. IV, the three other Andarun wards varying from 22,623 per sq. mile to just over 38,000. It may be added that the density of Andarun ward IV appears to have decreased by 47% since 1901.
The activities of the City Improvement Board and the demand for large buildings for Government offices, colleges, etc., are reported to be causing a great shortage of house accommodation in the city Andarun, which is leading to a gradual movement of population from the walled city to the suburbs. During the decade plague has been recurrent in most winters, radiating " from the congested grain markets to the outskirts of the City ; cholera, small-pox and the perennial malaria were additional causes of ill-health ". The city Improvement ,Board has cleared away part of the " crowded and insanitary slums " opening out fresh suburban sites on which-
"New roads were laid out, drains constructed and rat-proof houses built and rented to some of the poor who were dishoused. The well-to-do have moved out into the open country round about the City and built houses for themselves. Government very generously advanced loans to its officers for building houses. Thus the City has expanded in area, the continuity of houses in some directions reaching distant villages of certain adjacent taluks. Extension of roads to the new areas, facilitating motor service and improvement of suburban railway communications, have not only brought distant mohallas within easy'reach of city dwellers but also helped them to develop urban characteristics. Drainage for carrying sewage and storm water has been laid and numerous disused wells which bred mosquitoes closed down. The health of the City has thereby much improved."
Delhi
Delhi's period of growth starts from 1911 when it became the Capital of India. As a City it must be held to include Old Delhi City and the Notified Area adjoining it, New Delhi, the New Delhi Cantonment and the suburb of Shandara.
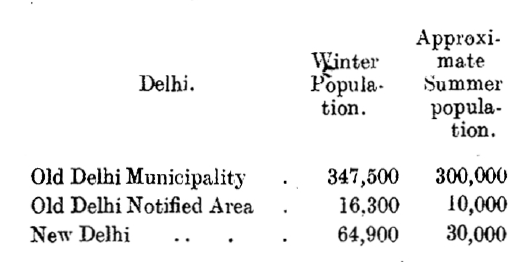
The latter suburb is across the Jamna, but is hardly more cut off from the two main urban areas than is the Cantonment, and houses a considerable number of persons whose daily employment is in Delhi proper. The population varies very greatly between winter and summer, and the census was taken when the population was almost at the maximum. An idea of the extent of the fluctuation in numbers is given by the marginal figures, though there is some change also in those of the Fort and Cantonment and probably too of Shandara. The congestion in Old Delhi Municipality to which reference has already been made in paragraph 19 (Chapter I) is to some extent relieved during the summer by the migration of appreciable numbers of the inhabitants of the Old Town to the empty quarters in New Delhi whose occupants have moved up to Simla for the hot weather or returned to their homes in other parts of India.
The excessive density of Old Delhi Municipality (58,273 persons per sq. mile) has been mentioned ; that of New Delhi is 1,524 per sq. mile and of Shandara 6,120. Taking the whole of the city there are 454 persons to every 100 census houses, but this number rises to 473 in Old Delhi Municipality and to 629 in its Churi Walan ward, while the Qarol Bagh ward has 605 and the lowest average is 399 per 100 houses in the Lothian Road ward. Generally speaking the overcrowding is by no means as bad as that in many other cities of India, but partly perhaps as the result of an inadequate water supply the death-rate in a heat wave is serious. The population Lahore. Rangoon. Race.. Numbers. les per 100 males. Burmese 121,998 100 Karens . Other indigenous 2,358 2.358 80 Indo-Burmese 12,560 105 Indians . 212,929 24 Chinese 30,626 54 Anglo-Indians 9,977 97 Europeans . 4,426 53 OOtthhers Total 2315 400,415 71 48 proportion of females to males for the whole population the deaths exceed the births by an amount, according to the vital statistics, of about 46,000, so that the increase of 55,000 during the decade implies an immigration figure of 100,000 during the same period, if the vital statistics can be trusted. The total female ratio has however been rising, being now 48 per 100 males compared to 41 in 1911, and the proportion of foreign born has fallen from 583 per mule in 1911 to.the present figure of 509.
The distribution between a town and a village however arbitrary is easily effected on a numerical basis, but the definition of the village as a unit is by no means always so easy. As has alread y been indicated, the thickly populated parts of the Malabar Coast and of Bengal are often occupied by a series Of homesteads, which may be grouped in • villages for administrative purposes but which do not thereby acquire any of the characteristics of the .compact determinate village of Upper India, leaving it difficult to say where one village ends and another begins. The mama, on the other hand, which is the revenue unit, is rather administrative than geographical and may consist of 'quite separate hamlets or even contain no houses at all. In the hills the conditions are generally the reverse of those of Delhi City as a whole has nearly doubled since 1911.
Lahore
The City of Lahore, the capital of the Punjab, includes a municipality and a cantonment covering together an area of over 39 sq. miles and containing a population which has increased by 52 . 5 per cent. since 1921 and now amounts to 429,747, of which slightly over 400,000 occupy the old walled city and the town and civil station outside it. Inside the walled city there are 176,792 persons living at a density of 198,500 per sq. mile. The increase in population during tie last decade has naturally taken place outside the walls, and a chain of dwellings now links the civil station to the cantonment. More than half the inhabitants were born outside the city, and nearly half were born outside Lahore district. Growth has been very rapid since 1881 (187 - 7%).
Rangoon.
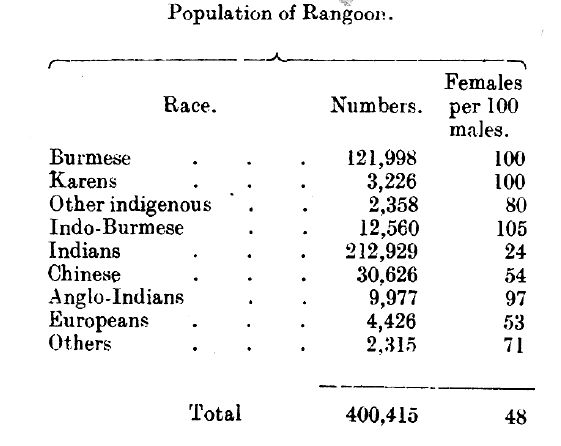
The City (,1 Rangoon includes both municipal and cantonment areas and the Port of Rangoon part of which is outside the former. The population has increased from 341,962 in 1921 to 400,415, but part of this increase is due to the extension of the city limits, and the increase since 1921 on the whole area now included is 15 . 9 per cent. If the adventitious population numbering 22,317 at this census, and including the floating population of the port, inmates of jail, etc., be excluded at both censuses, the decennial increase.,becomes 17 . 7 per cent. The density of the city is 16,146 persons to the square mile. The population is largely immigrant with a consequent disproportion in the numbers living at age groups 20 to 40 and in the ratio of females to males.
Thus cf the Telugus in Rangoon, mostly unskilled labourers, two-thirds are found in age groups 20 to 40, and there are only 20 females per 100 males, an inequality of ratio still more pronounced among Oriyas with 7 and Chittagonians with 2 females to every 100 males. Of every 1,000 persons in --, Rangoon 509 come from outside Burma of whom more than 450 are Indians, while the total Indian population is 532 per 1,000. Seven and a half per cent. are Chinese and about 4 per cent. European or Anglo-Indian. Nearly one half (496 per mule) were actually born either in India or China and little over a third (351 per mule) in Rangoon itself Of males alone 633 per mille were born outside Burma, while in the case of females on the other hand 750 per mille were Burma-born.
Owing to the small proportion of females to males for the whole population the deaths exceed the births by an amount, according to the vital statistics, of about 46,000, so that the increase of 55,000 during the decade implies an immigration figure of 100,000 during the same period, if the vital statistics can be trusted. The total female ratio has however been rising, being now 48 per 100 males compared to 41 in 1911, and the proportion of foreign born has fallen from 583 per mule in 1911 to.the present figure of 509.
Rural Population
The distribution between a town and a village however arbitrary is easily effected on a numerical basis, but the definition of the village as a unit is by no means always so easy. As has alread y been indicated, the thickly populated parts of the Malabar Coast and of Bengal are often occupied by a series Of homesteads, which may be grouped in villages for administrative purposes but which do not thereby acquire any of the characteristics of the .compact determinate village of Upper India, leaving it difficult to say where one village ends and another begins.
The mama, on the other hand, which is the revenue unit, is rather administrative than geographical and may consist of 'quite separate hamlets or even contain no houses at all. In the hills the conditions are generally the reverse of those in the plains ; that is, where the population is thickest it is found in concentrated villages, as on the N. E. Frontier, whereas when very thin it seems to be spread about in isolated homesteads or scattered hamlets as in the Simla Hills. In Baluchistan, where a large proportion of the population is still more or less migratory, villages are becoming more scattered as the need for defence ceases to be felt. This indeterminate nature of the village unit, which may be a definite residential site, walled or palisaded, or may be an administrative unit containing several residential villages or a number of scattered houses, impairs the significance of the figures of the population as distributed in villages of various sizes.
Population,for instance, shown as residing in a village of 2,000 to 5,000 persons may really be the population of a mauza containing several small residential villages of less than 500 persons each, whereas a number of villages of less than 500 may really be contiguous hamlets of scattered houses that might just as well be shown as one large village. Generally speaking, however, it may be said that of the total population of India 89 per cent is rural, more than half lives in villages with a population of under 1,000 and nearly one-third (27 . 6 per cent) lives in villages with a population of under 500 persons.
Houses and Families
Ambiguity has characterised the ttrms, ' town ' and ' village ' and it attaches again to the term ' house '. The term house ' in India covers the greatest diversity of dwellings. The portable screens of bamboo matting carried on a gipsy's ass, or the camel-borne tent of a Bugti nomad are less primitive than the mere foliage wind screens of some of the Andamanese but still hardly conforming to the usual conception of a dwelling-house, though this term can fairly be applied to the conical grass huts of the Chenchu and the Bhil and still more to the thatched and matwalled dwellings, often: on piles or in trees. erected in the hills alike of Assam and of Travancore.
In Bengal the thatched roof is hogbacked to increase the resistance of the gables to the rooflifting cyclone, while on the west coast the typical Nayar house has picturesquely cocked gables on a very steeply pitched tiled roof the better to resist the torrential rain. Indeed the houses of the well-to-do in Malabar are built round an open impluvium on to which a pillared verandah opens giving access to all the rooms, one of which is reserved as in an ancient Roman house for the lares and penates. In Upper India on the other hand, the mud wall and flat roof of a dry climate prevail, while the rich surround their houses of brick or stone with a walled enclosure and ensure privacy by the greatest economy in windows.
Almost everywhere the tendency is apparent towards the replacement of traditional roofing materials by corrugated iron sheeting as ugly as ubiquitous. If the house may vary from the chawl dwelling of a large town to a sprawling bari in the country, so too the family is a difficult unit to define in correspondence to the house. Apart from the collective houses of some of the hill tribes which accommodate all the bachelors or spinsters of the village, a Bengal bari, may house a joint family of several married couples in contrast for instance to the Assam hill custom whereby the elder sons, or in some tribes the elder daughters, set up new houses for themselves or, as in other cases, turn their parents out of the ancestral home to build a house for themselves elsewhere.
It was therefore necessary to define the house for census purposes, since a house is far from being a constant unit ; and generally speaking a census house meant the buildings, several, one, or part of one, inhabited by one family, that is by a number of persons living and eating together in one mess with their resident dependants and their servants residing in the house. Even this wide definition proved difficult to apply universally, as it is defeated by the Santal, for instance, whose married sons have entirely separate establishments but resort to their father's house for meals. In the case of town houses it was generally provided that the house for census purposes should be taken as any part of an inhabited building with a separate entrance, which is in practical conformity with the definition of a house given above.
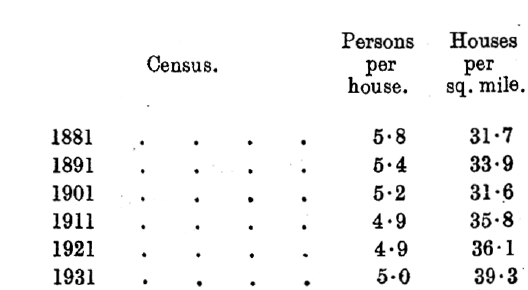
The marginal table gives the number of persons per house and houses per sq. mile in India at successive censuses. Figures for the provinces and states are given in subsidiary table VI at the end of chapter I. The comparability of the figures of different censuses is to some extent vitiated by changes in the definition of a house, as the structural definition adopted in 1872 has gradually given way to the social one given above, but has not yet been uniformly accepted or rejected by all provinces and states.
Pressure of Population Upon Housing
It has already been indicated that city dwelling is not generally congenial to the Indian, and indeed since India is primarily an agricultural country it could hardly be expected that a high proportion of its population would be found in towns.
The Census Superintendent for Mysore State quotes a Kanarese proverb " after ruin go to the city ", which is sufficiently expressive of the general disposition towards a town life, though it is somewhat typical of the Gujarati and of the Tamil to show a greater inclination towards a town life than most Indian races. It is however to the general absence of such an inclination and to the general absence of industrial activity that the slow growth of urbanization is to be imputed. There are only 39 cities of over 100,000 inhabitants in the whole of the Indian Empire, and the general growth of the urban population has been 20%, while 10% has been that of the rural, although the city of Bombay has actually decreased in population during the decade. On the other hand there has been 2 1 very rapid growth in some towns. While Calcutta has increased by 12 per cent., Rangoon by 17 per cent., Madras by 23 per cent., Karachi by 23 per cent. and several other cities by 20 per cent. or a little over, Patna has increased by 33 per cent., Delhi City by 40 per cent., Bangalore City by 45 per cent., Nagpur by 48 per cent., Lahore by 53 per cent.
Amritsar by 65 per cent. and Salem by 96 per cent.* The number of occupied houses has not generally increased in proportion to the population though that is not to say that it has not increased proportionately to the number of families, since much of the increase must have been counted in children, while in some cases, e.g., Bangalore Civil and Military Station, houses have increased at a greater rate than the population. At the same time there is very serious congestion in many towns, and the density of urban population is in some cases almost as excessive by western standards as is the density of rural population in the more fertile areas.
Thus the density of Belfast County Borough is 17,984 persons per square mile (1926) and the average density of a London County Borough (1931) is 37,568 persons to the square mile, a density which reaches its maximum in Southwark with 97,088 to the square mile. Leith (1931) has 35,000 persons per square mile and the Govan ward of 'Glasgow, its most densely populated in 1931, has 36,230. With these figures we may compare, the densities of Lahore with 10,913 persons to the square mile, of Peshawar City with 22,830 and of Calcutta with 36,265 ; while half a dozen towns in the United Provinces, including the city of Moradabad, show a municipal density of from 40,000 to 45,000, Bombay has 48,000, Delhi City (Municipality) has 58,273, and Sikandrabad, a small town in the United Provinces, has 63,552 persons per square mile. But if smaller units be taken the densities found are much higher. Two-fifths of the wards of Madras show a density of 64,000 persons to the square mile ; two-thirds of Madura's wards show a density of 64,000 and one ward that of 123,000 ; three wards of Peshawar have densities of 121,600, 131,840 and 188,800 per sq. mile respectively ; the old walled city of Lahore contains a population of 177,000 persons living at a density of 198,500 per square mile, and although nine-tenths of Lucknow shows a density of under 32,000, parts of the Yahiaganj ward of that town have a density of 423,000 to the square mile.
The Kumbharwada quarter of Bombay has 465,280 persons to the square mile. In Cawnpore there is a substan tial area with a density of over 100,000 and in Chak No. 95 Talaq Mahal of Anwarganj ward in that city the density of 786,560 persons per square mile is reached. It is necessary in this connection to consider the size of families and the extent to which they are crowded into single rooms. It must not be forgotten that houses of more than two storeys are probably rather the exception than the rule in Indian urban areas, while even in towns one-storied houses are perhaps even more plentiful than those of two. Thus of the total number of 24,579 structures in Baroda City 10,653 had one storey only, and those with more than two storeys numbered only 3,699, while of the houses in Bombay three in five have only one storey, and in Karachi 77 .6%. The definition of a house must likewise be borne in mind, and this in urban areas generally depended on the existence of a separate entrance rather than of a separate building. The average size of a family is a third important factor.
This works out in Lucknow for instance at 4 .6 persons but over 14 per cent. of families were found to have 8 or more members. In Travancore the average number of persons in a household is 5 . 5 and in Rajputana it is 4 . 7. In Cawnpore the average family consists of 3-5 only, but that is due to the presence of large numbers of industrial workers who leave their wives and children at their homes in villages. Industrial workers form a very small minority of the urban population, and it seems that taking India as a whole the average family contains from four to five individuals. When therefore it is seen that in Delhi, for instance, the average number of persons per 1,000 houses varies according to the ward from 399 to 629 it seems likely that most families get a census house to themselves. Madras on the other hand has 877 persons per 100 houses, Rajahmundry 793, Mangalore 727, Madura 723, Vellore 709 and three more towns more than the maximum average of any ward in Delhi. It is not possible that these figures should represent a distribution of a house per family. Of Madras itself, however, the Census Superintendent writes as follows :-
"A marked feature of Madras is the street-dweller and squatter. A midnight tour of the central and northern parts of the town any fine night would disclose sleeping persons on every sidewalk. These persons are not all tramps by any means ; the majority indeed are ordinary citizens in everything but the possession of a roof. Such a possession has no great inducement for a population of floating labour in a mild and pleasant climate, in a city where houses are scarce and rents often exorbitant. The figure for Madras may be indicative of a higher number of persons per dwelling than is desirable but before it could be taken as an accurate guide, the street-dwellers and squatters would have to be deducted from the total population used in striking the average. Madura's figure involves to some extent a similar qualification, for to this sacred city of the south wanderers resort in large numbers throughout the year ".
It would be unsafe however to regard this factor as operative in the case of the other towns mentioned, though it is undoubtedly indicative of one factor which distinguishes overcrowding in the east from that in Britain, that is the greater extent to which an open-air life is possible, since weather conditions which coinpel retreat within doors are very much less prevalent. In Bombay the overcrowding is so great that men have to sleep out wherever possible, and in the monsoon, when the pavement is impossible, verandahs, alley-ways and stairs are all crowded with slumberers.
We have now to return to the census house. This is normally the dwelling of a commensal family, and in towns is usually determined by the existence of a separate entrance, but it very often implies no more than a single room like one of the small compartments provided for servants in the compounds of larger houses.
The small- size of such rooms may be judged from the density of the population when considered with the absence of lofty houses. A one-roomed tenement in Bombay normally varies from about 10X10 feet to about 12 X 15 feet, and the average per room is more than four persons, who have therefore each on the average from 5 to 7 square feet of floor space, but in the most congested areas the available space per person is far less than this ; and the following is quoted, with regard to the housing congestion in the Kolar Gold Field, from the Mysore State Census Report :-
"The standard size of a single room hut is, generally speaking, 9 feet by 9 feet except in Mysore Mine lines where it is 12 feet by 9 feet. In Balaghat, it is 10 feet by 9 feet There is a good deal of overcrowding. The following table gives some idea of its extent It will be seen that there is one instance of three families occupying a single hut and 235 cases of two families living in one hut.
One hundred and twenty-five of these huts are the 9 feet ones and the remainder 12 feet by 9 feet. In 42 cases, families of more than ten persons live in one hut with or without kitchen ; over 850 single-room huts are occupied by six or more persons per huts".
Matters are even worse elsewhere. Thus the Census Superintendent for the United Provinces :—
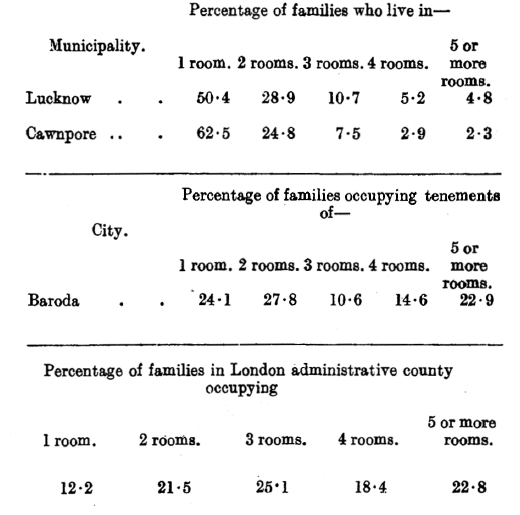
"In Lucknow Municipality no less than 670 families of 8 persons or over are living each family in a single room, and...... a further 1,931 families of this size live each in 2 rooms. The corresponding for Cawnpore are 323 and 552 respectively. In the margin are given for Lucknow and Cawnpore the distribution of families according to the number of rooms they occupy.
The commonest unit of occupation is one room, half the families in City. Lucknow and nearly two-thirds the 5 or families in Cawnpore falling into this group. In Lucknow 90 per cent. of families live in 3 rooms or less, and in Cawnpore this figure reaches 95 per cent ".
Bombay, as we have seen(paragraph 43 above), is far worsestill, but Baroda is decidedly better as the marginal figures show. With these figures we may compare the number of rooms occupied by families in the County of London in 1931 figures of which are given in the marginal table. The average family in this case is composed of 3 . 5 persons, the same size as that of Cawnpore. By way of contrast to conditions in Bombay, Lucknow and Cawnpore the account of Jamshedpur given by the Census Superintendent for Bihar and Orissa is worth quoting :—
"The industrial city of Jamshedpur is quite unlike any other city or town in the province— or indeed in the whole of India To all intents and purposes Jamshedpur is a proprietary town of the Company, owned and administered by them, and its people enjoy the benefits of this highly efficient municipal government without paying any rates whatsoever. The town is administered through a Board of Works, consisting of representatives of the Steel Company and subsidiary companies, with two members of the general public : and the funds required for maintaining the municipal services, such as roads, water-supply, sewage, street lights, hospitals, schools, etc., are contributed by these companies in fixed proportions about Rs. 40,000 by the subsidiary concerns and the rest by Tata's Among the more important developments of the last ten years, brief mention may be made of the following.
The pukka quarters built by the Company for its employees have doubled in number, from 2,756 to 5,483, while the houses and huts constructed by the employees and others have increased from 400 to 8,150. The supply of filtered domestic water is three times as great as it was in 1921, and there are now 60 miles of water-mains and 56 miles of drainage sewers. Provision for medical relief has been extended and improved, and in the main hospital there is at present accommodation for 140 indoor patients as against 42 at the beginning of the decade.
In addition to the formerly existing high school and primary schools, three middle English schools and 22 other schools have been opened Since the previous census was taken, the population of Jamshedpur has grown from 57,360 to 83,738—an increase of no less than 46 per cent This city furnishes a striking contrast to other urban units of the province. There is no congestion in Jamshedpur, and special care is taken to prevent the growth of slums and unhygienic bazars. Although the number of houses has increased by 100 per cent. since 1921, there are still less than 1,000 houses per square mile, whereas in the other three cities the average is over 2,000. And the number of persons occupying each house is exceptionally low in Jamshedpur ".
This however is a solitary case and though there are Improvement Trusts in the larger cities they have much to do before they can do away with congestion. Moreover India differs from Europe in that conditions of overcrowding are probably as bad or worse in villages.
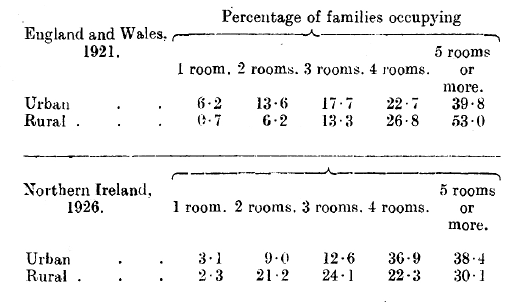
The marginal figures for England and Wales :in 1921 indicate the difference between urban and rural conditions in the matter of overcrowding in Britain. Northern Ireland, a poorer country, shows rather different figures, but in India " if village densities were calculated on the area of the inhabited site or sites, and not on that of the site plus the village lands, they would generally be greater than that of any town This from the United provinces report, but the Census Superintendent for Madras says just the same :-
" It is by no means sure however that the worst specimens of housing in the presidency do not come from certain rural areas, notably the wealthy delta tracts on the circars coast and in Tanjore. Where land is dear, housing tends to be bad and land fetches a notable value in delta districts where irrigation is assured. Every foot of ground is grudged to the village-site and even a comparatively well-to-do landowner will exist in an almost squalor that surprises the stranger. If this is so with an actual owner of land it can be imagined what is the condition of the farm labourer who in many cases also belongs to the so-called depressed classes. In Tanjore, these last form the backbone of the agricultural labouring population and are even yet little removed from a state of agrestic serfdom. One of the most commendable and valuable activities of the Madras Labour Department during the decade has been the compulsory acquisition of sites on which houses could be built for these people and they be introduced to something approaching decent conditions of livelihood In every country poverty and bad housing go together. This is so in India but a further element enters by the presence of the depressed classes. These people are forced in the villages and often even in towns to live in a hamlet apart. Its site is rarely the most attractive and space is grudged. Little interest is taken in the community and its habitat is rarely visited. A lack of public spirit or ordinary hopefulness is an almost inevitable consequence of such treatment and this added to 'the other elements tending to produce squalor has the result that the ' paracheris ' of this presidency may safely be counted upon to produce its worst examples of housing "
