Demographics: India


This is a collection of articles archived for the excellence of their content. Readers will be able to edit existing articles and post new articles directly |
Contents[hide] |
Age profile of the population
2011: The average age of Indian states
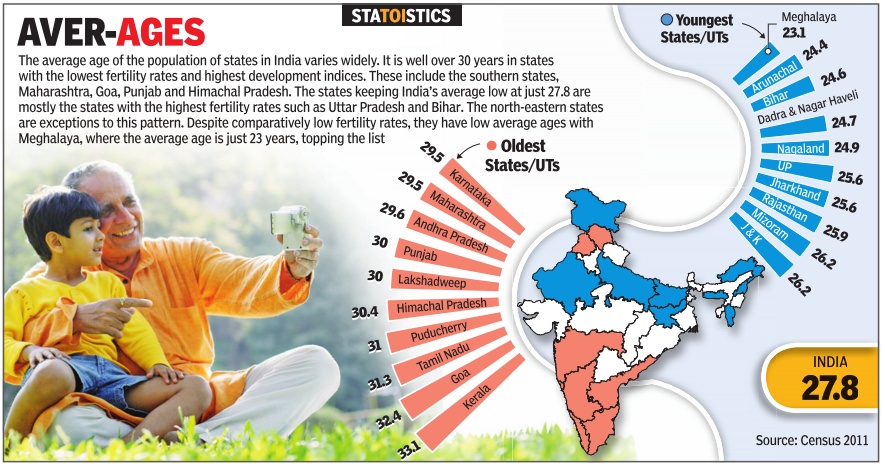
See graphic:
The average age of the population of Indian states in 2011
India’s median age is much above Bangladesh’s 22.2 or Egypt’s 24. In fact, most countries in West Asia and Central America figure in the list of countries with lower median ages than India, and reasonably high life expectancy.
As in 2018

From: Rema Nagarajan, Male or female, urban or rural, over 50% Indians 25 yrs or older, July 3, 2020: The Times of India

From: Rema Nagarajan, Male or female, urban or rural, over 50% Indians 25 yrs or older, July 3, 2020: The Times of India
For the first time, more than half of India’s population, irrespective of gender or whether it’s in urban or rural areas, is now 25 years or older. This was revealed in the Sample Registration System 2018 report released recently by the registrar general and census commissioner of India.
As India’s fertility rate goes down steadily along with a rise in life expectancy, the proportion of its young population is shrinking and the median age has been increasing. The report showed that even among rural men, the proportion of those below 25 years of age had fallen to 49.9% from 50.2% in 2017.
In all other categories — urban women, urban men and rural women — those under 25 already constituted less than half the population.
Overall, the under-25s in 2018 constituted 46.9% of the population. However, there are still several states, those that continue to have high fertility rates, where this proportion is much higher.
Thus, Bihar, with the highest fertility rate of 3.2, had the highest proportion of its population below 25 years, 57.2%, followed by UP with the second-highest fertility rate of 2.9, where the under-25 year population was 52.7%.
The longer a state has had low fertility rates and relatively high life expectancy, the smaller the proportion of its population below 25 years.
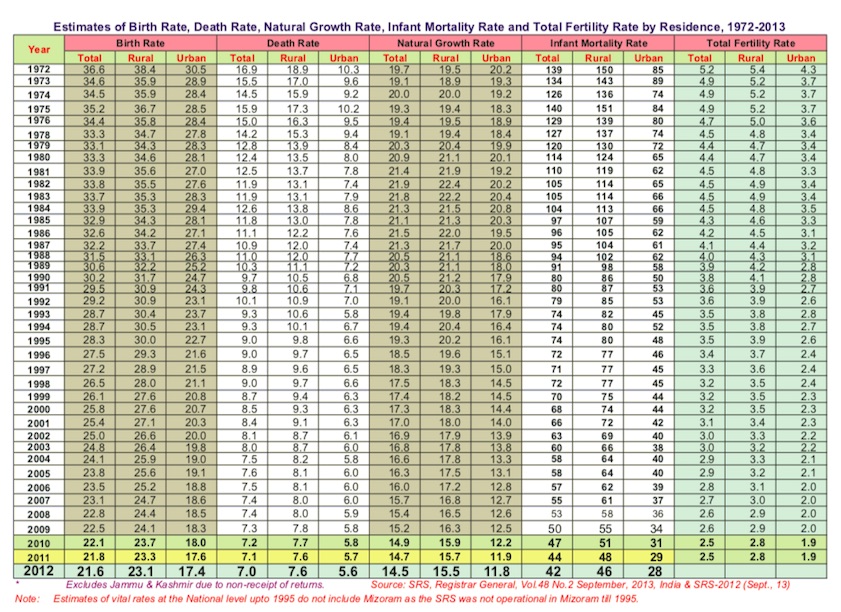
Birth-, Death-, Natural Growth-, Infant Mortality-, Total Fertility Rates
1972-2011
From: The Planning Commission
See graphic:
Birth Rate, Death Rate, Natural Growth Rate, Infant Mortality Rate & Total Fertility Rate by Residence for States/UTs (1972 to 2011)
Children
Number of children: 2011
The Times of India, Mar 02, 2016
Subodh Varma
Now, majority of families have 2 or less kids
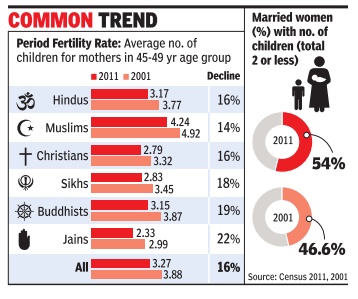
For the first time in the country's recorded history, more than half the families do not have more than two children, according to Census 2011 data released. About 54% married women reported having two or less children, significantly up from the 46.6% two-or-less children mothers counted by the previous Census in 2001, reflecting a pan-India desire for smaller families.
There were about 34 crore married women who had about 92 crore children in 2011: an average of about 2.69 child ren per married woman. In 2001, the corresponding figures were 27 crore married women having 83 crore children at an average of 3.03 children per woman. The dip in the average number of women is the sharpest compared to earlier decades.
Another feature is that women are deferring child birth to later years. Among women in the 20-24 years age group, 35% had no child in 2011 compared with 32% in 2001, and in the age group 2529, 16% had no child compared with 13.4% in 2001.
As a result of these changes, the period fertility rate -the average number of child ren that a woman in the age group 45-49 years has ever borne -has declined by a drastic 16% between 2001 and 2011. The fertility rate of women between 45 and 49 years, that is, when their child bearing days are over, is considered a standard measure by demographers for defining average fertility.
The 14% decline in Muslim fertility rate is significant because in the previous decade (1991 to 2001) the decline was only 5%. So it appears that Muslim families too are quickly catching up with other communities, impelled by similar economic and social considerations.
Working-age population
2013> 2018
July 4, 2020: The Times of India
From: July 4, 2020: The Times of India
From: July 4, 2020: The Times of India
Nearly 2/3rds of Indians are of working age, between 15 and 59
India’s much-discussed “demographic dividend” continues to swell, with the share of working-age population in the country’s total population increasing, data from the recently released Sample Registration System’s 2018 report shows. This is true not just nationally but across all major states.
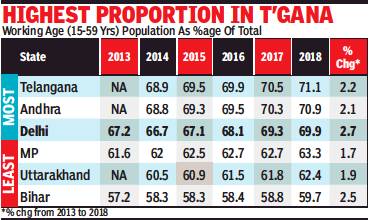
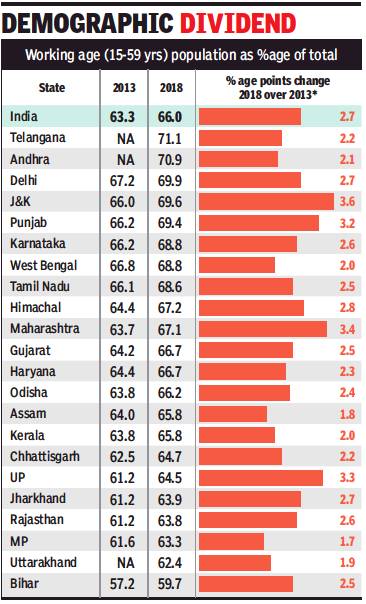
The SRS report, an annual publication from the office of the census commissioner and registrar general, estimates that in 2018, nearly two-thirds of the population, or 66%, was between the ages of 15 and 59. This proportion has inched up each year, an analysis of reports from 2013 onwards shows.
Those of working age constituted over two-thirds of the population in 12 of the 22 major states in 2018 while five years earlier, this was true in only four of the current states. Two states — Andhra Pradesh and Telangana — had over 70% of their populations in the working age bracket and Bihar remained the lone state in which they were less than 60% of the total.
In general, states widely considered less developed had a lower proportion of their population in the working-age groups. This is because most of these states have also had relatively high fertility rates and hence a relatively larger base of the really young. Among the states with high development indicators, Kerala stands out as an exception.
Why Kerala is an exception
Kerala’s working-age population is of a similar proportion as in states like Assam and Odisha. The difference however is that in Kerala’s case, this is due to a relatively larger proportion of the elderly thanks to decades of low fertility and high life expectancy.
Another broad trend that emerges from the data is that states that already have higher proportions of working-age populations have seen that share grow faster than the others. Thus, those that started off with a better “demographic dividend” five years ago now have even more of it.
Experts have pointed out that this dividend, which comes from the number of dependants on each working person being low, will not last for ever with the population steadily aging. It has also been argued that if those of working age are not provided skills and jobs, the dividend could prove to be a curse rather than a blessing.
Youth edge
2007
Youth edge not an Indian monopoly
Even Pak, Nepal Have Lower Average Age
Rema Nagarajan | TIG 12/03/2007
New Delhi: Much has been made of India’s large young population. Nearly 70% of India’s population is less than 35 years of age and reams have been written about how young India is. Yet, India is nowhere near having the lowest median age in the world.
The list of countries with the lowest median age is dominated almost entirely by African nations, although it is for all the wrong reasons. A look at life expectancy in most of the African nations provides a clue to why they are the youngest countries.
Very high prevalence of HIV/AIDS in many African countries, particularly in the south, seems to be taking a heavy toll. Few African countries have an average life expectancy beyond 50 years. In fact, of the 10 countries that form the southernmost part of the African mainland, seven have an average life expectancy of 40 years or less. In the case of Swaziland, it’s as low as 32.6 years.
The others have a life expectancy marginally above 40 years — Namibia tops with 43.4. With a few among the population living beyond their 40s, it’s no wonder that the median age of these countries are the lowest in the world — ranging from 15 years in Uganda to 18.6 in Rwanda.
In fact, 41 of the 50 youngest countries are African. But again, in most cases, this is essentially due to very low life expectancy. Having a young population because most die before they are even middle-aged cannot be an advantage, so it’s better to compare countries which have life expectancy of at least 60 years.
Even by this yardstick, however, India is nowhere near being the youngest nation. Of the 215 nations for which data on both median age and life expectancy is available, there are 47 which have a life expectancy of above 60 and a median age lower than India’s 24.9 years.
Many of these are very small nations like Sao Tome and Principe or Mayotte, but the list includes several not-so-small countries like Oman, Iraq, Pakistan, Tajikistan, Nepal, Bhutan, Cambodia, Syria and Nicaragua — all with median ages ranging from 19 to 21 years.
