Economy: India 2 (Ministry data)
This page has been sourced mainly from the Ministry of readers who wish to update or add further details can do so on a ‘Part II’ of this article. |
The source of this article
INDIA 2012
A REFERENCE ANNUAL
Compiled by
RESEARCH, REFERENCE AND TRAINING DIVISION
PUBLICATIONS DIVISION
MINISTRY OF INFORMATION AND BROADCASTING
GOVERNMENT OF INDIA
Economic Data on India: Ministry of Statistics
THE Ministry of Statistics and Programme Implementation consists of two wings namely:Statistics Wing and Programme Implementation Wing. The Ministry is the apex body in the official statistical system of the country. It is the authority that controls the Indian Statistical Service (ISS) and Subordinate Statistical Service (SSS). It is also the Administrative Ministry for the Indian Statistical Institute, an autonomous registered scientific society of national importance. The Ministry includes, inter-alia, the Central Statistical Office (CSO) and the National Sample Survey Organisation (NSSO).
INDIAN STATISTICAL SYSTEM (ISS)
India has a federal structure of Government and the Indian Statistics System functions within the overall administrative set up of the country. The division of responsibility for administration between the Union Government and the State Governments is on the basis of three-fold classification of all subjects, namely, the Union List, the state List, and the Concurrent List. The Concurrent list represents the subjects where both the Union and State Governments can operate, and it includes the subject Statistics. Three is a further division of responsibility, by subjects of groups of subjects, among the different Ministries/Departments of thee Union Government and among the Departments of State Governments, on the basis of their administrative functions.
The Indian Statistics System, therefore, may be treated as both decentralized and centralized system. For example, the large-scale Statistics operations conducted all over the country like Population Census, Economic Census, Agricultural Census and Livestock Census, as well as nation-wide sample surveys including the Annual Survey of Industries and the Socio-economic surveys is the responsibility or Central agencies.
Similarly, compilation of national accounts, preparation of all-India Prices and Industrial production indices are also Central activities. In the case of States, the State statistics. Similarly, compilation of national accounts, preparation of all- India Prices and Industrial production indices are also Central activities. In the case of States, the State statistics Organizations collect and generate data on a number of variables. The Central Government acts as the coordinating agency for presentation of statistics on an all-India basis even in fields where the State Directorates of Economics and Statistics (DESs) carry out the responsibility of coordination of all statistics activities at the State level and keeping liaison with the MOSPI for the purpose of maintaining uniformity and consistency in the data produced and consolidated different levels.
CENTRAL STATISTICAL OFFICE (CSO)
The Central Statistical Office is responsible for coordination of Statistical activities in the country, and evolving and maintaining statistical. Its activities mainly include National Income accounting; conduct of Economic Census and its follow up surveys, processing of data collected through Annual Survey of Industries and preparation of Reports, compilation of Index of Industrial Production, as well as Consumer price Indices, Gender Statistics, and imparting training on Official Statistics. CSO brings out a number of publications periodically including Statistical Year Book earlier known as Statistical Abstract, Monthly Statistical Abstract, and India in Figures-A Ready Reference, Energy Statistics, Environment Statistics besides disseminating statistical information to various national and international agencies.
The other activities include preparation of Five Year Plan and Annual Plans, holding conferences with the Central and State statistical agencies, revision of National Industrial Classification, preparation and implementation of Strategic Plans to make available data on key parameters, to improve the quality and reliability of existing data sets, to make available new data sets on emerging fields to meet increasing data demands, and to reduce time lag in dissemination of data.
Inadequately staffed/ 2017
There are only our statisticians in the Central Statistics Office (CSO) who handle crucial industrial output data keenly awaited by financial markets and economists every month.
A government panel, which recommended overhauling the key data series, had strongly recommended immediate strengthening of the IIP unit of CSO as well as statistical units in the administrative agencies providing factory data.
The working group submitted its report in 2014 and the government unveiled the changes to the base year to 2011-12 from 2004-05 and revamped the product mix of the index of industrial production (IIP).
“The management and operations of IIP-related activities in the IIP unit of CSO are vested with only four statistical personnel at present.The resource requirements for these activities are often undermined,“ the report said.
It said the unit had to carry out various ancillary activities in relation with mainstream industrial statistics, apart from service sector statistics and statistics of international trade. “The existing manpower of the IIP unit is highly insufficient to cope with the entire range of activities described above,“ the report said.
Government departments have been grappling with shortage of trained statisticians and experts say the situation is worrying. “The economy is larger and more complex now but manpower has not changed in the last 30 years. The strength is the same in 2017 as in the late 80s,“ Pronob Sen, former chief statistician and chairman of the National Statistical Commission told.
“It is difficult to retain good statisticians and the quality of those entering the Indian Statistical Service has declined,“ said Sen. He said good statisticians are lapped up by financial services firms or prefer to go abroad.
He said there was an urgent need to overhaul the way statistics is taught at universities and called for a relook at the incentive structure to attract top notch statisticians for government duties. Economists say key macroeconomic indicators need to be revised at a faster pace to reflect changes in the economy . They point out that the revision to IIP and the wholesale price index unveiled on Friday is already six years late and work has to start immediately to shift to a new base year.
The report suggests the government will have to tackle the resource crunch on a war footing to get reliable and credible statistics.
NATIONALAND PER CAPITA INCOME
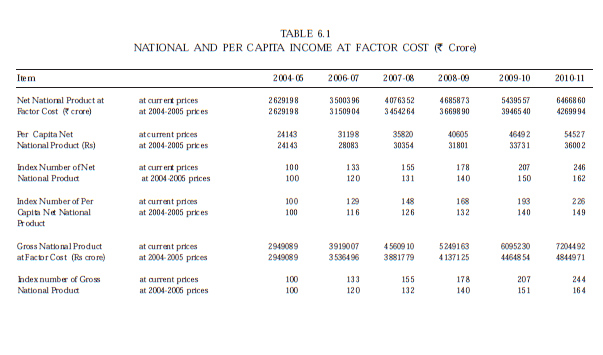
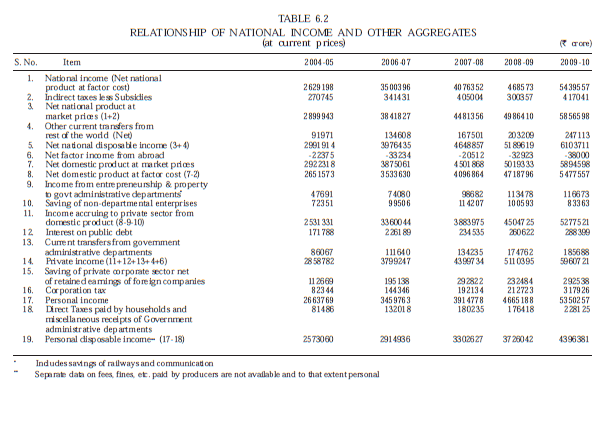
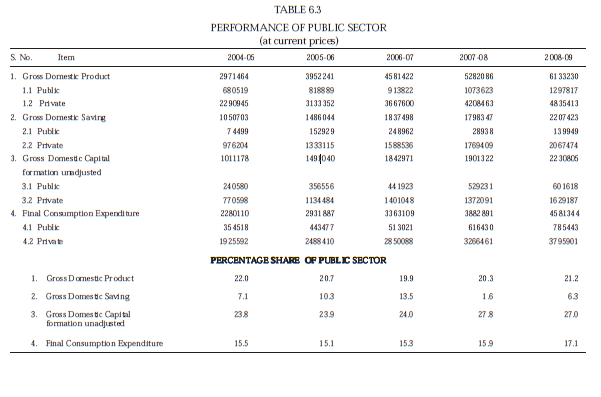
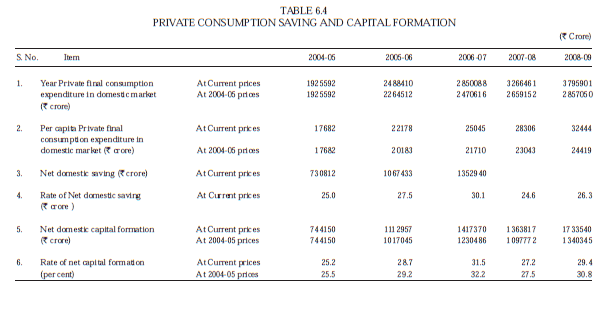
Table 6.1 gives National and Per Capita Income at Factor Cost at current and 2004- 05 prices, while table 6.2 gives the relationship of national income and other aggregates at current prices. Table 6.3 gives the performance of the public sector and table 6.4 gives private final consumption expenditure, net domestic saving and capital formation.
CATEGORIES OF WORKERS
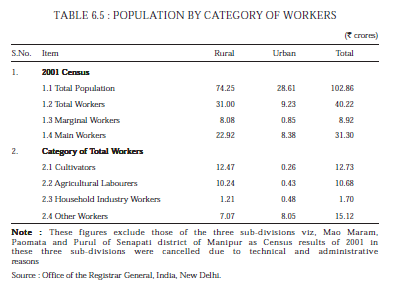
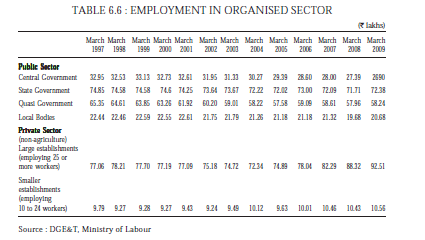
For the 2001 census, the population was divided into main workers, marginal workers, and non-workers. The table 6.5 shows total workers sub-divided into main workers and marginal workers and distribution of total workers in four broad categories in rural and urban areas as on 1 March 2001. Employment in the organised sector has been shown in table 6.6.
UNEMPLOYMENT
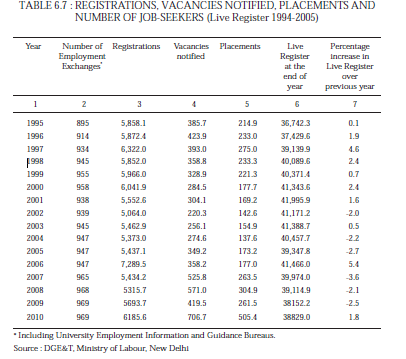
The number of persons on the live register of the employment exchanges gives an idea of the trend of unemployment subject to certain limitations. Table 6.7 gives registrations, vacancies, placements and job seekers on the ‘live register’ for the period 1994-2008.
NATIONAL SAMPLE SURVEY OFFICE (NSSO)
Setup in 1950 and reorganized in 1970, the NSSO functions under the overall direction of a Steering Committee with requisite independence and autonomy in the matter of collection, processing and publication of NSS data. In additional to the non-official Chairman, the steering committee is composed of academicians, data users from Central and State Government departments and senior officers of the Ministry. The NSSO is headed by the Director General and Chief Executive Officer (DG & CEO), who is also the Member-Secretary of the Steering Committee.
The National Sample Survey Organisation (NSSO) carries out socio-economic surveys, undertakes data collection for Annual Survey of Industries, sample checks on area enumeration and crop estimation surveys and prepares the urban frames useful in drawing of urban samples, besides collection of price data from rurla and urban sectors. The major activities of the NSSO pertan to Survey Design, Field Operations, Processing of NSSO data and Publication of NSSO Reports. The SDRD has its headquarters at Kolkata. The FOD has its headquarters at New Delhi with a network of 6 zonal offices located at Bangluru, Guwahati, Jaipur, Kolkata, Lucknow and Nagpur, 49 regional offices and 116 sub-regional offices spread throughout the country. The DPD with its headquarters at Kolkata, functions through the Data Processing Centres at Ahmedabad, Bangaluru, New Delhi, Giridh, Kolkata and Nagpur. The CPD located at New Delhi functions as the Secretariat of DG & CEO, NSSO.
The subjects taken up under socio-economic surveys are—surveys on Consumer Expenditure, Employment-Unemployment, Social Consumption (Health, Education, etc.) Manufacturing Enterprises and Service Sector Enterprises in the Unorganized Sector being covered once in five years, while subjects like Land and Livestock Holding, Debt and Investment are covered once in 10 years. Other than irregular surveys, ad-hoc surveys are also undertaken to cover special topics of current interest to meet the demand of the data users. The data on Consumer Expenditure and Employment - Unemployment were also collected in every round from a thin sample along with the main subject of enquiry up to 64th round of NSS.
The 62nd round of NSS (July 2005 - June 2006) was on Unorganized manufacturing and usual annual survey of Household Consumer Expenditure and Employment- Unemployment. All the Five reports of this round have been brought out and are available to the public. NSS 63rd round (July 2006 -June 2007) survey was on “Services Sector Enterprises (excluding Trade) and Household Consumer Expenditure.
All three reports on this survey have been released. NSS 64th round (July 2007 - June 2008) survey was on Participation and Expenditure in Education, Employment-Unemployment & Migration and Household Consumer Expenditure. The Field work of this survey was completed in June, 2008 and all the four reports based on this survey have been released. NSS 65th round (July 2008-June, 2009) was devoted to Domestic Tourism, Housing Condition, Urban Slums and Civic Amenities and the field work this survey was completed in June, 2009. OUt of total number of 3 reports based on the survey, only one report viz. 'Some Characteristics of Urban Slum in India', has been released till date. The 66th round of NSS is 8th Quinquennial Round on Employment, Unemployment and Consumer Expenditure. Field work of this survey has started from July, 2009 and will continue up to June, 2010. Thereafter, the field work of 67th Round of NSS devoted to Survey of Unincorporated non agricultural Enterprises covering Manufacturing. Trade and Service Sectors will start from 1st July, 2010.
The results of the surveys are brought out in the form of NSS reports which are available for sale. The NSS reports are also available on the website of the Ministry for viewing/downloading free of cost. Summary of the results of these surveys are also published in Sarvekshana - A Bi-annual Technical Journal of the NSSO. Validated unit level data relating to the NSS surveys are available on CDROM for sale at normal price.
The NSSO undertakes the field work of the Annual Survey of Industries (ASI) under statutory provisions of the Collections of Statistics Act, 1953 (Central Rule, 1959) in the whole country except for the State of Jammu & Kashmir where the ASI is conducted under Jammu & Kashmir Collection of Statistics Act, 1961. The survey covers all factories registered under Section 2 m (i) and 2 m (ii) of the Factories Act, 1948 (2 m (i): those factories employing 10 or more workers and using power and 2 m (ii): those factories employing 20 or more workers and not using power) and Establishment registered under the Bidi and Cigar Workers (Conditions of Employment) Act, 1966. The coverage extends not only to manufacturing sector but also to other categories under services such as cold storage, water supply, gas production, motion picture production, laundry services, repair of motor vehicles and of other consumer durables.
However , defence factories, technical training institutions, jail factories, unit engaged in storage and distribution of oil, restaurants/cafe and computer services are kept out of the survey. From ASI 1998- 99, the electricity units engaged in generation, transmission and distribution registered with the Central Electricity Authority (CEA) are excluded. The departmental units such as railways workshops, road transportation, corporation workshops, government mints, sanitary, water supply, gas storage etc. are not covered as there are alternative sources of their data compilation for the Gross Domestic product (GDP) estimates by the National Accounts Division of Central Statistical Organisation (CSO).
The NSSO also provides technical guidance to States in the field of agricultural statistics for conducting crop estimation surveys and keeps a continuous watch on the quality of crop statistics through the Improvement of Crop Statistics Scheme. The NSSO regularly collects rural price data on monthly basis from shops/ outlets in selected markets located in a sample of 603 villages for compilation of Consumer Price Index (Agricultural Labour/Rural Labour). For urban area, price data is being collected from compilation of new series of Consumer Price Index (Urban) from 310 towns spread over all the States/UTs.
The NSSO conducts an Urban Frame Survey (UFS) for providing a sampling frame of first stage units in the urban sector for its surveys. It is carried out in a cycle of five years (known as Phase of Urban Frame Survey) thereby providing an updated frame twice in a span of 10 years. Currently the field work of 2007-12 Phase of Urban Frame Survey is on in accordance with new guidelines finalised by the committee set up for reviewing the arrangement of preparation and updation of Urban Frame.
PRICES
Wholesale Prices
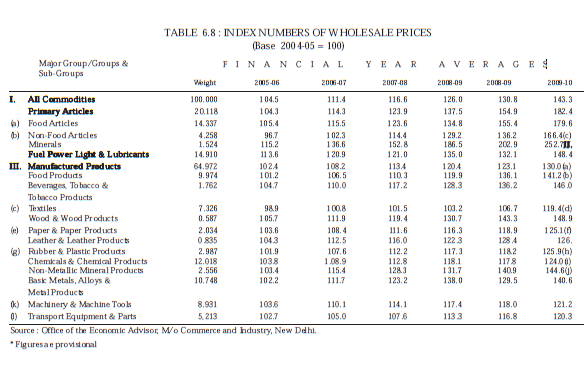
The current series of index numbers of wholesale prices (base 1993-94=100) was introduced from April 2000. The series have 435 commodities with 1918 quotaions. Table 6.8 gives the index numbers of wholesale prices (1993-94=100) for the period 2003-04 to 2009-10 for all commodities and for selected groups/sub-groups of three major groups, namely: (i) primary articles; (ii) fuel, power, light, lubricants; and (iii) manufactured products.
Consumer Prices
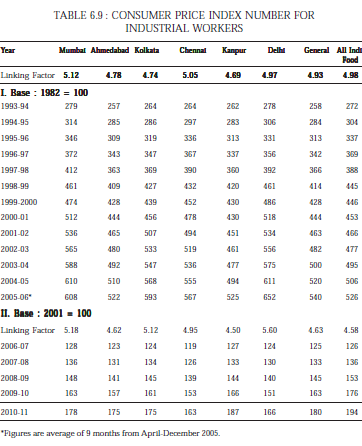
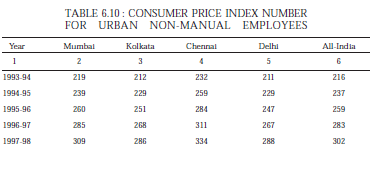
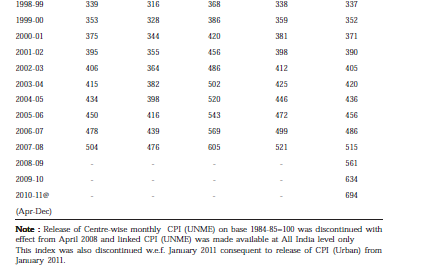
Table 6.9 gives Consumer Price Index Numbers for industrial workers on base 1982=100 for the period 1993-94 to 2005-06 and on base:2001 = 100 for the period 2006-07 to 2009-10. New Series of Consumer Price Index Numbers for Industrial Workers on base 2001 = 100 had been released w.e.f. January 2006 Index. Table 6.10 gives the Consumer Price Index Numbers for urban non-manual employees for the 132 India 2010 period 1993-94 to 2009-10 at the all-India level and some selected centres. Since April, 2008, the Central Statistical Organisation has discontinued the compilation of Centre-wise Consumer Price Index for urban nonmanual employees.
ANNUAL SURVEY OF INDUSTRIES
The Annual Survey of Industries (ASI) is the principal source of industrial statistics in India. It provides statistical information to objectively and realistically assess and evaluate the change in the growth, composition and structure of the organised manufacturing sector. This sector comprises activities related to manufacturing processes, repair services, generation, transmission, etc., of electricity, gas and water supply and cold storage.
The survey is conducted annually under the statutory provisions of the Collection of Statistics Act, 1953. The ASI extends to the entire country except the States of Arunachal Pradesh, Mizoram and Sikkim and the Union Territory of Lakshadweep. It covers all factories registered under Sections 2m(i) and 2m(ii) of the Factories Act, 1948. The survey also covers bidi and cigar manufacturing establishments registered under the Bidi and Cigar Workers (Conditions of Employment) Act, 1966. Certain services and activities like cold storage, water supply, repair of motor vehicles and of other consumer durable like watches, etc., are also covered under the survey.
Defence establishments, oil storage and distribution depots, restaurants, hotels, cafe and computer services and also the technical training institutes are excluded from the purview of survey. Units registered with Central Electricity Authority (CEA) are also not covered under the ASI. The data collected through ASI relate to capital, employment and emoluments, consumption of fuel and lubricants, raw material and other input/output, value added, labour turnover, absenteeism, labour cost, construction of houses by employers for their employees and other characteristics of factories/industrial establishments. The field work is carried out by the Field Operations Division, NSSO. The CSO processes the data and publishes the results.
The ASI 2007-08 indicates a total of 1,55,321 working factories in all States and Union Territories except the States of Arunachal Pradesh, Mizoram and Sikkim and the Union Territory of Lakshadweep. These factories together had a total of fixed capital worth Rs. 10,55,96,614 Lakhs, and invested capital Rs.15,35,17,773 Lakhs. These factories have provided gainful employment to Rs.1,13,27,485 persons and distributed Rs. 1,29,44,123 Lakhs as emoluments to employees.
ENERGY STATISTICS 2011
Energy sector is one of the most important basic infrastructure sectors, for any country. Proper energy planning is essential for achieving energy security. Every country has to formulate its policy to optimize the use of different energy soures for meeting the demands of its households, agricultural industrial and commercial sectors. This necessitates an integrated and updated database of the production and consumption of different energy sources viz., coal, crude, petroleum, natural gas and electricity.
The CSO brings out an annual publication "Energy Statistics" incorporating data on reserves, installed capacity, potential for generation, production, consumption, import, export and wholesale price of different energy commodities as available from the concerned line Ministries of the Government of India. "Energy Statistic 2011", is the 18th issue in the series. The objective of this publication is to meet the information needs of national and international policy markers, administrators and researchers concerned with the energy sector.
Energy Statistics 2011 contains information on the reserves, installed capaity, production, consumption, foreign trade, etc. to give a holistic view of all energy resources, The publication has also brought energy commodity balance which provides sector wise production and consumption for the last two years. To improve the unity of the publication, various indicators viz. growth rates, compound annual growth rates, percentage distributions, have been provided in relevant tables. For the first time analytical highlights on the performance of the sector has also been brought out.
ECONOMIC CENSUS
The CSO undertook a countrywide Economic Census, for the first time in 1977 to provide a better frame for conducting follow-up surveys for collection of detailed information particularloy from unorganized establisments. The basic information, relating to the distribution of non-agricultural establishments by activity, type of ownership, rural/urban break up and by employment size needed for preparation of a frame for conducting detailed surveys is collected in the periodic Economic Census.
The second and third Economic Censuses were conducted in 1980 and 1990 along with house listing operation of 1981 and 1991 Population Censuses respectively. The fourth economic Census was conducted during 1998 in all States/ UTs in collaboration with concerned State/UT Directorates of Economics and Statistics.
The Fifth Economic Census was conducted in the year 2005 in all the States/ UTs again in collaboration with State/UT Directorates of Economics and Statistics. The fifth Census covered all entrepreneurial activities throughout the country (except crop production and planation).
The final results of Economic Census 2005 were released on 29th May, 2008.
According to the results there were 41.8 million establishments in the country
employing 100.9 million persons.
The detailed results of the Fifth Economic Census are available on the Ministry's website viz. www.mospi.gov.in. the Ministry has proposed to conduct 6th Economic Census during 2012 in association with State/UT Directorates of Economics & Statistics.
INFRASTRUCTURE STATISTICS - 2010
Infrastructure Statistics is one of the most important sector for any country. Given the crucial role of infrastructure in promoting inclusive and sustainable socioeconomic development, quality infrastructure statistics is very much essential for informed decision making in many spheres, the important ones being the following:
(i) Planning and policy making
Quality statistics are essential for effective planning, monitoring and evaluation of infrastructure projects and for optimal allocation of scarce resources among the competing projects to achieve the desired plan objectives of inclusive and sustainable economic development.
(ii) Business promotion
Decisions regarding industrial diversification to new areas and new markets and investment in infrastructure are to be based on up-to-date and reliable micro-level and macro-level data. Business houses can get these data either through the conduct of specialized surveys, which re very costly, or from the existing data sources of the Government, research institutions, business associations, etc.
INFRACTRUCTURE AND PROJECT MONITORING
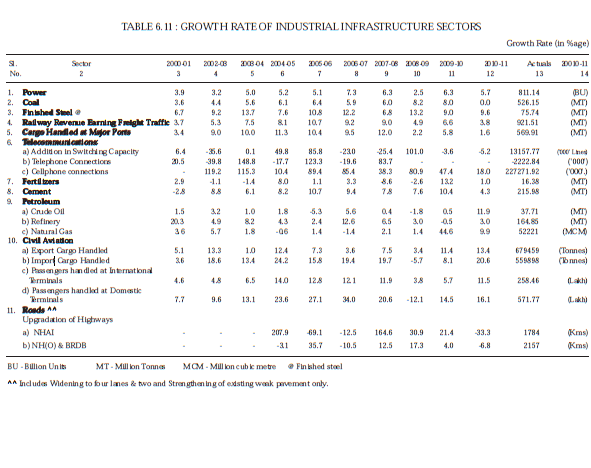
The Infrastructure and Project Monitoring Division (IPMD) in the Ministry of Statistics and Programme Implementation is monitoring the performance of the country’s eleven key infrastructure sectors, namely, Power, Coal, Railways, Shipping and Ports, Telecommunications, Fertilizers, Cement, Petroleum & Roads and Civil Aviation. It prepares and submits monthly Review Reports and Capsule Reports on the performance of infrastructure sectors, inter-alia, to the Prime Minister office, and the Cabinet Secretariat. The growth rate in respect of each infrastructure sector since 2000-01 and the production/achievement during 2008-09 is given in the
MONITORING OF CENTRAL SECTOR PROJECTS
The IMPD monitors the time and cost overruns in respect of the Central Sector Projects costing Rs 150 crore and above, through the mechanism of On-line Computerized Monitoring System (OCMS), which enables on-line furnishing of information by projects (costing Rs. 1000 crore and above are monitored separately every month, the projects above Rs. 150 crore also monitored every quarter. The IPMD also, in coordination with the administrative Ministries concerned, takes up initiatives to bring about systematic improvements in various areas of project implementation. It also taken up/highlights the projects with times and cost overruns in various forums such as quarterly meetings taken by the administrative Ministries concerned, takes up initiatives to bring about systematic improvements in various areas of project implementation. It also takes up/highlights the projects with times and cost overruns in various forums such as quarterly meetings taken by the administrative Ministries. MOU meetings by the Department of Heavy Industries, Supplying of information when solicited by PMO, etc. As on 01.03.2011, there were 565 projects with an anticipated cost of Rs. 210882/25 crore on the monitor of this Ministry, The statement of on-going projects showing extent of time and cost overruns with respect to the latest schedule may be seen in the Table. 6.12 (A) or 6.12 (B).
In addition, the IPMD has been monitoring the progress of irrigation the progress of irrigation projects, which are being financed centrally under the Accelerated Irrigation Benefit Programme (AIBP) and a report is brought out every year.
