Faunal Resource In India: Biodiversity
Faunal Resource
This is an extract from FAUNAL DIVERSITY IN INDIA Edited by J. R. B. Alfred A. K. Das A. K. Sanyal. ENVIS Centre, Zoological Survey of India, Calcutta. 1998 ( J. R. B. Alfred was Director, Zoological Survey of India) |
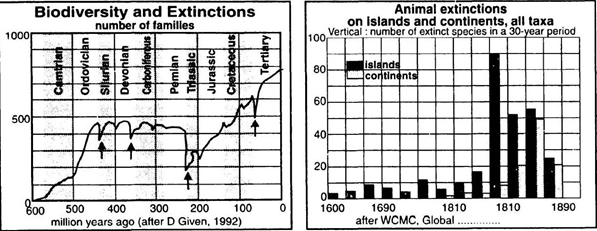
Biodiversity is the variety and variability of life and its many processes. It includes all life forms from bacteria, fungi and protozoa to higher plants, insects, fishes, birds and mammals. Biodiversity also includes countless miIlions of races, subspecies, and local variants of species and the ecological processes and cycles that link organisms into populations, communities, ecosystems, and ultimately the entire biosphere. Genetic variation affects a species physical characteristics, productivity, resilience to stress and long-term evolutionary potential. Genetic diversity means that species contain characteristic levels of genetic variation within and among their populations, including that of extreme populations. The foundation of biodiversity is genetic conservation. A more easily recognized element of biological diversity is the distinct species associations in an area. We refer to these associations as biological communities and usually recognize them as distinct strands, patches or sites such as forests, meadows, fencerows, ponds, wetlands etc. Communities form the biotic parts of ecosystems. The species composition in an ecosystem is intertwined with its structural and functional aspects and hence with the diversity of its ecological processes. At the geographic scale of regional landscape, diversity includes variety in the kinds of biological communities and a biogeography (that is patterns, sizes, shapes, juxtapositions and interconnectedness) that provides for. free, natural interchange of individuals througholltthe area. Biologically diverse communities contain sufficient compositional, structural and functional variety that they are assured a high prospect of continued presence and ecological influence in an area. The history of this planet goes back about 5 billion years. Life evidently first appeared on Earth more than 3 billion years ago, and for the next 15 biIlion years, only the bacteria and blue-green algae, or centrotrophic prokaryotes existed. Human beings arose as a species out of the web of life a mere 200,000 years ago. We are made up of the same basic atoms in the same proportion, the same macromolecules, and the same cellular plan as all other living things because we share common ancestors. The genetic blueprint written in nucleic acids is a universal genetic code. The first fossils, organisms with cells, a nucleus and chromosomes (eukaryotes) are from rocks preserved about 1.4 million years ago. These are thought to have arisen from prokaryotes through symbiotic associations (Marylis, 1970). About 640 million years ago, there was a sudden appearance of a diverse assemblage of multicellular eukaryotic organisms. Since the Cambrian, there has been continuous evolution and extinction of life. Over a half billion species may have existed over the past 600 million years. Calcutations show that for organisms inhabiting shallow marine waters, the longevity of species is usually less than 10 million years (6 million in echinoids, 1.9 million in graptolites, 1.2 to 2 million in ammonites). If the average survival of a species is about 5 million years and eukaryotic life has been arotmd for over 600 million years, then there could have been at least 120 complete changes of species during the time of metazoan existence. Since the Cambrian began, the average species extinctions rate has been 9% per million years. The earliest known mass extinction occurred about 650 million years ago, when a worldwide event eliminated as much as 70% of the'plankton diversity on earth.
One Ollt of four mammals, one out of eight birds, one ampllll•j"l1s ,1I1II1hli out of three and nearly half of all freshwater turtles are threatened, according to the World Conservation Union. At least 15,589 species face extinction, according to 2004 IUCN list, includes 7266 animal species and 8323 species of plants and lichens. The current rate of species becoming extinct is estimated to be up to 1000 times the normal figure, ie., in evolutionary terms induding the normal renewal of ecosystems. Since 1500, a total of 784 known animal and plant species are considered to have become extinct. Another 60 only survive in captivity or through cultivation. This is because the distinctive survival strategy evolved by one species -the Homo sapiens -was the highly developed brain. From that brain emerged self awareness, memory, curiosity, imagination, and creativity. The human brain had an tmprecedented capacity for abstraction, to create ideas that existed only in a mind that became as real to that mind as a rock or tree. It was this capacity for abstraction that enabled us to conceive notions of tribes, loyalty, nations justice, peace, war, equality, god, heaven and hell. And it was also responsible for creating economies, an idea that value in human activity and natural "resources" that we can exploit and which symbolize that value in currency. When biological diversity is depleted, all the money in the world won't substitute it.
Purpose
Documentation of faunal resource of a country therefore focuses on developing 'indicators' to be used in the assessment which are reflected in a combination of ecological ftmdamentals, such as biodiversity, critical habitat and key ecological relationships; site¬specific considerations, environmental stress and potential impacts. Assessments and documentations also provide biodiversity values that are recognized and taken into consideration in the planning and decision making process. It is for this reason the documentation of faunal resources will enhance the effective performance of planning and management and also assists in competencies or compensable factors found in evaluating the diversity of the country, has been taken up in the present instance.
Indian Scenario
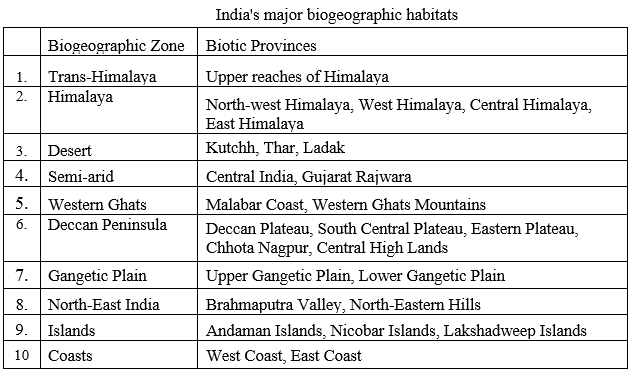
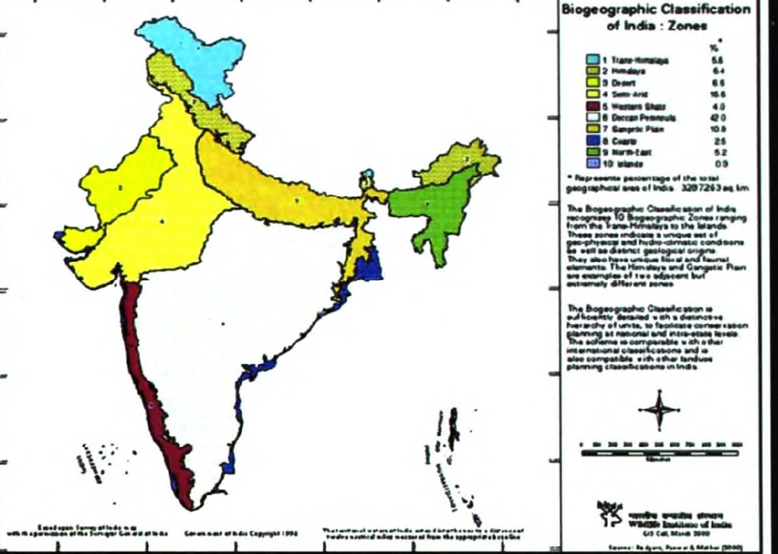
India's immense biological diversity encompasses ecosystems, populations, species and their genetic make-up. This diversity can be attributed to the vast variety in physiography and climatic situations resulting in a diversity of ecological habitats ranging from tropical, sub-tropical, temperature, alpine to desert. As a result, according to world biogeographic classification, India represents two of the major realms (the Palaearctic and Indo-Malayan) and three biomes (Tropical Humid Forests, Tropical Dry/Deciduous Forests and Warm Deserts/Semi-Deserts). These include 12 biogeographic regions. However, the Wildlife Institute of India has proposed a modified classification-which divides the country into 10 biogeographic regions: Trans-Himalayan, Himalayan, Indian Desert, Semi-Arid, Western Ghats, Deccan Peninsula, Gangetic Plain, North East India, Islands and Coasts.
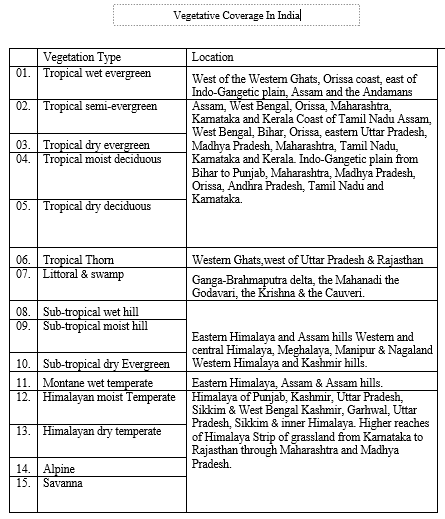
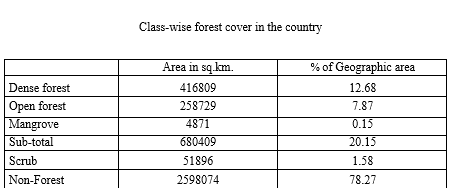
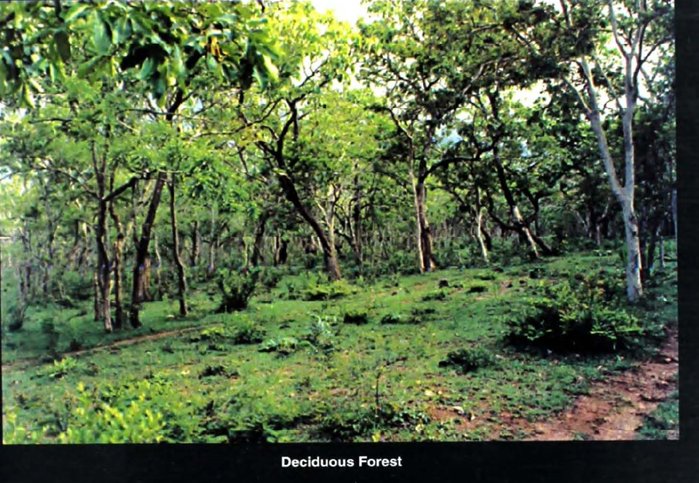
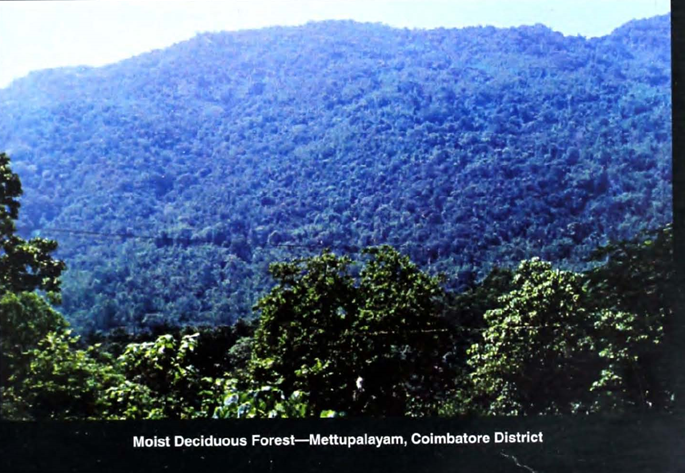
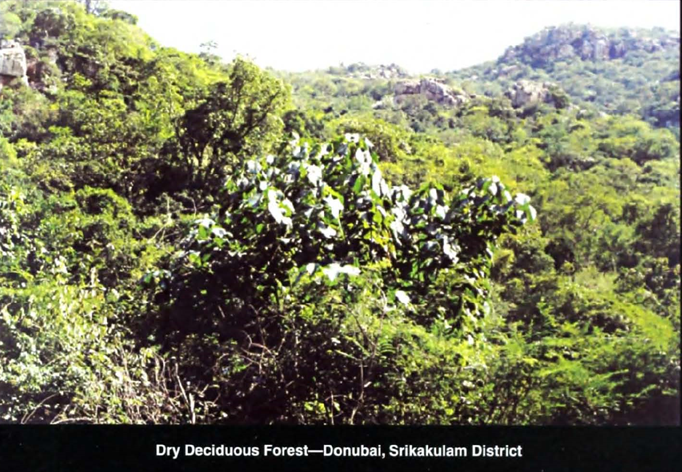
The rich vegetation wealth and diversity in the country is enormous due to the variety of climatic and altitudinal variations coupled with diverse ecological habitats. Champion and Seth (1968) recognized 16 major forest types comprising 221 minor types, of this tropical moist deciduous forms the major percentage (37%), followed by tropical dry deciduous (28.6%), tropical wet evergreen (8%), tropical thorn forest (2.6%) and others of minor values. Recent Forest Cover Assessment by Forest Survey of India (2001) indicates RAMAKRISHNA and ALFRED: Faunal Resource a dense forest cover of 416,809 km2 (12.68%), open forest of 258,729 km2 (7.87%), thus totaling 20.55%; while the non forest cover constit1.lte a major portion (79.45%) with Scrub forest depicting only 1.44% of the total area. Among the states, Madhya Pradesh has the maximum area of 77,265 km2 followed by Anmachal Pradesh (68,045 km2), Chattisgarh (56,448 km2). In terms of percentage of forest cover, Lakshadweep has the maximum (85.91%) (because of the inclusion of Coconut plantations) followed by Andaman & Nicobar Islands (84.01 %), Mizoram (82.98%), Anmachal Pradesh (81.25%) and Nagaland (80.49%).
Resource Areas
Forests are an important reservoir of biodiversity. Ancient and frontier forests, because of their long standing and relatively lower levels of human disturbance, are typically richer in biodiversity than other natural or semi-natural forests. An illustration of the conservation importance of forests relative to biodiversity is found in the recent analysis of biodiversity hotspots (Myers et al., 2000). Loss of forest will inevitably result in reduction of biodiversity as a direct result of loss of habitat. There are many anthropocentric reasons to preserve biodiversity (direct use value, option value, etc.) but the principal such reason considered here is the indirect use value in the form of ecosystem services. A loss in biodiversity affects the stability of an ecosystem resulting in a reduction of its resistance to disruption of the food web (by loss of the weak interaction effect), resistance to species invasion and resilience to global environmental change (McCann, 2000; Chapin et al., 2000). Therefore, the argument for conserving biodiversity is two-fold:
(1) Biodiversity is essential for maintaining ecosystem services and
(2) Biodiversity increases the stability and resilience of an ecosystem to a disturbance.
Protected Area Network: Protected areas are recognized as the most important core 'units' for its resource and in-situ conservation. It is also a geographically defined area which is designated or regulated and managed to achieve specific resource conservation objectives. Protected area coverage was endorsed by the seventh Conference of the Parties (COP7) of the Convention on Biological Diversity (CBD) as an indicator for immediate testing in relation to the adopted target of significantly reducing the rate of biodiversity loss by 2010. However, the concept of protection is not new to this country. The concept of Sacred Groves, operation of closed period for fishing hunting and the establishment of wildlife reserves were known during the Mauryan kings in India in the second and third centuries (Grove, 1995). It is therefore, "Protected areas are a cultural response to tile perceived threats to nature" (McNeely, 1998). But, the establishment of Yellowstone National Park in US inl872 is often cited as the starting point of the modem era of protected areas.
Definitions of the IUCN protected area management categories (IUCN 1994) Category Ia Strict nature reserve: protected area managed mainly for science Area of land and/or sea possessing some outstanding or representative ecosystems, geological or physiological features and/or species, available primarily for scientific research and/or environmental monitoring. Category Ib Wilderness area: protected area managed mainly for wilderness protection Large area of unmodified or slightly modified land, and/or sea, retaining its natural character and influence, without permanent or significant habitation, which is protected and managed so as to preserve its natural condition. Category II National park: protected area managed mainly for ecosystem protection and recreation Natural area of land and/or sea, designated to (i) protect the ecological integrity of one or more ecosystems for present and future generations, (ii) exclude exploitation or occupation inimical to the purposes of designation of the area and (iii) provide a foundation for spiritual, scientific, educational, recreational and visitor opportunities, all of which must be environmentally and culturally compatible. Category III Natural monument: protected area managed mainly for conservation of specific natural features Area containing one or more, specific natural or natural/cultural feature which is of outstanding or unique value because of its inherent rarity, representative or aesthetic qualities or cultural significance. Category IV Habitat/species management area : protected area managed mainly for conservation through management intervention Area of land and/or sea subject to active intervention for management purposes so as to ensure the maintenance of habitats and/ or to meet the requirements of specific species. Category V Protected landscape/seascape: protected area managed mainly for landscape/seascape conservation and recreation Area of land, with coast and sea as appropriate, where the interaction of people and nature over time has produced an area of distinct character with significant aesthetic, Faunal RfSOUrcL'S in India ecological and/or cultural value, and often with high biological diversity. Safeguarding the integrity of this traditional interaction is vital to the protection, maintenance and evolution of such an area. Category VI Managed resollrce protected area: protected area managed mainly for the slIstainable lise of natllral ecosystems ' Area containing predominantly unmodified natural systems, managed to ensure long¬term protection and maintenance of biological diversity, while prOViding at the same time a sustain"bl.. now of natural products and services to meet community needs
Status Of Protected Area Network
Ministry of Environment & Forests, through various programmes assist and contribute to the development of a sound programme for the conservation and sustainable and equitable utilisation of biodiversity in the Protected Area Management Systems that will assure enduring ecological, economic and social benefits. The declarations of these are based on the following facts. The State Government may, by notification, declare its intention to constitute any area other than an area comprising within any reserve forest or the territorial waters as a sanctuary if it considers that such an area is of adequate ecological, faunal, floral, geomorphologic, natural or zoological significance, for the purpose of protecting, propagating or developing wildlife or its environment. The declaration of a National Park by the state government also falls with the same principle of protection, propagation and developing wildlife in an area, whether within a sanctuary or not. The three-pronged approaches of the protected area are : 1. Securing the integrity of nearly a total of 87 National Parks with an area of 37,648.57 km or 1.15% of the country's geographic area and 485 Wildlife Sanctuaries with an area of 115,351.77 km or 3.51% have been established. This gives a total of 572 Protected Areas, with an area of 153,000.34 km or 4.66% of the country's geographic area, within the forest ecosystem to preserve, mainly through the preparation of management plans and also through provision of support for surveillance and monitoring activities (Table). The conservation strategies adopted by the government are the initiation Project Tiger a programme that was launched in 1973 in order to ensure the maintenance of available population of tigers in India and to increase the species numbers. At present, there are about 3,800 tigers found in India in 27 Tiger Reserves. Project Crocodile is the second breeding programme initially started in Orissa was then extended to several other States in 1975. The major objective of the project is to protect the three endangered species of crocodiles, Gnvinlis gnngeticlts, Crocodyllts pnlltstris nnd Crocodyllts poroslls. The third programme, Project Rhino was launched in 1987 in Kaziranga Wildlife Sanctuary in Assam to save the Lesser One-horned Rhinoceros from extinction. Lastly in 1991c92 the Project Elephant was initiated to ensure long-term survival of identified population of elephants in their natural habitats.
1 Institutionalise the basic biological inventory work that has been progressing satisfactorily for several years, giving emphasis to the efficient data collection, storage and analysis and innovative information management. In this regard the ENVIS programme was initiated at various levels to disseminate information on the biological resources of the country. 2 Bioprospecting -an activity concerned with the search for new forest or marine products and other natural faunal and floral resources or their products with market potential. Culture of species of biomedical importance like horseshoe crabs, beetles etc. A biosphere reserve is a specific type of conservation area, which accommodates and benefits both the natural environment and the communities living in and around it. This is possible because, a biosphere reserve consists of three different but associated zones viz., Core, Buffer and Transition. Core zone, a most ecologically sensitive and pristine area where nature conservation is a priority with allowed lOW-impact activities. Buffer zone, a less ecologically sensitive but mostly natural area where recreation and sustainable utilisation of natural products can be accommodated and finally, the Transition zone, a less ecologically sensitive area where a great variety of land uses occur. All zones are RAMAKRISHNA and ALFRED: Faunal Resource interdependent and are managed and protected according to the definitions above. By linking conservation, development and the sustainable use of natural resources, a harmony and balance between nature and people can be achieved. Following are the list of biosphere reserves in India, wherein conservation and management action plans are initiated. Several new ones are being in the process of addition to the existing ones.
Methods Of Faunal Assessment
Using the diversity index, Erwin ( 1982 ) estimated 30,000,000 arthropod species live in the tropical forests of the world, on the basis of canopy sampling of arthropods in Costa Rica, based on his calculation: n = ~(a_x_b;..x_c..!.) (dxc) Where a• is the number of beetle species living on a given species of tree, b is the probability that a beetle species live exclusively on that tree, c is the number of different tree species growing in the tropics, d is the probability for a forest arthropod species to the animal communities of the canopy. Stork (1988) based on the assumption of Erwin (1982), found more than 2800 species from 24,000 arthropod collected from the 10 Bornean trees. In the same way, May (1992) estimates some SOO,OOO species on the sea floor only. Wilson (1988) estimates a total number of globally described species of plants and animals at 1,392,485. Minelli (1993) estimated 18,00,000 as the total number of living species, almost corresponding to the earlier estimate of 18,20,000 species by Stork (1981). To this, an estimated nearly 300,000 (Stern, 1981) or 2,50,000 (Raupp, 1988) fossil species are to be added. Global species diversity is estimated by Steyskal (1976), White (1975) and others. Nearly 1.5-1.7 million species of plants, animals and microbes have been named and described so far (Wilson, 1985; Groombridge, 1992). Assuming the global biodiversity to be 30 million species, the present knowledge of 1.75 million species amounts to a mere 5.67% of the total, IUCN (2004). Currently documented rates of species introductions to different regions of the world are greater than documented rates of extinction. Thus, while the total number of species on the planet is decreasing due to extinctions, the total number of species on each individual continent is actually increasing and the distribution of species on earth is becoming more homogenous, i.e. suites of species are becoming more similar across the planet. (Duraiappah et al., 2005). Consequence of this, the documentation of the biological resource of the country is becoming more important in recent years.
The value of the diversity of genes, species, or ecosystems per se, is too often confused with the value of a particular component of that diversity. Species diversity in of itself, for example, is valuable because the presence of a variety of species helps to increase the capability of an ecosystem to be resilient in the face of a changing environment. At the same time, an individual component of that diversity, such as a particular food plant or animal species, may be valuable as a biological resource. The consequences of changes in biodiversity for people can stem both from a change in the diversity per se and a change in a particular component of biodiversity or often resulting in the loss of biodiversity. Given the complexity of what constitutes biodiversity, it is clear that actual changes to biodiversity cannot be measured in full in any natural environment, and given logistical considerations. What is more important is that good metrics are used to measure biodiversity "loss" UNEP (DEC)/MED WG.268/lnf.l4 2 May 2005. The Convention on Biodiversity defines biodiversity loss to be "the long-term or permanent qualitative or quantitative reduction in components of biodiversity and their potential to provide goods and services, to be measured at global, regional and national levels" (CBD COP VII/30). Under this definition, biodiversity can be lost either if the diversity per se is reduced (such as through the extinction of some species) or if the potential of the components of diversity to provide a particular service is diminished (such as through unsustainable harvest).
The assessment of biological diversity depends on the distribution and diversity of species in different areas, habitats or ecosystems. Conservation efforts can be usefully assigned only on the basis of species richness, species abundance, geographic distribution and comparison in different areas, species/area relationships. Further the criteria for assigning the priorities for conservation of biological diversity depends on the richness in a given area, the number of occurrences of a genotype, species or ecosystem (Rarity), degree of separation of population, species or ecosystem from its comparable analog (Distinctiveness), degree of occurrence (Representation), imminent danger or harm (Threat) and the presence or absence of key stone resources (Function). An understanding of the biological diversity and ecosystem function rests on the identification of the biota in their habitats. The biodiversity assessment on the estimates of number of vertebrate and invertebrate species is the major task owing to the complexity related to their abundance, diversity and interactions in the varied habitats/ecosystems. Often only reasonable predictions on broad estimates of number of living species can be made depending on Ihe available data pertaining to reference collection and literature and also on evaluations made on their ecological preferences. The process is also complex and challenging, invariably testing the competence and knowledge of taxonomists involved.
In order to handle the extinction crisis, the conservation scientists have to agree on an explicit mission and strategy aiming complete inventorying of the world's biota as quickly as possible at several levels or scales in time and space, from hot spot identification to global survey audited and readjusted at ten years intervals as suggested by Wilson (1992). The levels or scales of assay envisaged in recent years are the Rnpid Assessment Programme (RAP) created by Conservation International, aiming mostly at the local hotspots; secondly by BIOTROP approach envisaging systematic exploration of broad areas including major and multiple hotspots. BIOTROP method also includes areas such as Wildlife Sanctuaries, National Parks, Biosphere Reserves and Ecologically Sensitive Areas. The third area of systematic inventorisation of the bioresources is the estimalion of population and species concentration (species packing), either at individual, community or at ecosystem level employing Geographic Information System (GIS) technology. This includes collection of data on topography, vegetation, soil, hydrology and species distribution and is registered electronically on a common coordinate system. When applied to biodiversity and endangered species, the cartography is called gap analysis. Yet another way of analysis is the Statistical Analysis System (SAS), with a set of computer aided programmes, recording taxonomic identifications and localities of individual specimens, integrating the data in catalogues and maps with an unbiased measure of similarity (phenetics) or deducing the family tree of species (cladistics). Biological diversity is identified as the number of taxa within an area, as the number of different life-history stages, the different species interactions within an area, or simply the number of individuals of a selected species or group of species and the geographic distribution of those individuals. The different ecological roles that species may play at different stages in their Iifecycles can be considered or the level of endemism and/or biodisparity (range of morphologies and reproductive styles in a community, determined by heterogeneity and unpredictability of habitats) (RAMSAR, 1999, Derous, 2004). The simplest method for target areas for conservation action is to identify countries with the highest number of species (greatest species richness, for e.g., the concept of Mega diversity countries based on the species of vertebrates, swalIowtails, butterflies and higher plants). Various methodologies are adopted to estimate the faunal resources of the area, among them the folIowing are important.
Species I Area relationships: The global distribution of biological diversity is that the tropics at lower latitudes harbour relatively more species per unit area than the temperate zones at higher latitudes and even within tropics the biological diversity does not exhibit any distinctly recognizable patterns. The number of species in an area increases with the size of the area and this increase folIows a predictable pattern known as Arrhenius Relationship, Log S =C + Z Log A, Where S =No. of species, A =Area and C & Z are constants. According to this Species/Area relationship more species occur in tropical cOffiffilmities than in the temperate and arctic communities, e.g., a small region at 600 latitude may have 10 species of ants, at 400 there may be 50-100 species and within 200 of the equator 100-200 species. Within the latitudinal limits (belts) the number of species varies widely among the habitats according to the productivity of the area and degree of structural heterogeneity. Therefore, tropics show higher diversity and rate of speciation, as they are older and more stable (Non equilibrium hypothesis), and less stringent competition due to greater productivity, more resources, increased spatial heterogeneity and increased control over competing populations exercised by predators (Equilibrium hypothesis). The differences between habitats are referred as beta (/3) diversity while diversity within a site or habitat is known as alpha (0.). Differences in the site diversity over large areas, such as continents, are sometimes to as gamma (y) diversity.
The simplest measure of species diversity is the number of species or the species richness, which is calculated after Margalef (1968) as modified by Brower and Zar (1977): Da .. (s-unog N, Where, Da =Margalef's index; s =no. of species and N .. total number of individuals. UsualIy, Shannon -Weiner Diversity Index and Simpson diversity indices are used to describe the species diversity. This measure of species diversity, based on the information theory or related to the concept of "uncertainty" was calculated after Shanon and Weiner (1949) : H' =uPj10g Pi =1. Where, H' =measure of Sharmon-Weiner diversity, s = number of species and Pi = proportion of the total number of individuals occuring in species i. However, in the present context, H' was calculated, using its algebraic manipulation as the equivalent equation after Brower and Zar (1977) ,: H' = (N log N ¬1:0; log nj )/N; Where, nj =total number of individuals occurring in species, i =abundance of species. The maximum possible diversity H' or Hwas calculated using the follOWing max formula: Hmax =log s where 5 is the number of species or category. The most common indicator of trends in species abundance is species richness within a prescribed area. But monitoring the number of species in an area can be misleading, because it is generally the assemblage of organisms in an area that is important, rather than simply the number of species present (Derous, 2004). The species richness is valued as the common currency of the diversity of life, the "face" of biodiversity-the problem with this emphasis on using species for quantifying biodiversity is that such a foclls on species may provide patterns that mask many important patterns and trends for other properties of biodiversity beyond taxonomy (Norse, 1994). For example, when the sizes of the areas chosen are substantially smaller than biogeographic regions, this will result in a high degree of species replication and will fail to protect those species most at risk (rare species), which mostly have unique habitat preferences (Derous, 2004). It is for this reason, a combined index of species richness, rarity and vulnerability was proposed by Rey Benayas and de la Montana (2003) as a measure of the diversity of an area with species. Applying this index had a much better performance to reveal the areas of high diversity than when the constituting criteria were used. It should be noted that this index was developed for terrestrial ecosystems and that it has not been tested on its applicability in the marine environment (Derous, 2004). In marine ecosystems, intensification of fishing beyond sustainable levels has lead to ecological extinction of some species in some regions, and major imbalances in the entire marine food web (Watson et al., 2003) and it is for this reason Marine Trophic Index is adopted to measures the change in mean trophic level of fisheries landings.
In order to study the relation between the molluscan species, coefficient of correlation was calculated. Among gastropod a significant correlation between Nassarius sp. and Thira tuberculata (r =0.0.563; P<0.05) Cerithidiacingulata and Thira tuberculata (r =$).798; P<O.Ol) conforms their coincidence of abundant pattern. Similarly, among bivalves, a significant correlation between Modiolus undulatus and Macoma birmanica (r = 0.430; P< 0.05); Macoma birmanica and Clementia sp. (r = 0.615, P<O.ool) was recorded while a negative correlation between Modiolus undulatus and Clementia sp. (r = -0.622, P<O.Ol) suggest an inverse relation due to the nature of substratum and feeding of other organism in island. Further, the ANOVA test conforms that there is significant variation within the molluscan species and no significant variation within stations.
Faunal Resource
India is very rich in terms of biological diversity due to its unique biogeographical location, diversified climatic conditions and enormous ecodiversity and geodiversity. In fact, within only about 2% of world's total land surface, India is known to have over 7.43% of the species of animals that the world holds and this percentage accounts nearly for 206 species so far known, of which insects alone include 61,151 species. Indeed, those groups that are known to occur in India have not received adequate attention, while some other invertebrates (like Nemertinea, Nematomorpha, Priapulida, Pogonophora and Pentastomida) are not known at all in India. Further studies will not only reveal many more species hut also certainly enhance the information on endemic species.
Conservation
India has a rich tradition of respect for conservation of diversity of life. These traditions are responsible for the presence; through the length and breadth of the country; of hundreds of thousands of trees such as banyan and peepal, now recognized by ecologists as a significant keystone resource. They have permitted the persistence of macaque and langur monkeys and peafowl in the midst of villages and towns. Such traditions have a)so protected entire biological communities in sacred groves and sacred ponds. For instance, a few years ago, scientists of the Botanical Survey of India discovered a new species of a leguminous climber, Krlnsterlia keralensis in a sacred grove in the densely inhabited plains of Kerala. What is further encouraging is that these practices are today being adopted to the modem secu!ar context. Thus many shifting cultivator communities from the northeastern states of Manipur and Mizoram have revived protection to sacred groves as safety forests. They serve as large belts of firebreaks exclusively to the villages (Gadgil, 1997).
The culture of conservation is well seen among the Ladakhis. Ladakh is mainly a Buddhist region in the north Indian states of Jammu & Kashmir with rugged elevations of 3,500 meters and more, poor soil conditions, less than 10 centimeters of rainfall per annum, temperatures of-40°C and very brief growing periods. And yet the Ladakhis have developed a diversity of crops, animals, agricultural land, social practices that allow them to survive in these harsh conditions. A key feature of their success is that they have selected and planted suitable crops in particular niches. Barley is grown everywhere except in the highest villages while apricots, apples and potatoes are grown in the lower valleys. Peas are harvested by hand with nitrogen-rich nodules left in the soil. Fields are irrigated with glacier run off and enriched with human night soil. In this diversified selling, many barley plants have more grains per stalk than most European varieties and cereal yields average about 10 metric tons per hectare compared to yields of 1 ton per hectare in India and Africa, 2.2 tons per hectare in North America and 1.5 tons in the former Soviet Union. The Ladakhis also raise a variety of animals for dairy products, meat, wool and transport. Stray social cooperation also enables the Ladakhis to use these methods successfully (Natiers-Hedge et al., 1991).
Convention on biological diversity stipulates that the sovereign rights of countries of origin over their genetic/ biological diversity resources, and the acceptance of the need to share benefits flowing from commercial utilization of biological diversity resources with holders of traditional knowledgeandpracticesofconservationandsustainableutilizationofthese resources. In view of this, Conservation of biological diversity is a protective measure to prevent the loss of genetic diversity ofa species, save the species from extinction, and to protect ecosystems from damage so as to promote it's sustained utilisation. The "World Conservation Strategy" aims at resource conservation and sustainable utilization, as these two objectives will maintain the essential ecological process and the life-support systems, preserve genetic diversities besides sustainable utilisation of the genes, species and the ecosystems. These strategies inter alia will have the following usefulness to the community as a whole viz., • The inter-generational equity, • Use and conservation of natural resources, • Economic growth, • Environmental protection,
.. Precautionary principles, • Obligation and assistance for cooperation.
The conservation paradigm of Redford et al. (2003), "that we know more about what to conserve than how to conserve" is tnte in case of temperate countries, but the situation is different in tropical countries where three fourths of biodiversity resides in small areas of the world. Conservation Programme is a useful tool to identify and to conserve the components of biodiversity in defined habitats and geographical areas for sustainable use. Besides the above, promoting in situ and ex situ conservation through an integrated scientific research by studying and formulating the intrinsic and extrinsic factors causing the depletion of species/populations will identify Biodiversity Conservation Regions and 'hotspot' areas (that require urgent measures) in the country for concentrated research and protection.
Biodiversity Information System forms an integral part of the data acquisition and retrieval system of National Biodiversity Authority, State Biodiversity Boards and Biodiversity Management Committees. It compiles information on a variety of issues, namely, status of country's ecological habitats, and the natural as well as anthropogenic processes impacting the habitats, population measures and conservation measures of resource base. These are well achieved by maintaining the database system on important groups of animal species with additional knowledge on traditional and ethnic ideas on wild relatives, land races and breeds of domesticated species to encourage equitable sharing of benefits arising out of utilisation of such knowledge systems. Dissemination of information on the importance of conservation and sustainable utilisation of biodiversity through popular and scientific publications and other educational programmes are the other methods employed to achieve the goal ofconservation. Ministry of Environment & Forests has already initiated methods to achieve these goals through: 1 Emphasis on the basic role of natural ecological processes, bio-diversity and sustainable utilisation at all levels of decision-making. 2 Identify conservation priorities with attainable goals. 3 Implementation of sound conservation methods by promoting establishment of protected area network, biosphere reserves, management plans and conservation initiatives to preserve the natural habitat. 4 Promote a conservation consciousness with the public and community participation in conservation decisions providing facilities for conservation education and community development programmes. 5 Promote and regulate the use of natural resources in trade of endangered species and wild life products by enactment of Wildlife (Protection) Act, 1972, with suitable amendments from time to time, signing International treaties such as Wetland conservation, IUCN, CITES, CaD etc. 6 Establish an efficient scientific information and decision stlpport system that includes needs-driven research and conservation planning by Botanical and Zoological Survey organizations, Wildlife Institute and several autonomous institutes under the Ministry of Environment and Forests dealing with environmental priorities and discriminating information 7. Community based Programmes has been incorporated into the conservation strategy by giving importance to the sacred groves. Sacred groves are defined as the species rich habitats that were consecrated to a deity or spirit, where extraction of any liVing material is forbidden. These sacred groves serve as prey refugia, where prey populations could maintain a minimal population. Such sacred groves investigated recently in Andhra Pradesh, Kerala, Karnataka, Madhya Pradesh, Bihar, and some Northeastern states are identified as the species rich area of the primary forests as in Western Ghats (Gadgil, 1993), or area with rare species (Kunstleria keralensis) Mohanan and Nair, 1981), endemic frog (Phi/aetlls sanctisilvaticus) as in Amarkantak, M.P. (Das and Chanda, 1997), sacred ponds having a refllge of the black turtle (Chelonys nigricans) in Chillagong, Bangladesh (Reza Khan, 1980). The conservation idiom of the tribals is also seen in their hunting practices. The Jenu Kurubas in Southern India never extract honey completely from the honeycomb in order to ensure that the bees do not suffer and the production does not come to an abrupt end. Similarly, the tubers and other roots on which tribes sustain are never uprooted fully and are used ensuring that the mother plants survive and reproduce.
8. Forest based programmes by conservation of forests through the Forest Act; guarantee economically, ecologically, socially and culturally sustaiT.able utilisation of the forests. It aims at promoting a rational use of forest resources. A key element of the Forest Act, with regards to safeguarding biodiversity, is defining certain habitats of special importance and giving guidelines as to how these habitats may be managed. Joint Forest (Protected Area) Management an Act under Participatory Management under Wildlife Act, Silvicultural practices, Co-operation between forest dwellers and forest authorities are added to the Forest Protection & Conservation. Use of remote sensing for data gathering, allied to the introduction of Geographic Information System (GIS) as a powerful tool to process that data in conjunction with information collected using traditional field techniques. This has been further substantiated by Peter Raven (2004) that locally driven indigenous efforts incorporating participatory approach, conflict resolution, and mutual learning are more likely to garner the relatively broad support and participation of local communities and strengthening of the local institutions for conservation.
9. Human oriented programmes such as development of Safari Park, ranching of some game animals, identification of agriculture and forests pests and propagation of species, effective control of pests (Biological Control), culture of edible frogs, oysters, clams and other food animals.
10. Taxonomy is the science of identification, classification and naming of organisms. Taxonomic work involves study of morphological characteristics and phylogenetic relationship of organisms, which is essential for applied biological sciences including medicine, agriculture, forestry and fisheries. A sound taxonomic knowledge base is
a pre-requisite for environmental assessment; ecological research, effective conservation, management and sustainable use of biological resources. At this crucial juncture, when the need for a taxonomic stock taking of the earth's biodiversity is becoming increasingly important and urgent, taxonomic experts are ageing and declining in number, both nationally and globally. This decline of taxonomic expertise is a critical problem that needs to be addressed urgently. Current requirements of taxonomic work and available expertise and studies indicate a dire need to encourage excellence and motivate experts to do work on hitherto neglected groups of organisms e.g., microbes, lower groups of plants, animals etc. The challenges are quite serious because while on the one hand the existing experts are ageing and retiring, on the other not many young scholars are opting for studies in taxonomy.
Hence, the Ministry of Environment and Forests set up a Technical Group to develop the All India Project and after inter-ministerial consultations, the project was approved. The project enVisaged establishment of centres for research in identified priority gap areas (e.g. virus, bacteria, micro-lepidoptera, molusca, diptera etc.) in the field of taxonomy, education and training (fellowships, scholarships, chairs, career awards etc.) and strengthening of National Taxonomic Institutions such as Botanical Survey of India and Zoological Survey of India as the coordinating IInits. The modalities of implementing the All India Coordinating Project and prioritising activities under the project was decided after detailed consultations with experts. The Ministry launched the All India Coordinated Project on Capacity Building in Taxonomy (AICOPTAX) in the financial year 1999-2000. Nine centres for research and two centres for training and coordinators for these centres were identified in the first phase. Subsequently, one centre was added and during the financial year 2001-2002, two more centres have been added bringing the total to fourteen.
11. Regulations through Laws: Conservation of biological diversity is taken up through the introduction of various legal procedures especially the Wildlife Protection Act, 1972, Environmental Protection Act, 1991 and declaration of Ecologically Sensitive Areas in the country. The Indian Wildlife (Protection) Act, 1972 intended to provide a comprehensive National legal framework for wildlife protection, with conservation of species as the main criteria. The strategy includes total environmental protection and conservation with the assumption that all such areas should be free from human activities. The act prohibits hunting of wildlife, protects their habitats, and restrains trade in wild animals, trophies etc. The scope of this act was slightly ambiguous in the initial stages, as the definition of wildlife included only selected wild animals and birds. However, the scope was broadened in Wildlife Protection Amendment Act 1991 to include flora as well as fauna. The two-pronged approaches of this act are: Specified endangered species are protected regardless of its location and All species are protected in specified areas
The threat category implies a higher expectation of extinction, and over the time¬frames specified more taxa listed in a higher category are expected to go extinct than those in a lower one (without effective conservation action). However, the persistence of some taxa in high-risk categories does not necessarily mean their initial assessment was inaccurate. The IUCN Red List Categories and Criteria are intended to be an easily and widely understood system for classifying species at high risk of global extinction. The IUCN Council adopted the new Red List system in 1994. The latest version is 3.1 of 2001 published in 2003. According to IUCN all taxa listed as Critically Endangered qualify for Vulnerable and Enqangered, and all listed as Endangered qualify for Vulnerable. Together these categories are described as 'threatened' The threatened categories form a part of the overall scheme. It will be possible to place all taxa into one of the categories For listing as Critically Endangered, Endangered or Vulnerable there is a range of quantitative criteria; meeting anyone of these criteria qualifies a taxon for listing at that level of threat. Each taxon should be evaluated against all the criteria. Even though some criteria will be inappropriate for certain taxa (some taxa will never qualify under these however close to extinction they come), there should be criteria appropriate for assessing threat levels for any taxon. The relevant factor is whether anyone criterion is met, not whether all are appropriate or all are met. Because it will never be clear in advance which criteria are appropriate for a particular taxon, each taxon should be evaluated against all the criteria, and all criteria met at the highest threat category must be listed.
India contains 552 species of animals considered threatened by IUCN 2004, or 7.20% of the world's total number of threatened species. These include 85 species of mammals, 79 birds, 25 reptiles and 66 amphibians, 28 species of fishes, 2 species of molluscs and 21 species of other invertebrates. Out of the species identified by IUCN (2004) as Red list categories, 1 species extinct, 35 species are critically endangered, 91species are endangered, 180 species are vulnerable, 7 species are at lower risk/conservation dependant and 143 species are at lower risk-near threatened, while for 1400 species, the data is deficient. India contains globally important populations of some of Asia's rarest animals, such as the Bengal Fox, Asiatic Cheetah (now extinct in Indian limits), Marbled Cat, Asiatic Lion, Indian Elephant, Asiatic Wild Ass, Indian Rhinoceros, Markhor, Gaur, Wild Asiatic Water Buffalo etc. The number of species of various taxa found in India that are listed under the different categories of endangerment are shown: Globally Threatened Animals Occurring in India by Status Category
Threatened Species. India 2002-03
Iucn Red List Categories And Criteria
Prepared by the IUCN Species Survival Commission. As approved by the 51st meeting of the IUCN Council Gland, Switzerland, 9 February 2000, IUCN -The World Conservation Union, 2001.
Extinct (Ex)
A taxon is Extinct when there is no reasonable doubt that the last individual has died. A taxon is presumed Extinct when exhaustive surveys in known and/or expected habitat, at appropriate times (diurnal, seasonal, annual), throughout its historic range have failed to record an individual. Surveys should be over a time frame appropriate to the taxon's life cycle and life form.
Extinct In The Wild (Ew)
A taxon is Extinct in the Wild when it is known only to survive in cultivation, in captivity or as a naturalized population (or populations) well outside the past range. A taxon is presumed Extinct in the Wild when exhaustive surveys in known and/or expected fllunal Rl'Sourcrs in Indill habitat, at appropriate times (diurnal, seasonal, annual), throughout its historic range have failed to record an individual. Surveys should be over a period appropriate to the taxon's life cycle and life form.
Critically Endangered (Cr)
A taxon is Critically Endangered when the best available evidence indicates that it is not Extinct and it is considered to be facing an extremely high risk of extinction in the wild. Survey should be over a time appropriate to the taxon's life cycle and life form.
Endangered (En)
A taxon is Endangered when the best available evidence indicates that it is not Critically Endangered but is considered to be facing a very high risk of extinction in the wild in the near future, as defined by any of the criteria.
Vulnerable (Vu)
A taxon is Vulnerable when the best available evidence indicates that it is not Critically Endangered or Endangered but is considered to be facing a high risk of extinction in the wild in the medium-term hlture, as defined by any of the criteria.
Near Threatened (Nt)
A taxon is Near Threatened when it has been evaluated against the criteria but does not qualify for Critically Endangered, Endangered or Vulnerable now, but is close to qualifying for or is likely to qualify for a threatened category in the near future.
Least Concern (Lc)
A taxon is of Least Concern when it has been evaluated against the criteria and does not qualify for Critically Endangered, Endangered, Vulnerable or Near Threatened categories. Widespread and abundant taxa are included in this category.
Data Deficient (Dd)
A taxon is Data Deficient when there is inadequate information to make a direct, or indirect, assessment of its risk of extinction based on its distribution and/or population status. A taxon in this category may be well studied, and its biology well known, but appropriate data on ablmdance and/or distribution are lacking. Data Deficient is therefore not a category of threat. Listing of taxa in this category indicates that more information is required and acknowledges the possibility that future research will show that threatened classification is appropriate. It is important to make positive use of whatever data are available. In many cases great care should be exercised in assigning a Data Deficient or a threatened status. If the range of a taxon is suspected to be relatively circumscribed, and a considerable period of time has elapsed since the last record of the taxon, threatened status may well be justified.
Not Evaluated (Ne)
A taxon is Not Evaluated when it is has not yet been evaluated against the criteria. Another important criterion for conservation is the endemic status of the fauna. India has many endemic plants and vertebrate and invertebrate species. Among plants, species endemism is estimated at 33% with c. 140 endemic genera but no endemic families (Botanical Survey of India, 1983). Areas rich in endemism are northeast India, the Western Ghats and the northwestern and eastern Himalaya. A small pocket of local endemism also occurs in the Eastern Ghats (MacKinnon and MacKinnon, 1986). The Gangetic plains are. generally poor in endemics, while the Andaman and Nicobar Islands contribute at least 220 species to the endemic flora of India (Botanical Survey of India, 1983). Threatened Plants Unit (TPU) is in the preliminary stages of cataloguing the world's centres of plant diversity; approximately 150 botanical sites worldwide are so far recognised important for conservation action, but others cue constantly being identified (IUCN, 1987). Five locations have so far been issued for India: the Agastyamalai Hills, Silent Valley, New Amarambalam Reserve, Periyar National Park (all in the Western Ghats), and the Eastern and Western Himalaya.
Among various faunal groups, 396 higher endemic vertebrate species have been identified by WCMC from source references. Endemism among mammals and birds is relatively low. Only 44 species of Indian mammals have a range that is confined entirely to within Indian territorial limits. Four endemic species of conservation significance occur in the Western Ghats. They are the Lion-tailed macaque Mllcilcil silenlls, Nilgiri leaf monkey TrachypitheclIs johni (locally better known as Nilgiri langur Pre~bllfis jo/mii), Brown palm civet Paradoxl/rl/S jadoni and Nilgiri tahr Hemitraglls llyloail/s.
Only 55 bird species are endemic to India, with distributions concentrated in areas of high rainfall. The areas have been mapped by Bird Life International (formerly the International Council for Bird Preservation). They are located mainly in eastern India along the mountain chains where the monsoon shadow occurs, southwest India (the Western Ghats), and Andaman and Nicobar Islands (ICBP, 1992). In contrast, endemism in the Indian reptilian and amphibian fauna is high. There are around 187 endemic reptiles, and 138 endemic amphibian species. Eight amphibian genera are not found outside India. They include, among the caecilians, lndotyphlus, Gegeneophis and Uraeotyphlus; and among the anurans, the toad Bufoides, and the microhylid Melanobatrachus, and the frogs Rilnixalus, Nannobatrachus and Nyctibatrnchus. Perhaps most notable among the endemic amphibian genera is the monotypic Melanobatrnchus which has a single species known only from a few specimens collected from the Anaimalai Hills in the 18705. It is possibly most closely related to two relict genera found in the mountains of eastern Tanzania (Groombridge, 1983). Further, the 'Washington' Convention on International Trade in Endangered Species of Wild Fauna and Flora, more commonly known as CITES, aims to protect certain plants and animals by regulating and monitoring their international trade to prevent it reaching unsustainable levels. The Convention entered into force in 1975. There are more than 150 Parties to the Convention. The CITES Secretariat is administered by the United Nations Environment Programme (UNEP) (Refer: checklist of CITES species and annotated cites appendices and reservations, Published by :CITES Secretariat/UNEP World Conservation Monitoring Centre). Threatened Endemic Indian Species by groups and categories
SUSTAINABLE DEVELOPMENT
The "World Conservation Strategy" of 1980, emphasized three objectives of resources conservation, viz., i. Maintenance of the essential ecological process and the life-support systems, ii. Preservation of the genetic diversities, iii. Sustainable utilisation of the genes, species and the ecosystems. However, the strategy did not prescribe any social, political or organisational framework to realise these objectives. Norwegian Prime Minister. G.H. BurtIand (Dec.1983), chairing the World Commission on Environment & Development of UN General Assembly made it clear that the existing pattern of development are not sustainable and the commission defined "Sustainable Development" as the development, which meets the needs and the aspirations of the present without compromising the ability of the future generations to meet their needs. From then onwards, the concept of sustainable development has acquired a new dimension in terms of economic growth and environmental protection. It is this convention that gave the inter-generational equity, use and conservation of natural resources, environmental protection, precautionary principles, obligation and assistance to cooperate, eradication of poverty and financial assistance in the developing countries. In 1987 the definition of the phrase "Sustainable Development" was modified, and redefined as that which lasts, durable and dynamic enough to meet the emerging needs of the people. It means taking the development processes in such a manner as to "preserve" or "conserve" the life-supporting systems and the resources-capital base of the Earth like air, water, soil, forests, fauna, flora, minerals, non-renewable resources, etc. It also means meeting the needs of the present generations without impairing the needs of the future generations. It is now defined as the "Social and structural economic transformation which optimises the social and economic benefits available in the present without jeopardising the likely potential for similar benefits in the future" Ecologically the sustainable development is "using, conserving and enhancing the community resources so that the ecological processes, on which the life depends, are maintained and the total quality of life, now and in the future can be increased" Therefore the guiding principles of sustainable development in the broad sense are: • Respect and care for the community of life • Improve the quality of human life • Conserve the earth's vitality and diversity • Conserve life support system • Conserve biodiversity • Ensure that the use of renewable resources are sustainable • Minimise the depletion of non-renewable resources • Enable communities to care for their own environments • Provide a national framework for integrating the development and conservation
India's Environmental policy, including International Agreements and implementation is principally made by the Ministry of Environment & Forests (MoEF), Government of India. The Convention of Biological Diversity (1992) to which the Government of India is a signatory, dwell a great deal on the need to document the biological diversity existing with in the Indian territory. Being conscious of the intrinsic value of the biological diversity and of the ecological, genetic, social, economic, scientific, educational, cultural, recreational and aesthetic values, especially Article -7 of the Convention proposes the member country for the"Identification and Monitoring" It also calls for the signatories to monitor through sampling and other techniques, besides identifying the process and categories of activities, which are likely to have significant adverse impact on the conservation and sustainable use of resources. This involves a combination of collection and coUating the existing data, generation of new data accessible easily for the conservation of resources. Inventorisations prOVide and develop data on natural resources and help to develop biological bases, reference collections, gene banks, technologies and services required by Government in the execution of its regulatory, developmental and protection functions. These inventories are the benchmarks of databases of reference collections of fauna from different geographic areas and provide density and volumes of different classes of natural resources of the country. The inventorisation will aid in timely warning of impending threats to natural resource base and the impact of human activities thereon in the maintenance of biological diversity in all ecosystems and areas such as ; • States and union territories • Natural ecosystems & habitats • Landscapes where forestry, fisheries and grazing are dominant land use factors • Threatened and Endangered population of wild species • Agriculture and other economically important species and their wild relatives • Species or habitats having significant social and cultural importance (e.g., Sacred groves) • Habitats or ecosystems associated with the key evolutionary (e.g., "rl!fugia") or biological processes (migratory habitats or corridors)
Precautionary Principle
In recent years a concept called the 'precautionary principle' or 'precautionary approach', which has become an important principle of international environmental law, reflected in global agreements such as the Convention on Biological Diversity (CBD), and the Convention on International Trade in Endangered Species of Wild Fauna and Flora (CITES). The use of precautionary approach resulted from increasing recognition that ecological systems cannot be comprehensively observed and that impacts cannot, therefore, be fully regulated and controlled. In essence, the precautionary approach identifies scientific and other limitations and promotes regulatory action in the absence of full evidence of a cause -effect relationship. It allows incomplete data, uncertainty and indeterminacy to be taken into account in a meaningful way in the decision making process (Stirling, 1999). In other words, if there is a threat, which is uncertain, then some kind of action is mandatory. Stability in terms of population and the ecosystem is commonly known as Homeostasis. During the process, several factors such as biotic and abiotic, acts in the system maintaining a balance of nature. Any deviation from this natural phenomenon results in an abnormal
increase in the population of insect species and turns them pests. This is caused due to the habitat destruction. According to Gess and Gess (1993), loss and reduction of insect species will result from the loss and reduction of plant species, which are direct source of food or habitat. Species most valuable to localised loss are clearly those which are most specialised with respect to their habitat requirements. Clearly, loss of habitat diversity will result in the loss of alpha diversity. The second cause for the Joss of species diversity in insects is overgrazing and deforestation. Introduction of an unproductive South American Weed, Chromolaena odorata in the forests of Nilambur, Kerala resulted in the loss of phytophagous insects and flower visiting insects and caused immeasurable damage as the pollinating insects and predatory insects have become rare in the area. Based on these examples, the role of precautionary principles in the introduction of alien species has become important in recent years.
Keystone Species
Species, which have disproportionately large influence on the structure of the ecosystem, are called Keystone Species, and when such species are removed, there is profound detrimental effect on the system, i.e., Cascading effect (Reid and Miller, 1989). Solbring (1991) divided the keystone species impacting insects into three categories viz., predators, parasitoids, herbivores and pathogens forming the first group; they maintain the diversity of insects by redUcing the abundance of dominant competition and thus prevent competitive exclusion. Second group includes Mutualists; the loss of one species may cause the loss of a second species. For e.g., loss of pollinators (e.g., bees & fig wasps) will result in the loss of ability of fertilisation in several trees. The last includes species which provide resources for the survival of the dependent population (many species of ants acts as key stone species for e.g. survival of Pangolin (Manis crassicalldata) depends on the availability of ants.
Biodiversity And Economics
The major problem, involved in the application of the methods to assess the value of biodiversity is defining exactly what is meant by biodiversity, a notoriously intractable question. In this regard, the distinction between val~ing biological resources and valUing biological diversity (i.e. the range of variation in biological resources, whether measured quantitatively or qualitatively) is an important one and leads to two different types of questions: in the first instance, a gross estimate of the value of biological resources in a particular geographic locate is sought; in the second, attempts are made to trace the impact of changes in diversity on economic values. The economic values are regarded a useful tool for addressing threats as it enables conservationists to compare issues and problems and devise appropriate responses. It provide new ways of thinking, analyses problems, identifies how some solutions may give perverse or inappropriate incentives to act and gives new perspectives enabling conservationists to capture total values. Basic training in economic approaches to biodiversity conservation is achieved by developing skills to :
• Identify economic causes of biodiversity loss in their respective eco-regions • Describe economic tools and instruments for assessing and for correcting the causes • Identify pilot projects to test and implement economic tools and instruments
The total economic value of an environmental resource may be broken down into a range of use and non-use values. The direct use of ecosystem outputs in non-consumptive, consumptive or productive activities is the impact that is most commonly measured in valuation exercises. Included as direct uses would be the harvesting of wild species for use as food, fuel, shelter or medicine. Other activities such as eco-tourism involve a direct "transaction" between people and biological resources and fall in the category of direct use values. Some direct uses of biological resources such as commercial logging, agriculture or fisheries generate products which are exchanged in the market place, while the products of others such as subsistence hunting and gathering go largely un-marketed. In the latter case, although these non-marketed resources have no financial value (cash price in exchange) they do have economic value as they are of importance to society.
Biological resources may also make indirect contributions to the welfare of society. Environmental functions support economic activity by recycling important elements such as carbon, oxygen and nitrogen and by acting as a buffer against excessive variations in weather, climate and other natural events outside the control of human beings. Ecoi",omists. are increasingly attempting to place values on these indirect uses. Since indirect. use values do not enter directly into human preferences and are often widely available, their value is not often recognised and incorporated into development decisions. In addition to direct and indirect use values, biological resources may have option and existence (non-use) values. Option values are associated with the future use of a resource and future flows of information regarding the use of resources. Risk-aversion dictates that societies should be willing to pay an additional sum above and beyond what a future use value of a biological resource is worth in order to guarantee future access. If this is the case, there is an 'extra' value that can be placed alongside the use values of the resource.
Finally, there may be non-use or existence values associated with a resource. These are benefits derived by an individual from the mere knowledge that the resource exists. For example, people who donate money to a conservation organization with no expectation of ever visiting the habitats or hunting the species which the organization aims to conserve must be deriving some satisfaction that is simply a result of the continued survival of the species or habitat. The Objective (Article 1) of the convention is "to conserve the maximum possible biological diversity for the benefit of present and future generations and for its intrinsic value"
