Food habits of Indians
This is a collection of articles archived for the excellence of their content. |
Contents |
Cereals, the consumption of
1999-2023
June 10, 2024: The Times of India

From: June 10, 2024: The Times of India
New Delhi; The share of cereals in total expenditure in rural India varies from 3% in Haryana, Kerala and Punjab to 7% in Bihar, Jharkhand and West Bengal, survey results have shown.
Household Consumption Expenditure survey (HCES) for 2022-23 showed that in urban India, the share varies from 3% in Haryana, Karnataka, Kerala, Punjab and Tamil Nadu to 6% in Bihar and Jharkhand.
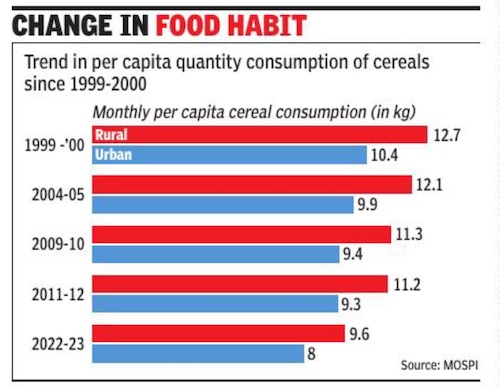
There has been a gradual decline in per capita quantity consumption of cereals in rural as well as urban areas between 1999-2000 to 2022-23 as greater prosperity has prompted people to shift to proteins, processed food and other items. For instance, monthly per capita cereal consumption was highest in West Bengal at 11.2%, followed by Bihar at 11.1%. Kerala had lowest at 6.6%.
When it comes to percentage share of rice in total consumption of cereals, Assam was at 95.9%, followed by Andhra Pradesh and Chhattisgarh at 92.2%, Telangana at 92.1% and Odisha at 90.7%.
Lowest was in Rajasthan at 3.2% and Haryana at 9.8% and Punjab at 11.6%.
“As incomes go up, cereal consumption goes down and more of proteins, milk, meat and eggs, and fruits and vegetables are consumed,” said Ashok Gulati, Infosys chair professor of agriculture at economic think tank ICRIER, highlighting steady rise in incomes over the years which has helped income inequality to dip across country.
For wheat, highest consumption was Haryana at 88.6%, Punjab 87.5% and Rajasthan at 84.8%.
Lowest was in Assam at 4%, followed by Telangana at 5%, Tamil Nadu at 7.2%, Chhattisgarh at 7.8% and Odisha at 8.4%. Karnataka had highest share in coarse grains at 19.4%, followed by Gujarat at 16.7% and Maharashtra at 12.3%. Share of West Bengal was nil, followed by UP and Kerala at 0.1%, Punjab at 0.6%.
The survey results showed that the share of food in total consumption expenditure of rural households varies from 39% in Kerala to 54% in Bihar and Assam. For the urban sector, the share of food in consumption expenditure varies from 35% in Telangana to 47 % in Assam and Bihar. Information in the survey was collected from 8,723 villages and 6,115 urban blocks spread over the entire country covering 2,61,746 households (1,55,014 in rural and 1,06,732 in urban areas).
State-wise
2009-2023
June 9, 2024: The Times of India

From: June 9, 2024: The Times of India

From: June 9, 2024: The Times of India
New Delhi : Share of milk and milk products in total consumption is higher in rural areas in Gujarat, Haryana, Madhya Pradesh, Punjab, Rajasthan and Uttar Pradesh while eggs, meat and fish account for a greater share for households in Kerala.
The final Household Consumption Expenditure survey, released by National Sample Survey Office (NSSO) late Friday, also shows that for other states, beverages & processed food have the maximum share in rural segments. In urban areas, Haryana, Punjab, Rajasthan and Uttar Pradesh have the maximum share of consumption for milk and milk products. For the remaining states, it’s beverages and processed food. The survey data shows significant shifts in rural and urban consumption with the share of food and cereals coming down. This is in line with the trend visible in earlier surveys.
Share of food spend plummeted in both urban & rural India: NSSO ’’’
Spend On TVs, Processed Food, Healthcare Up
Spending on non-food items such as fridge, television, beverages and processed food, medical and transportation have increased between 2011-12 and 2022-23 while expenditure on food such as cereals and pulses has slowed. Households in Haryana had the highest share of milk and milk products in total consumption at 41.7%, followed by Rajasthan at 35.5%, and Punjab at 34.7%.
Chhattisgarh and West Bengal had the lowest share at 7.5% and 7.4%, respectively, under this category.
In the rural areas, households in Rajasthan and Gujarat had the lowest share of eggs, meat and fish in total consumption at 2.6%, followed by Punjab at 3%.
The share of food is seen to have shrunk from 59.4% in 1999-00 to 46.4% in 2022-23 in rural areas and from 48.1% to 39.2% in urban areas during the corresponding period, according to the survey results.
The decline in share has been the steepest for cereals, which has come down to 4.9% in 2022-23 from 22.2% in 1999-2000 in rural India. For urban India, the corresponding share has declined to 3.6% in 2022-23 from 12.4% in 1999-2000.
Sugar consumption
2019
TNN, January 9, 2020: The Times of India

From: TNN, January 9, 2020: The Times of India
NEW DELHI: Most of us know that consuming excess sugar may have a health impact. But for most of us, that is hardly an argument convincing enough to make us shun sweets. While fruits, vegetables and dairy products are among foods that naturally contain sugar, we also end up consuming added sugar in the form of desserts, sweet beverages and suchlike.
An ICMR-National Institute of Nutrition (NIN), Hyderabad, survey, which was sponsored by International Life Sciences Institute-India (ILSI-India), measured added sugar intake levels in seven major metro cities. Here’s what it found.
What is added sugar?
The sugars and syrups added to foods during processing. Desserts, sodas and energy and sports drinks are among foods/beverages that contain added sugars. WHO guidelines issued in 2015 called for adults and children to reduce daily intake of free sugars to less than 10% of total energy intake. It added that a further reduction to below 5% or roughly 25 gm (6 teaspoons) per day would provide additional health benefits. That would suggest most Indian metros are keeping their added sugar use in check.
See also
Food habits of Indians