India: The Land and the People
This article has been sourced from an authoritative, official After the formal launch of their online archival encyclopædia, |
Contents |
Population,Decadal Increase, Area(Km2), Density,Sex-Ratio,Literacy
2011, state-wise
Source: Census 2011
|
# |
State |
Population |
Increase |
Area(Km2) |
Density |
Sex-Ratio |
Literacy |
|
- |
India |
1,210,854,977 |
17.64 % |
3,287,240 |
382 |
940 |
74.04 |
|
1 |
Uttar Pradesh |
199,812,341 |
20.23 % |
240,928 |
829 |
912 |
67.68 |
|
2 |
Maharashtra |
112,374,333 |
15.99 % |
307,713 |
365 |
929 |
82.34 |
|
3 |
Bihar |
104,099,452 |
25.42 % |
94,163 |
1,106 |
918 |
61.80 |
|
4 |
West Bengal |
91,276,115 |
13.84 % |
88,752 |
1,028 |
950 |
76.26 |
|
5 |
Andhra Pradesh |
84,580,777 |
10.98 % |
275,045 |
308 |
993 |
67.02 |
|
6 |
Madhya Pradesh |
72,626,809 |
20.35 % |
308,252 |
236 |
931 |
69.32 |
|
7 |
Tamil Nadu |
72,147,030 |
15.61 % |
130,060 |
555 |
996 |
80.09 |
|
8 |
Rajasthan |
68,548,437 |
21.31 % |
342,239 |
200 |
928 |
66.11 |
|
9 |
Karnataka |
61,095,297 |
15.60 % |
191,791 |
319 |
973 |
75.36 |
|
10 |
Gujarat |
60,439,692 |
19.28 % |
196,244 |
308 |
919 |
78.03 |
|
11 |
Orissa |
41,974,218 |
14.05 % |
155,707 |
270 |
979 |
72.87 |
|
12 |
Kerala |
33,406,061 |
4.91 % |
38,852 |
860 |
1084 |
94.00 |
|
13 |
Jharkhand |
32,988,134 |
22.42 % |
79,716 |
414 |
948 |
66.41 |
|
14 |
Assam |
31,205,576 |
17.07 % |
78,438 |
398 |
958 |
72.19 |
|
15 |
Punjab |
27,743,338 |
13.89 % |
50,362 |
551 |
895 |
75.84 |
|
16 |
Chhattisgarh |
25,545,198 |
22.61 % |
135,192 |
189 |
991 |
70.28 |
|
17 |
Haryana |
25,351,462 |
19.90 % |
44,212 |
573 |
879 |
75.55 |
|
18 |
Delhi |
16,787,941 |
21.21 % |
1,483 |
11,320 |
868 |
86.21 |
|
19 |
Jammu and Kashmir |
12,541,302 |
23.64 % |
222,236 |
56 |
889 |
67.16 |
|
20 |
Uttarakhand |
10,086,292 |
18.81 % |
53,483 |
189 |
963 |
78.82 |
|
21 |
Himachal Pradesh |
6,864,602 |
12.94 % |
55,673 |
123 |
972 |
82.80 |
|
22 |
Tripura |
3,673,917 |
14.84 % |
10,486 |
350 |
960 |
87.22 |
|
23 |
Meghalaya |
2,966,889 |
27.95 % |
22,429 |
132 |
989 |
74.43 |
|
24 |
Manipur |
2,855,794 |
24.50 % |
22,327 |
128 |
985 |
76.94 |
|
25 |
Nagaland |
1,978,502 |
-0.58 % |
16,579 |
119 |
931 |
79.55 |
|
26 |
Goa |
1,458,545 |
8.23 % |
3,702 |
394 |
973 |
88.70 |
|
27 |
Arunachal Pradesh |
1,383,727 |
26.03 % |
83,743 |
17 |
938 |
65.38 |
|
28 |
Puducherry |
1,247,953 |
28.08 % |
490 |
2,547 |
1037 |
85.85 |
|
29 |
Mizoram |
1,097,206 |
23.48 % |
21,081 |
52 |
976 |
91.33 |
|
30 |
Chandigarh |
1,055,450 |
17.19 % |
114 |
9,258 |
818 |
86.05 |
|
31 |
Sikkim |
610,577 |
12.89 % |
7,096 |
86 |
890 |
81.42 |
|
32 |
Andaman and Nicobar Islands |
380,581 |
6.86 % |
8,249 |
46 |
876 |
86.63 |
|
33 |
Dadra and Nagar Haveli |
343,709 |
55.88 % |
491 |
700 |
774 |
76.24 |
|
34 |
Daman and Diu |
243,247 |
53.76 % |
111 |
2,191 |
618 |
87.10 |
|
35 |
Lakshadweep |
64,473 |
6.30 % |
30 |
2,149 |
946 |
91.85 |
The source of the details given below
INDIA 2012
A REFERENCE ANNUAL
Compiled by
RESEARCH, REFERENCE AND TRAINING DIVISION
PUBLICATIONS DIVISION
MINISTRY OF INFORMATION AND BROADCASTING
GOVERNMENT OF INDIA
India: The Land and the People
"INDIA is the cradle of the human race, the birthplace of human speech, the mother of history, the grandmother of legend and the great grandmother of tradition. Our most valuable and most instructive materials in the history of man are treasured up in India only." —Mark Twain
India has a unique culture and is one of the oldest and greatest civilizations of the world. It stretches from the snow-capped Himalayas in the North to sun drenched coastal villages of the South, the humid tropical forests on the south-west coast, the fertile Brahamputra valley on its East to the Thar desert in the West. It covers an area of 32,87,263 sq. km.1 It has achieved all-round socio-economic progress during the last 63 years of its Independence. India is the seventh largest country in the world and ranks second in population. The country stands apart from the rest of Asia, marked off as it is by mountains and the sea, which give her a distinct geographical entity. Bounded by the Great Himalayas in the north, it stretches southwards and at the Tropic of Cancer, tapers off into the Indian Ocean between the Bay of Bengal on the east and the Arabian Sea on the west.
Lying entirely in the northern hemisphere, the mainland extends between latitudes 8°4' and 37°6' north, longitudes 68°7' and 97°25' east and measures about 3,214 km from north to south between the extreme latitudes and about 2,933 km from east to west between the extreme longitudes. It has a land frontier of about 15,200 km. The total length of the coastline of the mainland, Lakshadweep Islands and Andaman & Nicobar Islands is 7,516.6 km.
India: PHYSICAL BACKGROUND
Countries having a common border with India are Afghanistan and Pakistan to the north-west, China, Bhutan and Nepal to the north, Myanmar to the far east and Bangladesh to the east of West Bengal. Sri Lanka is separated from India by a narrow channel of sea formed by the Palk Strait and the Gulf of Mannar. The country can be divided into six zones mainly North, South, East, West, Central and North-east zone. It has 28 states and seven union territories.
India: PHYSICAL FEATURES
The mainland comprises four regions, namely, the great mountain zone, plains of the Ganga and the Indus, the desert region and the southern peninsula. The Himalayas comprise three almost parallel ranges interspersed with large plateaus and valleys, some of which, like the Kashmir and Kullu valleys, are fertile, extensive and of great scenic beauty. Some of the highest peaks in the world are found in these ranges. The high altitudes admit travel only to a few passes, notably the Jelep La and Nathu La on the main Indo-Tibet trade route through the Chumbi Valley, north-east of Darjeeling and Shipki La in the Satluj valley, north-east of Kalpa (Kinnaur). The mountain wall extends over a distance of about 2,400 km with a varying depth of 240 to 320 km. In the east, between India and Myanmar and India and Bangladesh, hill ranges are much lower. Garo, Khasi, Jaintia and Naga Hills, running almost east-west, join the chain to Mizo and Rkhine Hills running northsouth. The plains of the Ganga and the Indus, about 2,400 km long and 240 to 320 km broad, are formed by basins of three distinct river systems - the Indus, the Ganga and the Brahmaputra. They are one of the world’s greatest stretches of flat alluvium and also one of the most densely populated areas on the earth. Between the Yamuna at Delhi and the Bay of Bengal, nearly 1,600 km away, there is a drop of only 200 metres in elevation.
The desert region can be divided into two parts - the great desert and the little desert. The great desert extends from the edge of the Rann of Kuchch beyond the Luni river northward. The whole of the Rajasthan-Sind frontier runs through this. The little desert extends from the Luni between Jaisalmer and Jodhpur up to the northern wastes. Between the great and the little deserts lies a zone of absolutely sterile country, consisting of rocky land, cut up by limestone ridges.
The Peninsular Plateau is marked off from the plains of the Ganga and the Indus by a mass of mountain and hill ranges varying from 460 to 1,220 metres in height. Prominent among these are the Aravalli, Vindhya, Satpura, Maikala and Ajanta. The Peninsula is flanked on the one side by the Eastern Ghats where average elevation is about 610 metres and on the other by the Western Ghats where it is generally from 915 to 1,220 metres, rising in places to over 2,440 metres. Between the Western Ghats and the Arabian Sea lies a narrow coastal strip, while between Eastern Ghats and the Bay of Bengal, there is a broader coastal area. The southern point of plateau is formed by the Nilgiri Hills where the Eastern and the Western Ghats meet. The Cardamom Hills lying beyond may be regarded as a continuation of the Western Ghats.
GEOLOGICAL STRUCTURE
The geological regions broadly follow the physical features and may be grouped into three regions: the Himalayas and their associated group of mountains, the Indo- Ganga Plain and the Peninsular Shield.
The Himalayan mountain belt to the north and the Naga-Lushai mountain in the east, are the regions of mountain-building movement. Most of this area, now presenting some of the most magnificent mountain scenery in the world, was under marine conditions about 60 crore years ago. In a series of mountain-building movements commencing about seven crore years ago, the sediments and the basement rocks rose to great heights. The weathering and erosive agencies worked on these to produce the relief seen today. The Indo-Ganga plains are a great alluvial tract that separate the Himalayas in the north from the Peninsula in the south.
The Peninsula is a region of relative stability and occasional seismic disturbances. Highly metamorphosed rocks of the earliest periods, dating back as far as 380 crore years, occur in the area; the rest being covered by the coastal-bearing Gondwana formations, lava flows belonging to the Deccan Trap formation and younger sediments.
India: RIVER SYSTEMS
The river systems of India can be classified into four groups viz., (i) Himalayan rivers, (ii) Deccan rivers, (iii) Coastal rivers, and (iv) Rivers of the inland drainage basin. The Himalayan rivers are formed by melting snow and glaciers and therefore, continuously flow throughout the year. During the monsoon months, Himalayas receive very heavy rainfall and rivers swell, causing frequent floods. The Deccan rivers on the other hand are rainfed and therefore fluctuate in volume. Many of these are non-perennial. The Coastal streams, especially on the west coast are short in length and have limited catchment areas. Most of them are non-perennial. The streams of inland drainage basin of western Rajasthan are few and far apart. Most of them are of an ephemeral character.
The main Himalayan river systems are those of the Indus and the Ganga- Brahmaputra-Meghna system. The Indus, which is one of the great rivers of the world, rises near Mansarovar in Tibet and flows through India and thereafter through Pakistan and finally falls into the Arabian sea near Karachi. Its important tributaries flowing in Indian territory are the Sutlej (originating in Tibet), the Beas, the Ravi, the Chenab and the Jhelum. The Ganga-Brahmaputra-Meghna is another important system of which the principal sub-basins are those of Bhagirathi and the Alaknanda, which join at Dev Prayag to form the Ganga. It traverses through Uttarakhand, Uttar Pradesh, Bihar and West Bengal states. Below Rajmahal hills, the Bhagirathi, which used to be the main course in the past, takes off, while the Padma continues eastward and enters Bangladesh. The Yamuna, the Ramganga, the Ghaghra, the Gandak, the Kosi, the Mahananda and the Sone are the important tributaries of the Ganga. Rivers Chambal and Betwa are the important sub-tributaries, which join Yamuna before it meets the Ganga. The Padma and the Brahmaputra join at Bangladesh and continue to flow as the Padma or Ganga. The Brahmaputra rises in Tibet, where it is known as Tsangpo and runs a long distance till it crosses over into India in Arunachal Pradesh under the name of Dihang. Near Passighat, the Debang and Lohit join the river Brahmaputra and the combined river runs all along the Assam in a narrow valley. It crosses into Bangladesh downstream of Dhubri.
The principal tributaries of Brahmaputra in India are the Subansiri, Jia Bhareli, Dhansiri, Puthimari, Pagladiya and the Manas. The Brahmaputra in Bangladesh fed by Tista, etc. finally falls into Ganga. The Barak river, the head stream of Meghna, rises in the hills in Manipur. The important tributaries of the river are Makku, Trang, Tuivai, Jiri, Sonai, Rukni, Katakhal, Dhaleswari, Langachini, Maduva and Jatinga. Barak continues in Bangladesh till the combined Ganga—Brahmaputra join it near Bhairab Bazar.
In the Deccan region, most of the major river systems flowing generally in east direction fall into Bay of Bengal. The major east flowing rivers are Godavari, Krishna, Cauvery, Mahanadi, etc. Narmada and Tapti are major West flowing rivers.
The Godavari in the southern Peninsula has the second largest river basin covering 10 per cent of the area of India. Next to it is the Krishna basin in the region, while the Mahanadi has the third largest basin. The basin of the Narmada in the uplands of the Deccan, flowing to the Arabian Sea and of the Kaveri in the south, falling into the Bay of Bengal are about the same size, though with different character and shape.
There are numerous coastal rivers, which are comparatively small. While only handful of such rivers drain into the sea near the delta of east coast, there are as many as 600 such rivers on the west coast.
A few rivers in Rajasthan do not drain into the sea. They drain into salt lakes and get lost in sand with no outlet to sea. Besides these, there are the desert rivers which flow for some distance and are lost in the desert. These are Luni, Machhu, Rupen, Saraswati, Banas, Ghaggar and others.
The entire country has been divided into twenty river basins/group of river basins comprising twelve major basins and eight composite river basins. The twelve major river basins are : (1) Indus, (2) Ganga-Brahmaputra-Meghna, (3) Godavari, (4) Krishna, (5) Cauvery, (6) Mahanadi, (7) Pennar, (8) Brahmani-Baitarani, (9) Sabarmati, (10) Mahi, (11) Narmada and (12) Topi. Each of these basins has a drainage area exceeding 20,000 sq. km.
The eight composite river basins combining suitably together all the other remaining medium (drainage area of 2,000 to 20,000 sq.km) and small river systems (drainage area less than 2000 sq.km) for the purpose of planning and management are : (1) Subernarekha-combining Subernarekha and other small rivers between Subernarekha and Baitarani, (2) East flowing rivers between Mahanadi and Pennar; (3) East flowing rivers between Pennar and Kanyakumari; (4) Area of Inland Drainage in Rajasthan Desert; (5) West flowing rivers of Kutch and Saurashtra including Luni; (6) West flowing rivers from Tapi to Tadri; (7) West flowing rivers from Tadri to Kanyakumari and (8) Minor rivers draining into Myanmar (Burma) and Bangladesh.
CLIMATE/SEASONS
The climate of India may be broadly described as topical monsoon type. The India Meteorological Department (IMD) designates four official seasons: (i) Winter, occurring from December to early April. The year's coldest months are December and January, when temperatures average around 10-15 °C (50-59 °F) in the northwest; temperatures rise as one proceeds towards the equator, peaking around 20-25 °C (68-77 °F) in mainland India's southeast, (ii) Summer or pre-monsoon season, lasting from April to June (April to July in northwestern India). In western and southern regions, the hottest month is April; for northern regions, May is the hottest month. Temperatures average around 32-40 °C (90-104 °F) in most of the interior, (iii) Monsoon or rainy season, lasting from June to September. The season is dominated by the humid southwest summer monsoon, which slowly sweeps across the country beginning in late May or early June. Monsoon rains begin to recede from North India at the beginning of October. South India typically receives more rainfall, and (iv) Post-monsoon season, lasting from October to December. In northwestern India, October and November are usually cloudless.
The Himalayan states, being more temperate, experience an additional two seasons: autumn and spring. Traditionally, Indians note six seasons, each about two months long. These are the spring (Sanskrit : vasanta), summer (grisma), monsoon season (varsa), early autumn (sarada), late autumn (hemanta), and winter (sisira). These are based on the astronomical division of the twelve months into six parts. The ancient Hindu calendar also reflects these seasons in its arrangement of months. India's climate is affected by two seasonal winds—the north-east monsoon and the south-west monsoon. The north-east monsoon commonly known as winter monsoon blows from land to sea whereas south-west monsoon known as summer monsoon blows from sea to land after crossing the Indian ocean, the Arabian sea and the Bay of Bengal. The south-west monsoon brings most of the rainfall during the year in the country
FLORA
India is rich in flora. Available data place India in the tenth position in the world and fourth in Asia in plant diversity. From about 70 per cent geographical area surveyed so far, over 46,000 species of plants have been described by the Botanical Survey of India (BSI), Kolkata. The vascular flora, which forms the conspicuous vegetation cover, comprises 15,000 species.
With a wide range of climatic conditions from the torrid to the arctic, India has a rich and varied vegetation, which only a few countries of comparable size possess. India can be divided into eight distinct-floristic-regions, namely, the western Himalayas, the eastern Himalayas, Assam, the Indus plain, the Ganga plain, the Deccan, Malabar and the Andamans.
The Western Himalayan region extends from Kashmir to Kumaon. Its temperate zone is rich in forests of chir, pine, other conifers and broad-leaved temperate trees. Higher up, forests of deodar, blue pine, spruce and silver fir occur. The alpine zone extends from the upper limit of the temperate zone of about 4,750 metres or even higher. The characteristic trees of this zone are high-level silver fir, silver birch and junipers. The eastern Himalayan region extends from Sikkim eastwards and embraces Darjeeling, Kurseong and the adjacent tract. The temperate zone has forests of oaks, laurels, maples, rhododendrons, alder and birch. Many conifers, junipers and dwarf willows also grow here. The Assam region comprises the Brahamaputra and the Surma valleys with evergreen forests, occasional thick clumps of bamboos and tall grasses. The Indus plain region comprises the plains of Punjab, western Rajasthan and northern Gujarat. It is dry, hot and supports natural vegetation.
The Ganga plain region covers the area which is alluvial plain and is under cultivation for wheat, sugarcane and rice. Only small areas support forests of widely differing types. The Deccan region comprises the entire table land of the Indian Peninsula and supports vegetation of various kinds from scrub jungles to mixed deciduous forests. The Malabar region covers the excessively humid belt of mountain country parallel to the west coast of the Peninsula. Besides being rich in forest vegetation, this region produces important commercial crops, such as coconut, betelnut, pepper, coffee, tea, rubber and cashewnut. The Andaman region abounds in evergreen, mangrove, beach and diluvial forests. The Himalayan region extending from Kashmir to Arunachal Pradesh through Sikkim, Meghalaya and Nagaland and the Deccan Peninsula is rich in endemic flora, with a large number of plants which are not found elsewhere.
The flora of the country is being studied by BSI and its nine circle/field offices located throughout the country along with certain universities and research institutions. Ethno-botanical study deals with the utilisation of plants and plant products by ethnic races. A scientific study of such plants has been made by BSI. A number of detailed ethno-botanical explorations have been conducted in different tribal areas of the country. More than 800 plant species of ethno-botanical interest have been collected and identified at different centres.
Owing to destruction of forests for agricultural, industrial and urban development, several Indian plants are facing extinction. About 1,336 plant species are considered vulnerable and endangered. About 20 species of higher plants are categorised as possibly extinct as these have not been sighted during the last 6-10 decades. BSI brings out an inventory of endangered plants in the form of a publication titled Red Data Book.
FAUNA
The Zoological Survey of India (ZSI), with its headquarters in Kolkata and various regional stations is responsible for surveying the faunal resources of India. Possessing a tremendous diversity of climate and physical conditions, India has great variety of fauna numbering over 91,307 species. Of these, protista number 2,577, mollusca 5,072, anthropoda 69,903, amphibia 240, mammalia 397, reptilia 460, members of protochordata 119, pisces 2,546, aves 1,232 and other invertebrates 8,329.
The mammals include the majestic elephant, the gaur or Indian bison–the largest of existing bovines, the great Indian rhinoceros, the gigantic wild sheep of the Himalayas, the swamp deer, the thamin spotted deer, nilgai, the four-horned antelope, the Indian antelope or black-buck – the only representatives of these genera. Among the cats, the tiger and lion are the most magnificent of all; other splendid creatures such as the clouded leopard, the snow leopard, the marbled cat, etc., are also found. Many other species of mammals are remarkable for their beauty, colouring, grace and uniqueness. Several birds, like pheasants, geese, ducks, myanahs, parakeets, pigeons, cranes, hornbills and sunbirds inhabit forests and wetlands.
Amongst the crocodiles and gharials, the salt water crocodile is found along the eastern coast and in the Andaman and Nicobar Islands. A project for breeding crocodiles which started in 1974, has been instrumental in saving the crocodile from extinction.
The great Himalayan range has a very interesting variety of fauna that includes the wild sheep and goats, markhor, ibex, shrew and tapir. The panda and the snow leopard are found in the upper reaches of the mountains.
Depletion of forest cover due to expansion of agriculture, habitat destruction, over-exploitation, pollution, introduction of toxic imbalance in community structure, epidemics, floods, droughts and cyclones, contribute to the loss of flora and fauna.
DEMOGRAPHIC BACKGROUND
CENSUS
The Census of India 2001, is historic and epoch making, being the first census of the twenty-first century and the third millennium. It reveals benchmark data on the state of abundant human resources available in the country, their demography, culture and economic structure at a juncture, which marks a centennial and millenial transition.
Census 2011 is the 15th Census of India since 1872. It was held in two phases:
l House listing and Housing Census (April to Sept. 2010) and l Population Enumeration (9th to 28th February 2011). Reference Date was 0.00 houses of 1st March 2011. In snow bound areas the Population Enumeration was conducted from 11th to 30th September 2010. The entire census 2011 data at the moment is only provisional in nature. The final population data and other related details will be released in February 2012. In view of this, generally the population related data in the present edition of India Reference Annual are as per census 2001. However, the general trends of census (provisional) 2011 are being mentioned as follows :
l Population : Persons-1210.2 million; Males-623.7 million; and Females-586.5 million.
l Density of Population 2001-2011 : Density in 2001:325 and density in 2011 : 382, difference being 17.5% (density is defined as the number of persons per sq km.)
l Gender composition of Population 2011 : Overall sex ratio at the National level has increased by 7 points since census 2001 to reach 940 at census 2011. This is the highest sex ratio recorded since census 1971 and a shade lower than 1961.
l As per provisional population totals of census 2011, literates constituted 74 per cent of the total population aged seven and above and illiterates form 26 per cent. Literacy rate has gone up from 64.83 per cent in 2001 to 74.04 per cent showing an increase of 9.21 percentage prints. It is encouraging to note that out of total of 217,700,941 literates added during the decade, female, 110,069,001 outnumber male 107,631,940. [courtesy www.censusindia.gov.in]
POPULATION
India’s population as on 1 March 2001 stood at 1,028 million (532.1 million males and 496.4 million females). India accounts for a meagre 2.4 per cent of the world surface area of 135.79 million sq km. Yet, it supports and sustains a whopping 16.7 per cent of the world population.
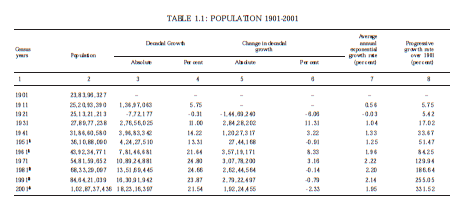
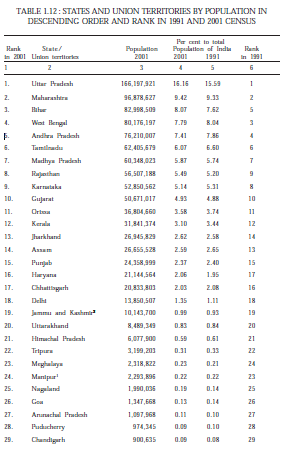
The population of India, which at the turn of the twentieth century was around 238.4 million, increased to reach 1,028 million at the dawn of the twenty-first century. The population of India as recorded at each decennial census from 1901 has grown steadily except for a decrease during 1911-21. Decadal growth of population from 1901 is shown in table 1.1.
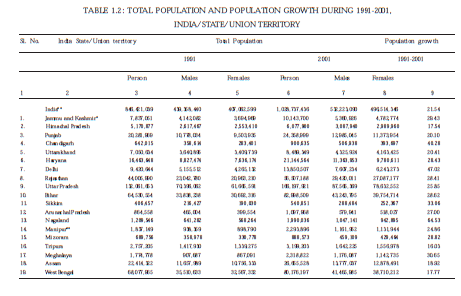
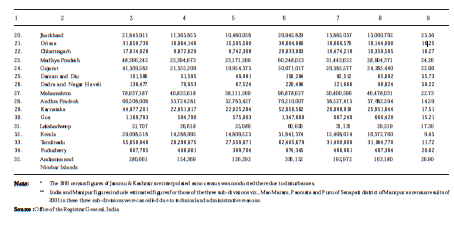
Table 1.2 gives the selected indicators of population growth in different States and Union Territories. The per cent decadal growth of population in the inter-censal period 1991-2001 varies from a low of 9.43 in Kerala to a very high 64.53 in Nagaland. Delhi with 47.02 per cent, Chandigarh with 40.28 per cent and Sikkim with 33.06 per cent registering very high growth rates. In addition to Kerala, Tamilnadu and Andhra Pradesh registered low growth rates during 1991-2001.
POPULATION DENSITY
One of the important indices of population concentration is the density of population. It is defined as the number of persons per sq km. The population density of India in 2001 was 325 per sq km.
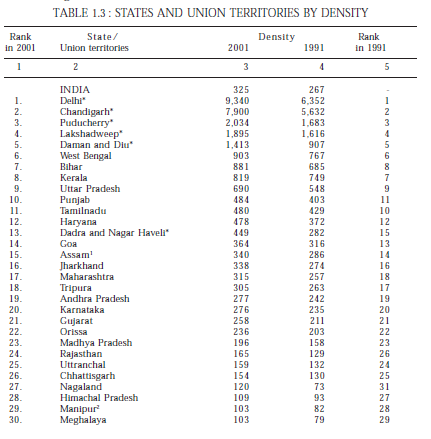
The density of population increased in all States and Union Territories between 1991 and 2001. Among major states, West Bengal is still the most thickly populated state with a population density of 903 in 2001. Bihar is now the second highest densely populated state pushing Kerala to the third place. Ranking of the States and Union Territories by density is shown in table 1.3.
States, UTs with highest. lowest population density

From: March 24, 2025: The Times of India
See graphic:
The states and Union territories with the highest and lowest population density in India; This 2025 graphic must be based on the 2011 census
SEX RATIO
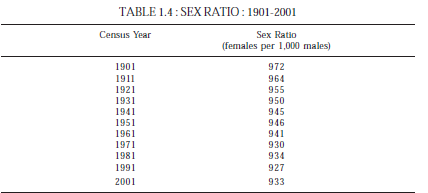
Sex ratio, defined as the number of females per thousand males is an important social indicator to measure the extent of prevailing equality between males and females in a society at a given point of time. The sex ratio in the country had always remained unfavourable to females. It was 972 at the beginning of the 20th century and thereafter showed continuous decline until 1941. The sex ratio from 1901-2001 is given in table 1.4.
TABLE 1.1 : POPULATION 1901-2001
Average
Decadal Growth Change in decadal annual Progressive Census growth exponential growth rate years
Population growth rate over 1901
Absolute Per cent Absolute Per cent (per cent) (per cent)
Notes :
1. In working out ‘Decadal Growth’ and ‘Percentage Decadal Growth’ for India 1941-51 and 1951-61 the population of Tuensang district for 1951 (7,025) and the population of Tuensang (83,501) and Mon (5,774) districts for 1961 Census of Nagaland state have not been taken into account as the areas went in for census for the first time in 1951 and the same are not comparable.
2. The 1981 Census could not be held owing to disturbances in Assam. Hence the population figures for 1981 of Assam have been worked out by ‘interpolation’.
3. The 1991 Census could not be held owing to disturbances in Jammu and Kashmir. Hence the population figures for 1991 of Jammu and Kashmir have been worked out by ‘interpolation’.
4. The population figures of 2001 includes estimated figures for those of the three sub-divisions, viz., Mao Maram, Paomata and Pural of Senapati district of Manipur as census result of 2001 in these three sub-divisions were cancelled due to technical and administrative reasons. Land and the People 9
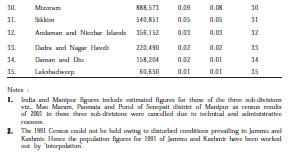
TABLE 1.2 : TOTAL POPULATION AND POPULATION GROWTH DURING 1991-2001,
INDIA/STATE/UNION TERRITORY Sl. No. India State/Union territory Total Population Population growth
Nicobar Islands
Note : * The 1991 census figures of Jammu & Kashmir are interpolated as no census was conducted there due to disturbances.
- India and Manipur figures include estimated figures for those of the three sub-divisions viz., Mao Maram, Paomata and Puru of Senapati district of Manipur as census results of
2001 in these three sub-divisions were cancelled due to technical and administrative reasons.
Source : Office of the Registrar General, India
LITERACY
For the purpose of census 2001, a person aged seven and above, who can both read and write with understanding in any language, is treated as literate. A person, who can only read but cannot write, is not literate. In the censuses prior to 1991, children below five years of age were necessarily treated as illiterates.
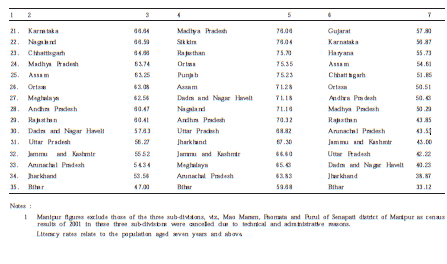
The results of 2001 census reveal that there has been an increase in literacy in the country. The literacy rate in the country is 64.84 per cent, 75.26 for males and 53.67 for females. The steady improvement in literacy is apparent from the table 1.5. Kerala retained its position by being on top with a 90.86 per cent literacy rate, closely followed by Mizoram (88.80 per cent) and Lakshadweep (86.66 per cent). Bihar with a literacy rate of 47.00 per cent ranks last in the country preceded by Jharkhand (53.56 per cent) and Jammu and Kashmir (55.52 per cent). Kerala also occupies the top spot in the country both in male literacy with 94.24 per cent and female literacy with 87.72 per cent. On the contrary, Bihar has recorded the lowest literacy rates both in case of males (59.68 per cent) and females (33.12 per cent). Table 1.6 shows the literacy rate among persons, male and female in States and UTs, and their ranking.
Notes :
1. Includes interpolate population of Jammu & Kashmir for 1991 and estimated population of Assam for 1981.
2. Includes estimated population of Paomata, Mao Maram and Purul sub-divisions of Senapati district of Manipur for 2001.
3. For working out density of India, the entire area and population of those portions of Jammu & Kashmir which are under illegal occupation of Pakistan and China have not been taken into account.
Notes :
1. For 1981, interpolated figures for Assam have been used.
2. For 1991, interpolated figures based on final population of 2001 census for Jammu and Kashmir have been used.
3. India figures for 2001 census exclude those of the three sub-divisions, viz., Mao Maram, Paomata and Purul of Senapati district of Manipur as population Census results of 2001 in these three sub-divisions were cancelled due to technical and administrative reasons.
Notes :
1. Literacy rates for 1951, 1961 and 1971 Censuses relates to population aged five years and above. The rates for the 1981, 1991 and 2001 Censuses relate to the population aged seven years and above.
2. The 1981 Literacy rates exclude Assam where the 1981 Census could not be conducted.
3. The 1991 Literacy rates exclude Jammu and Kashmir where the 1991 Census could not be conducted due to disturbed conditions.
Notes :
1 Manipur figures exclude those of the three sub-divisions, viz., Mao Maram, Paomata and Purul of Senapati district of Manipur as census results of 2001 in these three sub-divisions were cancelled due to technical and administrative reasons. Literacy rates relate to the population aged seven years and above.
Note :
1. India and Manipur figures exclude those of the three sub-divisions, viz., Mao Maram, Paomata and Purul of Senapati district of Manipur as census results of 2001 in these three sub-divisions were cancelled due to technical and administrative reasons.
Note :
1. India and Manipur figures are final and include estimated figures for those of the three subdivisions, viz., Mao Maram, Paomata and Purul of Senapati district of Manipur as census results of 2001 in these three sub-divisions were cancelled due to technical and administrative reasons.
2. The 1991 Census could not be held owing to disturbed conditions prevailing in Jammu and Kashmir. Hence the population figures for 1991 of Jammu and Kashmir have been worked out by 'interpolation' on the basis of 2001 final population.
3. The 1981 census could not be held in Assam. The figures for 1981 for Assam have been worked out by interpolation.
Note :
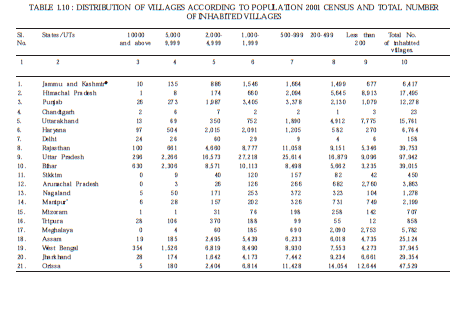
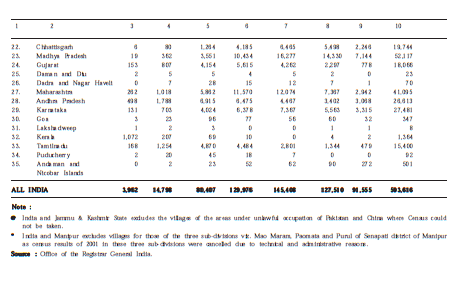
@ India and Jammu & Kashmir State excludes the villages of the areas under unlawful occupation of Pakistan and China where Census could not be taken.
- India and Manipur excludes villages for those of the three sub-divisions viz. Mao Maram, Paomata and Purul of Senapati district of Manipur
as census results of 2001 in these three sub-divisions were cancelled due to technical and administrative reasons.
Source : Office of the Registrar General India.
Notes :
1. India and Manipur figures include estimated figures for those of the three sub-divisions viz., Mao Maram, Paomata and Purul of Senepati district of Manipur as census results of 2001 in these three sub-divisions were cancelled due to technical and administrative reasons.
2. The 1991 Census could not be held owing to disturbed conditions prevailing in Jammu and Kashmir. Hence the population figures for 1991 of Jammu and Kashmir have been worked out by 'interpolation'.
2011: Break-up according to religion
The Times of India, 25th August 2015
Hindu Population Declined; Muslims Increased: 2011 Census
The Muslim community has registered a moderate 0.8 per cent growth to touch 17.22 crore in the 10 year period between 2001 and 2011, up from 13.8 crore, while Hindus population showed a decline by 0.7 per cent at 96.63 crore during the period, according to the latest census data on religion.
While the census figure on religion was released in 2015, more than four years after compilation of the data, the caste data is yet to be made public. RJD, JD(U), SP, DMK and some other parties have been asking the government to release the caste census figure. The data on socio economic status of the population was released on July 3.
As per the religious census data of 2011, released by the Registrar General and Census Commissioner today, the total population in the country in 2011 was 121.09 crore. Hindu population is 96.63 crores (79.8 per cent); Muslim 17.22 crores (14.2 per cent); Christian 2.78 crores (2.3 per cent); Sikh 2.08 crores (1.7 per cent); Buddhist 0.84 crores (0.7 per cent); Jain 0.45 crores (0.4 per cent), Other religions and persuasions (ORP) 0.79 crores (0.7 per cent) and religion not stated 0.29 crores (0.2 per cent).
The proportion of Muslim population to total population has increased by 0.8 percentage point (PP) in 2011, the census data said. The proportion of Hindu population to total population in 2011 has declined by 0.7 PP; the proportion of Sikh population has declined by 0.2 PP and the Buddhist population has declined by 0.1 PP during the decade 2001-2011.
There has been no significant change in the proportion of Christians and Jains. As per 2001 census, India's total population was 102 crores of which Hindu population comprised of 82.75 crore (80.45 per cent) and Muslims were 13.8 crore (13.4 per cent).
The growth rate of population in the decade 2001-2011 was 17.7 per cent. The growth rate of population of the different religious communities in the same period was as Hindus: 16.8 per cent; Muslim: 24.6 per cent; Christian: 15.5 per cent; Sikh: 8.4 per cent; Buddhist: 6.1 per cent and Jain: 5.4 per cent.
The distribution is total population by six major religious communities namely, Hindu, Muslim, Christian, Sikh, Buddhist, Jain besides 'Other Religions and Persuasions' and 'Religion not stated'.
