Life Expectancy: India
This is a collection of articles archived for the excellence of their content. the Facebook community, Indpaedia.com. All information used will be acknowledged in your name. |
Changes over the years
1901- 2011

From Bagsmrita Bhagawati and Labananda Choudhury, Generation Life Table for India, 1901-1951
See graphic, ' Life expectancy in India, 1901- 2011 '
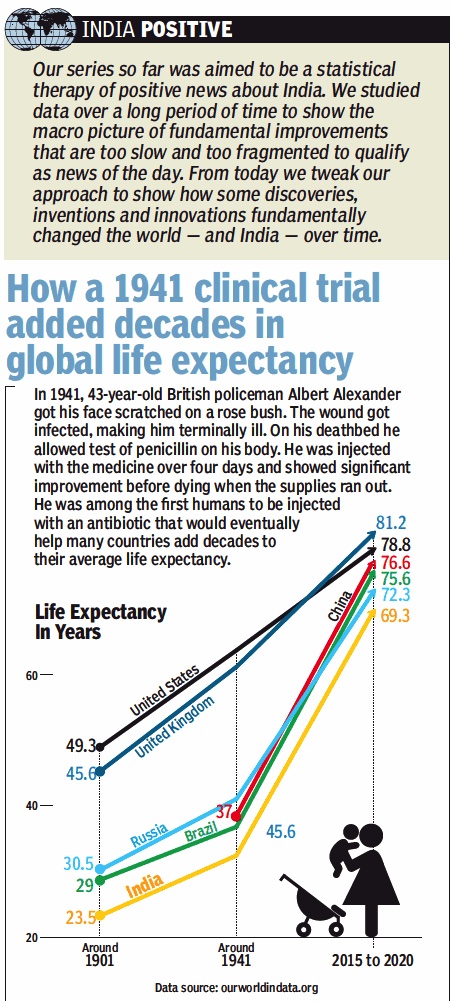
1901- 2011: India vis-à-vis Brazil, China, UK, USA
From: July 25, 2019: The Times of India
See graphic, ‘ Life expectancy in India vis-à-vis Brazil, China, Russia, UK, USA, 1901- 2011’
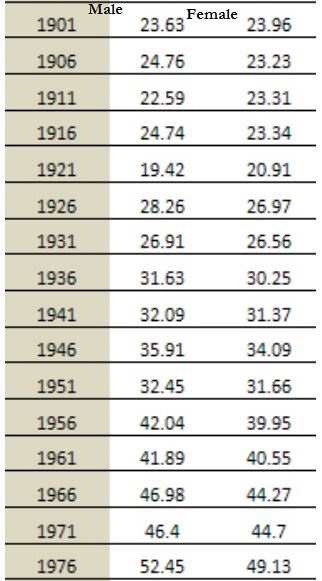
1901- 1976
From Bagsmrita Bhagawati and Labananda Choudhury, Generation Life Table for India, 1901-1951
See graphic, ' Life expectancy in India, 1901- 1976 '
1950-2019: 32 years added
July 4, 2019: The Times of India

From: July 4, 2019: The Times of India
Access to better healthcare and sanitation has increased average life expectancy everywhere in the world. In India, it has increased by 32 years since Independence. Better sanitation, housing and availability of medical facilities, as well as the development of vaccines, have significantly reduced early- and mid-age deaths.
1998-2006
December 22, 2014: The Planning Commission]
|
No. |
India & Major |
1998-2002 |
1999-2003 |
2000-04 |
2001-05 |
2002-06* | |||||
|
States |
Male |
Female |
Male |
Female |
Male |
Female |
Male |
Female |
Male |
Female | |
|
1 |
2 |
3 |
4 |
5 |
6 |
7 |
8 |
9 |
10 |
11 | |
|
India |
61.6 |
63.3 |
61.8 |
63.5 |
62.1 |
63.7 |
62.3 |
63.9 |
62.6 |
64.2 | |
|
1 |
Andhra Pradesh |
62.0 |
64.6 |
62.2 |
64.8 |
62.4 |
65.0 |
62.7 |
65.2 |
62.9 |
65.5 |
|
2 |
Assam |
57.7 |
58.1 |
57.8 |
58.3 |
58.0 |
58.6 |
58.3 |
59.0 |
58.6 |
59.3 |
|
3 |
Bihar |
61.4 |
59.5 |
61.6 |
59.7 |
61.8 |
59.9 |
62.0 |
60.1 |
62.2 |
60.4 |
|
4 |
Gujarat |
62.4 |
64.4 |
62.5 |
64.6 |
62.7 |
64.8 |
62.8 |
65.0 |
62.9 |
65.2 |
|
5 |
Haryana |
64.7 |
65.4 |
65.0 |
65.6 |
65.3 |
65.8 |
65.6 |
66.0 |
65.9 |
66.3 |
|
6 |
Himachal Pradesh |
65.7 |
66.3 |
65.8 |
66.6 |
66.1 |
66.8 |
66.3 |
67.1 |
66.5 |
67.3 |
|
7 |
Karnataka |
62.8 |
66.2 |
62.9 |
66.4 |
63.1 |
66.7 |
63.4 |
66.9 |
63.6 |
67.1 |
|
8 |
Kerala |
70.8 |
75.9 |
70.9 |
76.0 |
71.0 |
76.1 |
71.3 |
76.3 |
71.4 |
76.3 |
|
9 |
Madhya Pradesh |
57.0 |
56.7 |
57.2 |
56.9 |
57.5 |
57.2 |
57.8 |
57.5 |
58.1 |
57.9 |
|
10 |
Maharashtra |
65.0 |
67.4 |
65.2 |
67.6 |
65.5 |
67.8 |
65.8 |
68.1 |
66.0 |
68.4 |
|
11 |
Orissa |
58.4 |
58.5 |
58.6 |
58.7 |
58.9 |
58.9 |
59.2 |
59.2 |
59.5 |
59.6 |
|
12 |
Punjab |
67.4 |
69.5 |
67.6 |
69.6 |
67.8 |
69.8 |
68.1 |
70.1 |
68.4 |
70.4 |
|
13 |
Rajasthan |
60.5 |
61.6 |
60.7 |
61.8 |
60.9 |
62.0 |
61.2 |
62.2 |
61.5 |
62.3 |
|
14 |
Tamil Nadu |
64.2 |
66.3 |
64.3 |
66.5 |
64.6 |
66.8 |
64.8 |
67.1 |
65.0 |
67.4 |
|
15 |
Uttar Pradesh |
59.4 |
58.5 |
59.6 |
58.7 |
59.9 |
59.0 |
60.1 |
59.3 |
60.3 |
59.5 |
|
16 |
West Bengal |
63.3 |
64.8 |
63.5 |
65.0 |
63.7 |
65.2 |
63.9 |
65.5 |
64.1 |
65.8 |
Source : SRS, Registrar General of India, based Abridge Life Tables, 2002-06; * Bihar, MP & UP includes Jharkhand, Chhatisgarh & Uttarakhand resp.; National Health Profile 2008 : MoHFW
Life Expectancy of India for 2005-10 period : Overall (64.7); Male (63.2) & Female (66.4) as per United Nations World Fact Book; (September 17, 2009)
1986- 2011

From Bagsmrita Bhagawati and Labananda Choudhury, Generation Life Table for India, 1901-1951
See graphic, ' Life expectancy in India, 1986- 2011 '
1990–2013: 8.6 years added
December 18, 2014

One of the Best gains worldwide: The Lancet
Every fifth death in the world is that of an Indian, but Indians are also living at least 8.6 years longer on an average than in 1990, one of the best gains worldwide in life expectancy. In 2013, heart, lung or brain problems caused a third of all mortality in the country. Suicides, road traffic accidents and lifestyle disease diabetes have now muscled into the top 10 killers' list. Tuberculosis and heart diseases are the largest killers of Indians in the most productive age group of 15 to 49 years, says the first country-specific cause-of-death data for 188 countries published in The Lancet on
A comparison of the data from 1990 and 2013 showed that heart diseases and stroke have increased their death grip on Indians, but TB and pneumonia are no longer the top killers. “It is good news for India that the death share (26%) of the three major infectious diseases --tuberculosis (9%), pneumonia (9%) and diarrhoea (8%) -has reduced by 50% during the last 23 years,“ said Kaushalendra Kumar, one of the co-authors from the International Institute for Population Sciences in Deonar.
Another co-author Dr Nobhojit Roy , professor at BARC Hospital in Chembur, concurred. “India is going through an epidemiological transition with communicable diseases going down and non-communicable diseases going up. Diseases like malaria and HIV are down and lifestyle-related diseases such as heart diseases and hypertension are going up. The biggest indicator of India's relative better health is the rise in life expectancy.“Life expectancy improved for both men (64.2 years) and women (68.5 years) in India, at an average of 8.6 years gained since 1990. This was a larger increase than the global aver age, and one of the top 25 biggest gains in life expectancy worldwide, said the report.
The global report, coordinated by the Institute for Health Metrics and Evaluation (IHME) and funded by the Bill & Melinda Gates Foundation, said people live longer worldwide than they did two decades ago as death rates from infectious diseases and cardiovascular disease have fallen.
Since 1990, India saw marked declines in mortality from a number of diseases that used to take a large toll on the country . For instance, by 2013, mortality from diarrhoeal diseases reduced by 42%. In 1990, pneumonia and diarrhoeal diseases killed 15,32,459 people.Twenty-three years later, they claimed 7,15,303 fewer lives.
India, however, came in for a bit of criticism for poor health records while neighbouring China won praise for providing detailed reports.“India has to spend on research and surveillance. If you don't know what is killing people, how will you plan a health programme to check it?“ asked Dr Roy .
“All our policies and programmes are based on virtually no data and, therefore, it is difficult to measure effects of policy interventions or initiate effective programmes,“ said Kumar.
2001- 2025: Projected Levels of Expectation of Life at Birth in India & Major States
December 22, 2014: The Planning Commission
|
No. |
India & Major |
2001-05 |
2006-10 |
2011-15 |
2016-20 |
2021-25 | |||||
|
States |
Male |
Female |
Male |
Female |
Male |
Female |
Male |
Female |
Male |
Female | |
|
1 |
2 |
3 |
4 |
5 |
6 |
7 |
8 |
9 |
10 |
11 | |
|
India |
63.8 |
66.1 |
65.8 |
68.1 |
67.3 |
69.6 |
68.8 |
71.1 |
69.8 |
72.3 | |
|
1 |
Andhra Pradesh |
63.4 |
67.9 |
65.4 |
69.4 |
66.9 |
70.9 |
68.4 |
72.1 |
69.4 |
73.3 |
|
2 |
Assam |
59.6 |
60.8 |
61.6 |
62.8 |
63.6 |
64.8 |
65.6 |
66.8 |
67.1 |
68.8 |
|
3 |
Bihar |
65.6 |
64.7 |
67.1 |
66.7 |
68.6 |
68.7 |
69.6 |
70.2 |
70.6 |
71.4 |
|
4 |
Gujarat |
64.9 |
69.0 |
67.2 |
71.0 |
69.2 |
72.5 |
70.7 |
73.7 |
71.9 |
74.9 |
|
5 |
Haryana |
66.4 |
68.3 |
67.9 |
69.8 |
68.9 |
71.3 |
69.9 |
72.5 |
70.9 |
73.7 |
|
6 |
Karnataka |
64.5 |
69.6 |
66.5 |
71.1 |
68.0 |
72.3 |
69.0 |
73.5 |
70.0 |
74.5 |
|
7 |
Kerala |
70.8 |
76.0 |
72.0 |
76.8 |
73.2 |
77.6 |
74.2 |
78.1 |
75.2 |
78.6 |
|
8 |
Madhya Pradesh |
60.5 |
61.3 |
62.5 |
63.3 |
64.5 |
65.3 |
66.5 |
67.3 |
68.0 |
69.3 |
|
9 |
Maharashtra |
66.4 |
69.8 |
67.9 |
71.3 |
68.9 |
72.5 |
69.9 |
73.7 |
70.9 |
74.7 |
|
10 |
Orissa |
60.3 |
62.3 |
62.3 |
64.8 |
64.3 |
67.3 |
66.3 |
69.6 |
67.8 |
71.6 |
|
11 |
Punjab |
67.7 |
70.4 |
68.7 |
71.6 |
69.7 |
72.8 |
70.7 |
73.8 |
71.5 |
74.8 |
|
12 |
Rajasthan |
64.1 |
67.2 |
66.1 |
69.2 |
67.6 |
70.7 |
68.6 |
71.9 |
69.6 |
73.1 |
|
13 |
Tamil Nadu |
66.1 |
69.1 |
67.6 |
70.6 |
68.6 |
71.8 |
69.6 |
73.0 |
70.6 |
74.0 |
|
14 |
Uttar Pradesh |
62.0 |
61.9 |
64.0 |
64.4 |
66.0 |
66.9 |
67.5 |
69.2 |
68.7 |
71.2 |
|
15 |
West Bengal |
66.7 |
69.4 |
68.2 |
70.9 |
69.2 |
72.1 |
70.2 |
73.3 |
71.0 |
74.3 |
Source : Report of the Technical Group on Population Projections May 2006, National Commission on Population/MoHFW and National Health Profile 2008; MoHFW
2017, life expectancy level
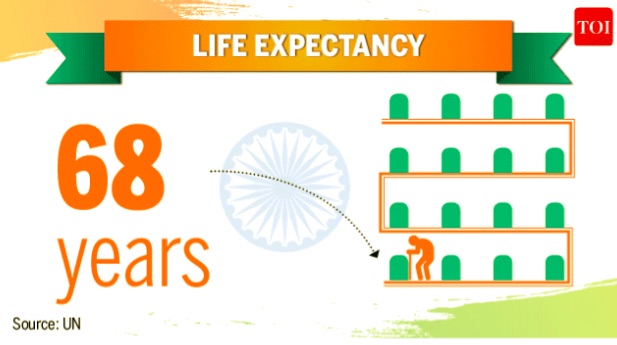
See graphic: Life expectancy, as in August 2017
2012-16: 68.7 years
Sushmi Dey, Nov 1, 2019: The Times of India
Life expectancy rises to 68.7 years
Life expectancy in India has increased from 49.7 years in 1970-75 to 68.7 years in 2012-16, as per the National Health Profile, 2019. For the same period, the life expectancy for females is 70.2 years and 67.4 years for males. For comparison, in last year’s survey, the life expectancy had increased from 49.7 years in 1970-75 to 68.3 years in 2011-15. For the same period, the life expectancy for females is 70 years and 66.9 years for males. So there has been an increase in life expectancy in general, and also for males. The infant mortality rate has declined (33 per 1,000 live births in 2016), however differentials of rural (37) & urban (23) are still high. IANS
2013-17
State-wise details, 2013-17
Rema Nagarajan, Sep 4, 2019: The Times of India
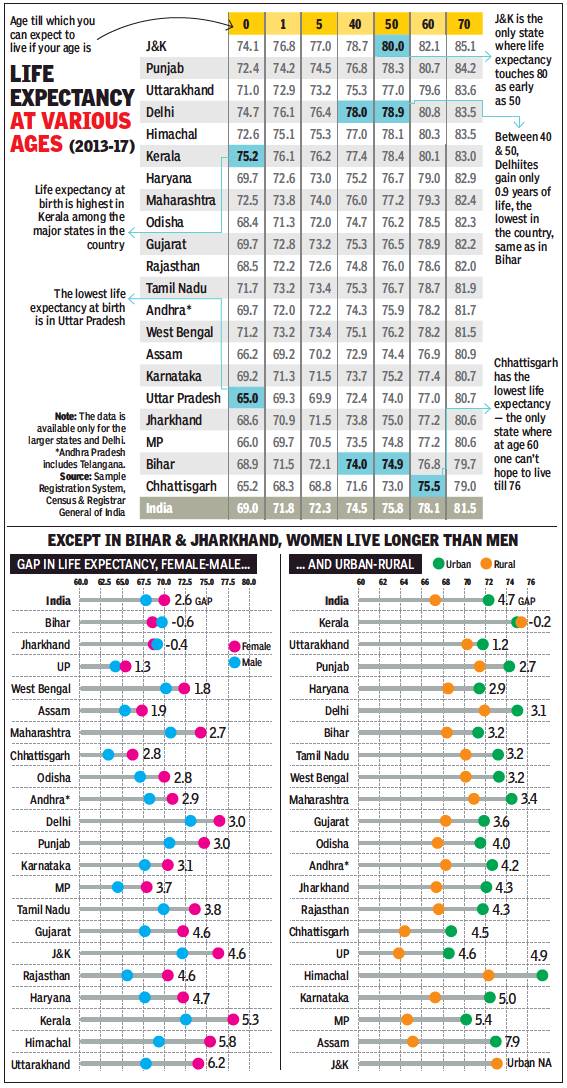
From: Rema Nagarajan, Sep 4, 2019: The Times of India
A child that survives to the age of 1 can expect to live longer in Jammu & Kashmir than in any other state of India. Data just released by the Census and Registrar General’s office also shows that Bihar and Jharkhand remain the only states in India where males outlive females on average while Kerala is the only state in which village folk outlive their urban counterparts.
The life expectancy at birth for India has gone up from 49.7 in 1970-75 to 69 years in 2013-17, registering an increase of 19.3 years in the last four decades. Though life expectancy for males was higher at birth than for females half a century ago, that trend has been reversed since 1981-85 and India is now in line with global patterns in this respect. In 2013-17, female life expectancy was 70.4 years compared with 67.8 years for males.
While life expectancy in India has risen, it remains lower than in Bangladesh (72.8 in 2017), Nepal (70.6), Sri Lanka (75.5) or China (76.4) in the neighbourhood, though better than Pakistan’s 66.6, according to the UN’s Human Development Report.
In 2013-17, UP had the lowest life expectancy at birth of 65 years and Kerala the highest at 75.2 years. Data released by the Sample Registration System (SRS) conducted by the Census and Registrar General’s office showed that a child that survived the first year had the lowest life expectancy in Chhattisgarh, followed by Assam, Uttar Pradesh and Madhya Pradesh in that order (see graphic).
How long a person can expect to live on average doesn’t seem to change very much from 10 years of age to 40 years, with an addition of just two more years to life expectancy at 40 years over that at 10 years. However, those surviving to 60 years could expect to live till 78 years and those who touch 70 years can expect to live till 81.5 years.
These are average life expectancy figures for India, but the numbers vary quite widely across states. Life expectancy at 70 years is the highest in Jammu and Kashmir at 85 years followed by Punjab with 84.2 years. At the other end of the spectrum, the average person who has turned 70 in Chhattisgarh can expect to live only another 9 years, that is till the age of 79.
The data shows that women in Uttarakhand and Himachal Pradesh could expect to live almost six years more than men, while Kerala women lived 5.3 years more than men.
Kerala recorded the highest life expectancy at birth for males and females in rural areas whereas Himachal recorded the highest for both males and females in urban areas. The lowest life expectancy at birth was recorded in MP for rural males (62.6) and Uttar Pradesh for rural women (64.7). In urban areas, the lowest life expectancy at birth was in Chhattisgarh and UP for males (67.1) and females (68.9) respectively.
2015-19
Sources:
Rema Nagarajan, June 13, 2022: The Times of India
Rema Nagarajan, June 13, 2022: The Times of India
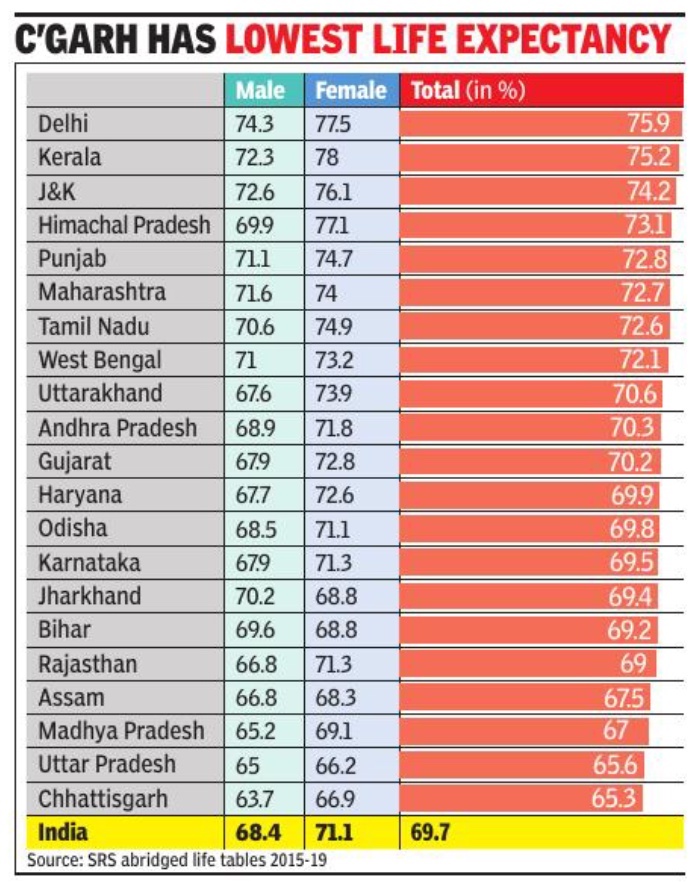
From: Rema Nagarajan, June 13, 2022: The Times of India
India’s life expectancy at birth inched up to 69. 7 in the 2015-19 period, well below the estimated global average life expectancy of 72. 6 years. It has taken almost ten years to add two years to life expectancy. A look at life expectancy at age one and at age five in this period suggests high infant and under-five mortality could be the reason India finds it difficult to raise life expectancy at birth faster.
Data in the recently released “abridged life tables” 2015-19 of the sample registration system (SRS) shows that the gap between life expectancy at birth and life expectancy at age one or age five is the biggest in states with the highest infant mortality (IMR), Madhya Pradesh and Uttar Pradesh. In Uttar Pradesh, with the second highest IMR of 38, life expectancy jumps the highest, by 3. 4 years, on completion of the first year. In MP, with the highest IMR of 43, surviving the first year after birth raises life expectancy by 2. 7 years.
India’s life expectancy at birth inched up to 69. 7 in the 2015-19 period. However, the gap between life expectancy at birth and life expectancy at age one or age five is the biggest in states with the highest infant mortality (IMR), Madhya Pradesh and Uttar Pradesh. Such huge gaps in how long the average person can expect to live at birth and at one year is evident in several states, including Rajasthan, Chhattisgarh, Gujarat, Assam and Odisha.
Over a 45-year period, India had added about 20 years to its life expectancy at birth from 49. 7 in 1970-75 to 69. 7 by 2015-19. Odisha has had the highest increase, of over 24 years, from 45. 7 to 69. 8 years followed by Tamil Nadu, where it increased from 49. 6 to 72. 6. Uttar Pradesh had the second lowest life expectancy of 65. 6 in 2015-19, after Chhattisgarh with just 65. 3.
However, from having the lowest life expectancy in India of just 43 years in 1970-75, it has increased by 22. 6 years in Uttar Pradesh.
Within India, there are huge variations across states and between urban and rural areas. Urban women in Himachal Pradesh had the highest life expectancy at birth of 82. 3 years while at the other end, rural men in Chhattisgarh had the lowest, just 62. 8 years, a gap of 15. 8 years. In Assam, the gap in life expectancy between rural and urban areas is almost eight years. The state with the next highest urban-rural gap of five years was Himachal Pradesh. Kerala is the only state where rural life expectancy was higher than urban life expectancy for both men and women, while in Uttarakhand that was the case among women.
Worryingly, in Uttarakhand life expectancy at birth has reduced in the recent past. After touching 71. 7 in 2010-14, it was down to 70. 6 by 2015-19 showing a steady downward trend in the intervening period. Bihar and Jharkhand remained the only states where male life expectancy was higher than for women in both urban and rural areas.
In the neighbourhood, Bangladesh and Nepal, which had lower IMRs than India (24 compared to 28), now have higher life expectancy at birth of 72. 1 and 70. 5 respectively, according to the UN’s Human Development Report, 2019. Japan has the highest life expectancy of 85. Norway, Australia, Switzerland and Iceland had a life expectancy of 83. The Central African Republic had the lowest life expectancy of 54 followed by Lesotho and Chad at 55 in 2020.
1970-2020
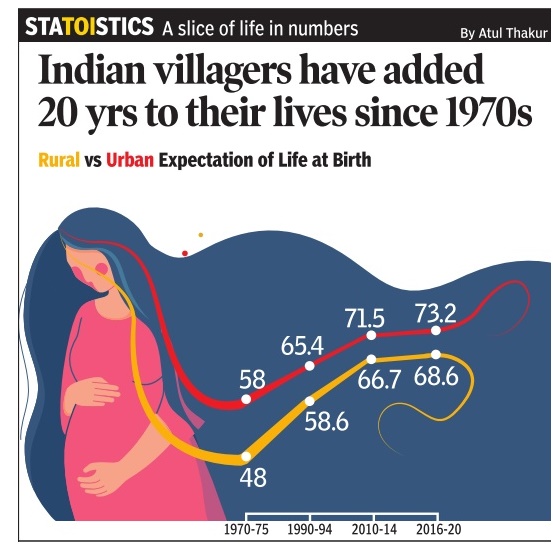
From: June 21, 2024: The Times of India
See graphic:
Life expectancy at birth in India, 1970-2020, rural vis-à-vis urban
Life expectancy, gender--wise
1990-2021
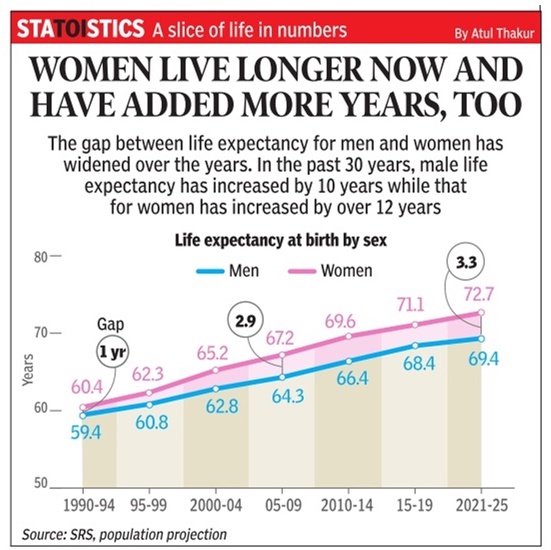
From: August 24, 2024: The Times of India
See graphic:
Life expectancy, in India gender—wise, 1990-2021
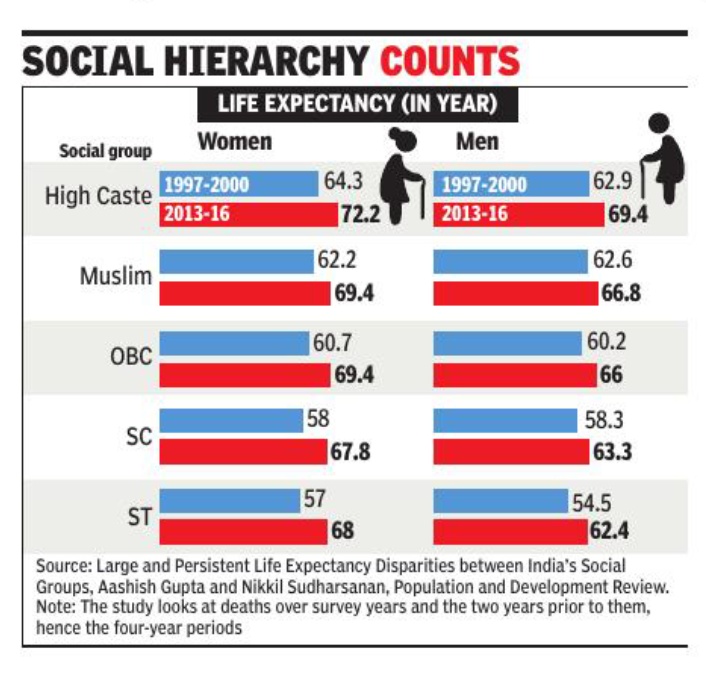
Life expectancy, caste-, religion--wise
1997-2016
Rema Nagarajan, April 23, 2022: The Times of India
From: Rema Nagarajan, April 23, 2022: The Times of India
How long Indians live on average depends on the hierarchy of the social groups they belong to with upper castes living about four to six years more than women and men from the scheduled castes and scheduled tribes. This holds across regions, income levels and time. While life expectancy across all social groups has improved significantly, the gap between them persists and in some cases even worsened between 1997-2000 and 2013-16.
The gap in life expectancy between upper castes and scheduled caste men, for instance, increased from 4. 6 years to 6. 1 years. The gap between upper caste men and Muslim men worsened more sharply, going from just 0. 3 years to 2. 6 years and that between upper caste and Muslim women from 2. 1 to 2. 8 years in this period. This was revealed in a study analysing detailed data from the second and fourth round of the National Family Health Survey (NFHS). The study was published in the journal Population and Development Review.
In general, the gaps in life expectancy between lower caste groups and upper castes have reduced marginally among women. But among men, it has worsened for scheduled castes, Muslims and OBC men compared to upper castes. While the gap reduced for scheduled tribe men from 8. 4 years, it remains wide at seven years.
The study also showed that the gaps persist whether we look at life expectancy at birth or at later stages in life. Another study by one of the researchers with some others showed that they also hold when we look at members of social groups within the same wealth levels. What this means is that the gaps are not solely due to higher infant and child mortality among disadvantaged groups and nor can they be put down simply to economic factors.
Contrary to the belief that life expectancy is driven by child mortality, the study showed that significant differences in mortality persists between social groups at age 15 and even 60. It also showed that the contribution of mortality differences in adult ages increased between 1997–2000 and 2013–2016. By 2013– 2016, 1. 7 years of life expectancy deficits for SC women and 2. 5 years for SC men came from ages 60+, compared to just 1. 5 for women and 1. 2 years for men from the 0-5 age group.
“This pattern is similar for differences between STs and high castes. These trends reveal a decline in the importance of disparities at the younger ages and the growing importance of disparities at older, adult ages,” observed the authors of the study adding that it underscored the need to examine differences beyond the childhood ages. The Hindi belt including Rajasthan, Uttar Pradesh, Uttarakhand, Bihar, Jharkhand, Madhya Pradesh and Chhattisgarh — which accounts for about 44% of India’s population — has the lowest life expectancy for all social groups. The differences in life expectancy between social groups holds here and across almost all regions. The Northeast is the only region where scheduled tribes, who have a higher social status in the region, have higher life expectancy than upper castes.
In the hierarchy of social groups, Muslims fitted in just below the upper castes in life expectancy in 1997-00. However, by 2013-16, the gap had widened significantly. The 1997-00 pattern is what is known in academic circles as the “Muslim mortality paradox” — a socially disadvantaged group having lower infant mortality levels than even upper castes — attributed to, among other things, better sanitation due to a lower prevalence of open defecation. The paper says further study is needed to understand why this has changed.
“Social differences in longevity in India are exceptionally large in the context of global health disparities. The salience of the mortality disparities we document is heightened when considering that the combined population size of any two of these three marginalised social groups is as large as the population of the US,” noted the authors.
Life expectancy, state-wise
1990-2016
Bindu Shajan Perappadan, Indians add more years to their lives, November 15, 2017: The Hindu
See graphic:
Life expectancy at birth, 1990-2016, state-wise

From: Bindu Shajan Perappadan, Indians add more years to their lives, November 15, 2017: The Hindu
But new report on disease burden maps severe inequalities among States
A first-of-its kind report on the ‘India State-Level Disease Burden,’ has revealed severe inequalities in the disease burden in different States.
For instance, life expectancy at birth in the country improved significantly during 1990 to 2016 — from 59.7 years and 58.3 years for females and males respectively in 1990 to 70.3 years for females and 66.9 years for males in 2016.
But in a measure of the continuing inequalities, the life expectancy for females in Uttar Pradesh was 66.8 years — below the national average and 12 years less than in Kerala, where it was 78.7 years.
Again, men in Kerala enjoyed a life expectancy of 73.8 years, but the corresponding figure for men in Assam was 63.6 years.
The study found that while under-5 mortality was improving in every State, there was a four-fold difference in the rate of improvement among States, which again indicated health inequalities.
“The per person burden from many of the leading infectious and non-communicable diseases varies 5-10 times between different States and malnutrition continues to be the single largest risk for health loss in India, which is higher among females and is particularly severe in the empowered action group States [Bihar, Jharkhand, Madhya Pradesh, Chhattisgarh, Odisha, Rajasthan, Uttar Pradesh and Uttarakhand] and Assam,” noted the report.
The report was prepared under the India State-level Disease Burden Initiative, a joint project between the Indian Council of Medical Research (ICMR), the Public Health Foundation of India (PHFI), and the Institute for Health Metrics and Evaluation (IHME), in collaboration with the Ministry of Health and Family Welfare. The report’s findings were published in the journal Lancet
2011-15: Life expectancy at birth and after 60 years
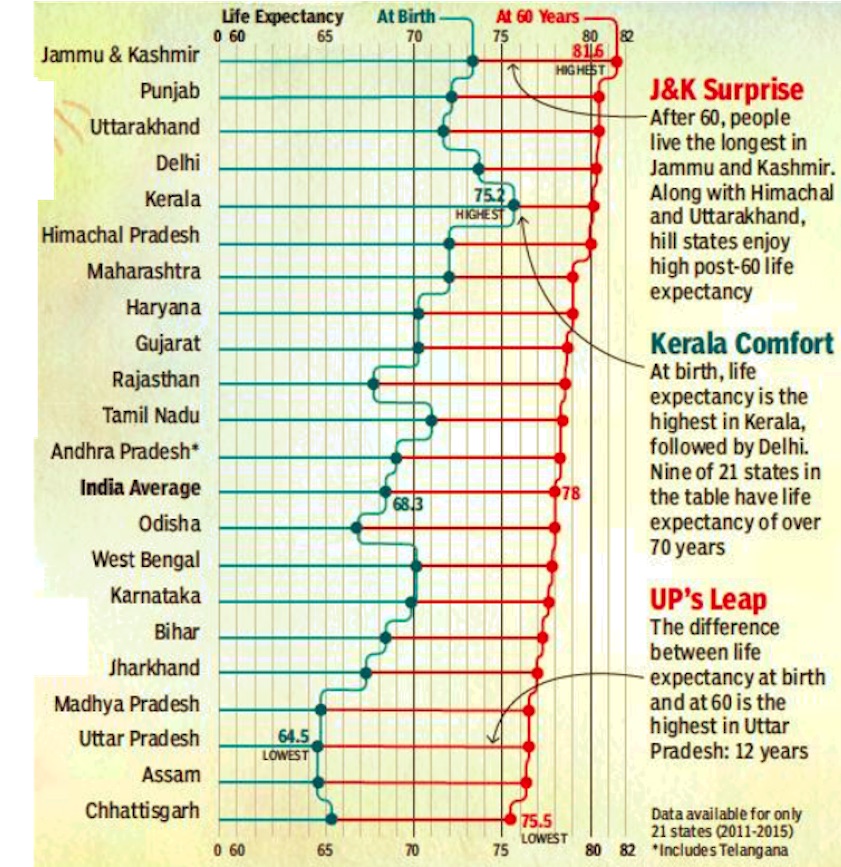
i) at birth, and
ii) after 60 years.
From: February 3, 2018: The Times of India
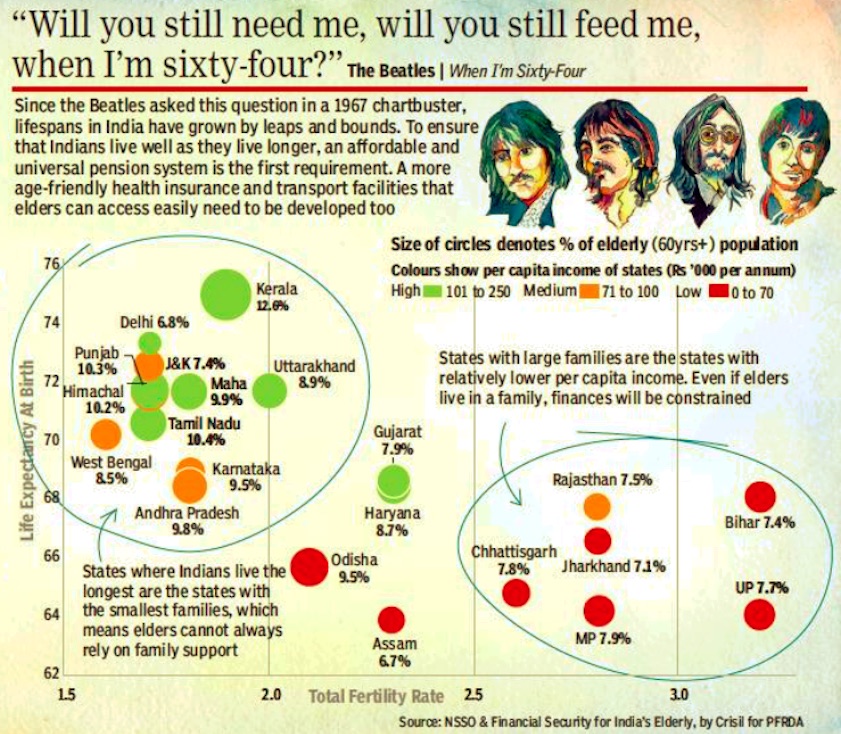
i) total fertility rate, and ii) size of family
From: February 3, 2018: The Times of India
See graphics:
1) Life expectancy in 2011-15
i) at birth, and
ii) after 60 years.
2) Correlation between life expectancy in (2011-15) and
i) total fertility rate, and ii) size of family
2023: The best and worst states
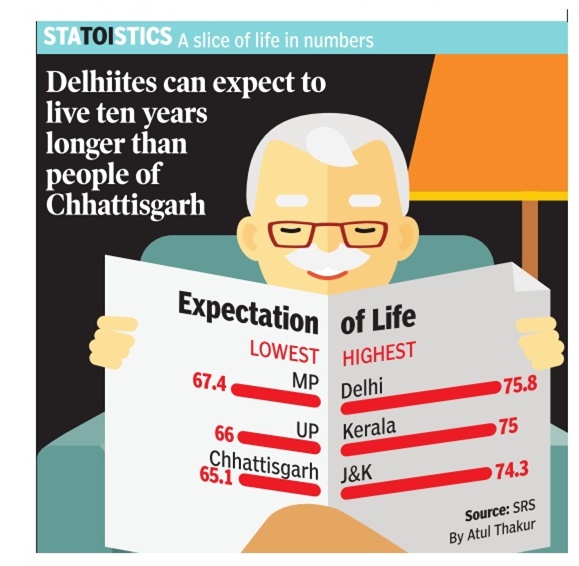
From: June 30, 2024: The Times of India
See graphic:
Indian states with the highest and lowest life expectancy in India, presumably as in 2022 or 2023
2024: the best and the worst

From: May 13, 2025: The Times of India
See graphic:
Indian states with the highest and lowest life expectancy in India, presumably as in 2024
Life Expectancy at birth, after 60
2010-14, state-wise
Subodh Varma, J&K tops post-60 life expectancy list, Oct 27 2016 : The Times of India
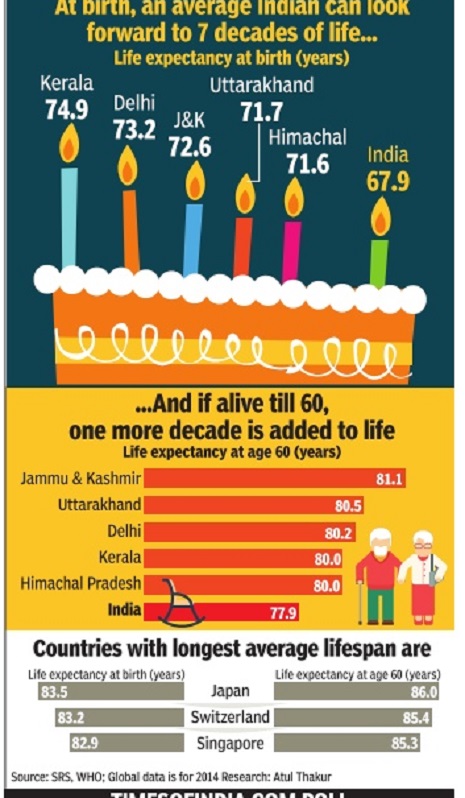
i) The actual number of years that the average resident of the 5 best states lived after 60, presumably in the same 2010-14 period, and
ii) Life expectancy in the 5 best countries in 2014.
The Times of India
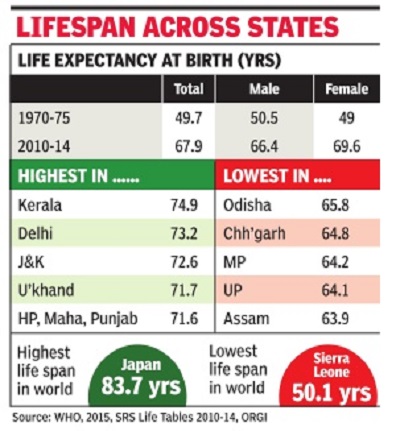
How long will an Indian live after 60? It de pends on which state you live in. Post-60 life expectancy is highest in a state you would least expect -J&K. People of this state who are 60 years old will live for another 21.1 years on an average. At the other extreme is Chhattisgarh, where such life span is 15.6 years.On an average, in India, a man will live for another 17 years and a woman for 19 years after turning 60.
These facets of life and death across all states, and over the years, emerge from recently released `Life Tables' whi ch showcase yearly mortality data collected from a sample of about 7.4 million people across the country. This work is done by the Sample Registration System (SRS) under the Census office. The most recent data is from 2010-2014. Life expectancy can be calculated at birth or at various points in life. `At birth' calculations average out death rates at all subsequent ages.This is usually said to be life expectancy of people in any country or a state within a country ,“ demographer P M Kulkarni, formerly of JNU, said.
In 1970-75, people's average lifespan in India was just 49.7 years. By 2010-14, it had increased to 67.9 years, an increase of 18.2 years. Another change that has taken place is that women are now living longer than men. Four decades ago, men's average lifespan was 50.5 years compared to 49 years for women. This reversed in the mid-eighties and currently women's life expectancy stands at 69.6, almost three years more than men. Women living longer than men is a global trend attributed to higher death rates in men, being more exposed to health risks. Kerala, with its low infant mortality , higher incomes, higher education levels and better health indicators, has the highest lifespan of 74.9 years among all states. Closely following it are Delhi, J&K, Uttarakhand, Himachal Pradesh, Maharashtra, Punjab. Lowest lifespans are in Assam, followed by UP, MP, Chhattisgarh and Odisha.
Beyond the age of five years, J&K emerges as the state with highest lifespan for every five-year age group except the over 70 years group. According to experts, not too bad poverty levels (15% compared to India's average of about 30%), more equitable land ownership and the temperate climate in Kashmir valley that is less conducive for tropical diseases and pollution may have created conditions for this higher lifespan.
But why is there a difference between J&K's average life expectancy at birth (72.6) and life expectancy at 60 years age (81.1 years)? This is due to higher infant mortality rate, which is in turn dependent on how good are delivery and infant health care services. J&K's infant death rate was 37 per 1000 live births in 2013; the same as Jharkhand and only slightly below the national average of 40. “Once a child survives the first year, and then the first five years, conditions for survival and longer life spans improve considerably ,“ Kulkarni said.
2011: the best and worst states

See graphic :
Life expectancy in the Indian states. The best and worst states in 2011
Rural vis-à-vis urban life expectancy
1970> 2017
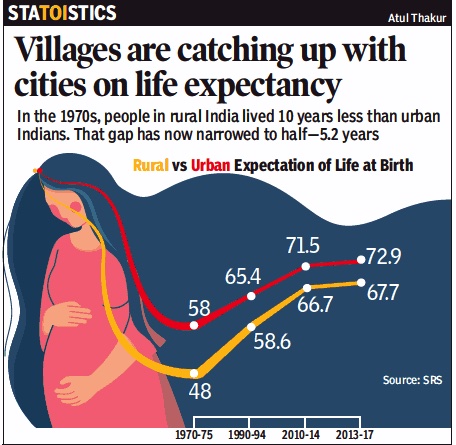
From: March 2, 2020: The Times of India
See graphic:
Rural vis-à-vis urban life expectancy in India, 1970> 2017
1950, 2011
Atul Thakur, July 30, 2020: The Times of India

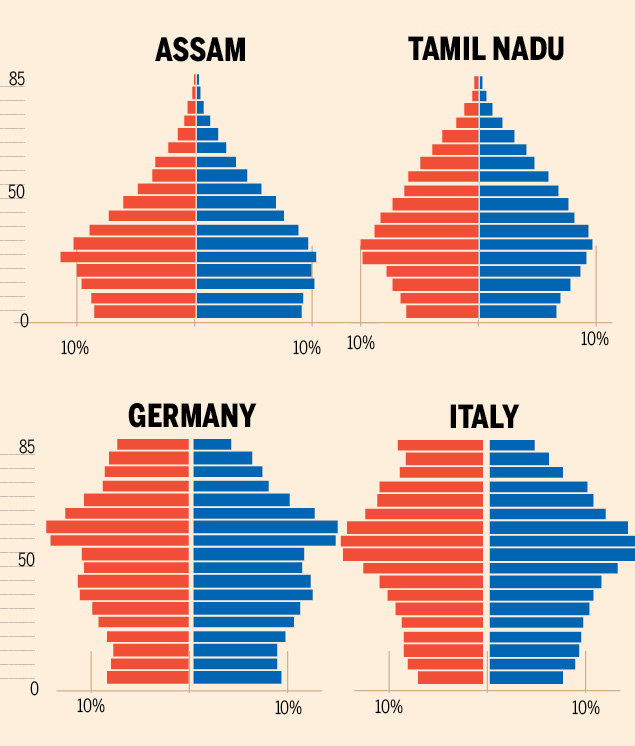
The share of the various age groups in the populations of Kerala vis-à-vis Brazil in 2018.
Red is female and blue is male.
Graphics: Sajeev Kumarapuram; Source: SRS-2018, UN population. Median age projection (Bihar, Kerala) based on 2011 Census
From: Atul Thakur, July 30, 2020: The Times of India

Graphics: Sajeev Kumarapuram; Source: SRS-2018, UN population. Median age projection (Bihar, Kerala) based on 2011 Census
From: Atul Thakur, July 30, 2020: The Times of India
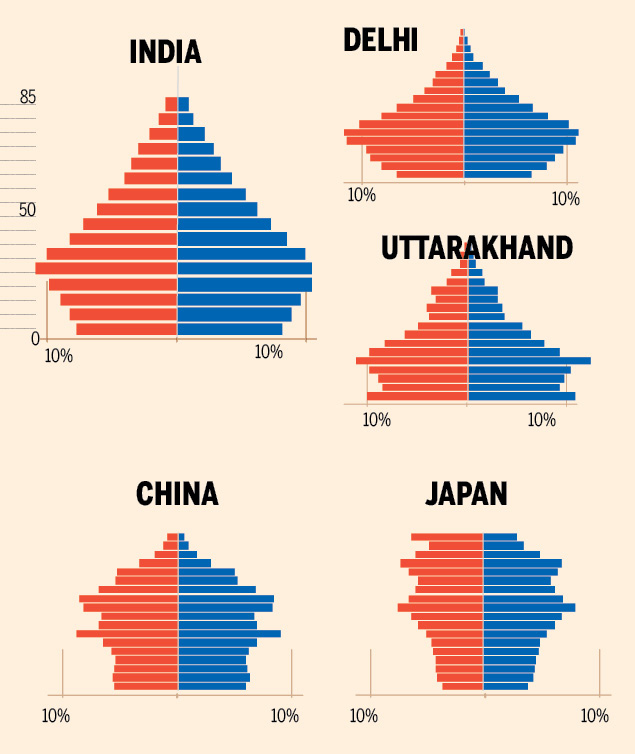
Graphics: Sajeev Kumarapuram; Source: SRS-2018, UN population. Median age projection (Bihar, Kerala) based on 2011 Census
From: Atul Thakur, July 30, 2020: The Times of India
Graphics: Sajeev Kumarapuram; Source: SRS-2018, UN population. Median age projection (Bihar, Kerala) based on 2011 Census
From: Atul Thakur, July 30, 2020: The Times of India

Graphics: Sajeev Kumarapuram; Source: SRS-2018, UN population. Median age projection (Bihar, Kerala) based on 2011 Census
From: Atul Thakur, July 30, 2020: The Times of India
BIHAR IS 13 YEARS YOUNGER THAN KERALA
The population pyramid of a country or state with a high fertility rate tends to be bottom-heavy — that’s because there are more children around. Typically, non-industrialised countries which are largely rural and have large families have pyramids of this shape. Bihar’s pyramid, for instance, resembles Nigeria’s as well as India’s prior to the 1990s. Other states that have similar pyramids are Jharkhand, Madhya Pradesh, Chhattisgarh, Uttar Pradesh, Uttarakhand and Rajasthan. Kerala, Tamil Nadu and Himachal Pradesh, on the other hand, have a lower fertility rate, so you have a pyramid which is not so bottom-heavy.
CLEAR EVIDENCE OF SKEWED SEX RATIO
If Haryana’s population at different age groups is compared with states like Kerala and Chhattisgarh, the state’s skewed sex ratio at the bottom is quite visible. It is just the other way around for a country like Russia, which lost almost 15% of its population (close to 17 million people, most of them men) in World War II. It’s the same story for Italy and Germany, where women outnumber men by a large margin in the older age groups.
MIDDLE BULGE = MAGNET FOR MIGRANTS
A comparison of Delhi’s pyramid (a state that receives migrants) with those of Uttarakhand, Bihar, Jharkhand, Madhya Pradesh and Rajasthan (states that send migrants) shows a bulge in Delhi’s working-age population, while in Uttarakhand the bulge is at the bottom and it thins after the 20-24 age group. If you compare India’s and China’s pyramids, you will see the difference between a country that has just entered the phase of demographic dividend and one that has been in this phase for quite some time. Among the major world economies, India and China have the highest proportion of people in the 15-59 age group. Japan, on the other hand, is a country where the dividend phase has passed and the bulge has moved to the top.
OLDER STATES STILL NOT SO OLD
States like Kerala, Tamil Nadu, Himachal Pradesh, Odisha and Punjab have roughly double the 60-plus population compared with Bihar, Assam, Jharkhand and Chhattisgarh. But compared with countries like Italy and Germany, they are quite young.
100 YEARS OF AGEING: IT WILL BE A DIFFERENT INDIA STORY IN 2050
Since 2010, the bottom of India’s pyramid has started getting narrower. The population bulge will shift to the 20s and 30s age groups in 2030, and then, by 2050, those in their 40s will be the biggest chunk — just as they are in China now.
Trends
Longer life but burdened with illness
The Times of India, Jun 09 2015
Sushmi Dey
Indians live longer, but spend more time with illnesses
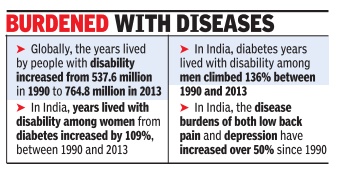
While people across the globe are living longer, they are spending more time recovering from sickness. The reasons are non-fatal illnesses and injuries such as diabetes and hearing loss which pose the next major threat in terms of disease burden, says the latest study by a consortium of international researchers. In India, diabetes and other musculoskeletal disorders have replaced diarrheal diseases and vision problems as leading causes of years lived with disability (YLDs) a measure of overall disease burden, expressed as the number of years lost due to ill-health.
Between 1990 and 2013, years lived with disability among women with diabetes increased by 109%, whereas from other musculoskeletal disorders increased by 110% in India.However, iron-deficiency anemia decreased by 12%.Diabetes YLDs also increased for men in India be tween 1990 and 2013, climbing 136%. Among men, YLDs from chronic obstructive pulmonary disease (COPD) increased by 76%, and iron-deficiency anemia YLDs decreased by 32%.
The study says countries around the world may have made significant progress in addressing fatal diseases, but globally the years lived by people with disability increased from 537.6 million in 1990 to 764.8 million in 2013, for both sexes.
The study was conducted by researchers working on the Global Burden of Disease project and led by the Institute for Health Metrics and Evaluation (IHME) at the University of Washing ton. It was published in The Lancet on June 8.
“With success in delaying death, the years of life lived with ill-health are increasing. For example, this has more than doubled in India for diabetes over the past two decades. Accurate understanding of the causes of ill-health is crucial for planning of appropriate health services,“ Lalit Dandona, study co-author and professor at Public Health Foundation of India said.
Apart from diabetes, migraines, chronic obstructive pulmonary disease (COPD), neck pain, anxiety disorder and hearing loss were among the 10 leading causes of YLDs in 2013.
Women
The Jharkhand exception
2010-2021

From: May 14, 2025: The Times of India
See graphic:
Life expectancy, India, 1950-2023; and Jharkhand, 2010-2021
See also
Life Expectancy: India
