Odisha: castes
This is a collection of articles archived for the excellence of their content. |
Socially and Educationally Backward Classes (SEBCs)
As in 2023/ results of a survey
Anjishnu Das, Oct 9, 2023: The Indian Express

From: Anjishnu Das, Oct 9, 2023: The Indian Express

From: Anjishnu Das, Oct 9, 2023: The Indian Express

From: Anjishnu Das, Oct 9, 2023: The Indian Express

From: Anjishnu Das, Oct 9, 2023: The Indian Express
The findings of a Socially and Educationally Backward Classes (SEBCs) survey carried out by the Odisha State Commission for Backward Classes which have emerged in the public put their population at 39.31% of the state, or 1.95 crore people across 54 lakh households. It also increases the number of SEBC communities from 209 to 231.
The 39.31 per cent share of SEBCs is slightly higher than the EBC strength of 36 per cent of the population in Bihar, as per its recently released caste survey report.
Many in the Opposition and some government officials have questioned the survey’s methodology as the data is based on “voluntary responses” submitted by the public at designation centres or online between May 1 and September 17, and believe their numbers could be higher. In Bihar, enumerators went door-to-door to confirm the data.
Currently, 11.25 per cent of government jobs in Odisha are reserved for SEBCs. There is no reservation for them in education.
Eleven Odisha districts – Ganjam, Puri, Nayagarh, Kendrapada, Jagatsinghpur, Bhadrak, Dhenkanal, Bolangir, Boudh, Subarnapur and Nuapada – have been identified by the survey as “very highly” SEBC-populated.
A look at some key socioeconomic indicators of these 11 districts:
Population
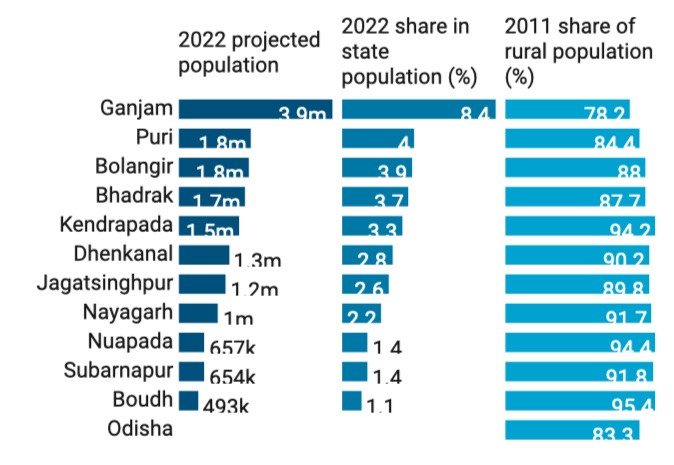
These 11 districts together account for just over one-third of Odisha’s population, as per government projections for the population in 2022.
Ganjam district is the most populous of the 30 districts in the state and is the only one among the 11 SEBC-heavy districts with a smaller rural population than the state average, as per the 2011 Census figures. Nine of these 11 districts also have a larger proportion of Scheduled Caste populations than the state average.
Income and poverty
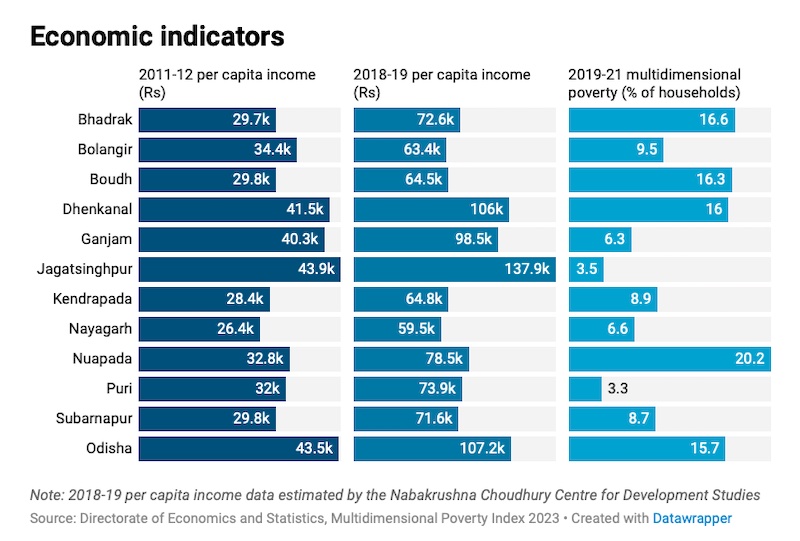
These 11 districts have among the lowest per capita incomes in the state, though Odisha has not published official per capita income figures at the district level since 2011-12.
According to the RBI, Odisha’s annual per capita income (at current prices) stood at Rs 79,607 in 2021-22, higher than only six other states and UTs among regions for which data was available. As per 2011-12 data, only Jagatsinghpur had a higher per capita income than the state average.
According to a 2019 study published by the Nabakrushna Choudhury Centre for Development Studies in Odisha, the state’s per capita income had risen to Rs 1.07 lakh. Again, only Jagatsinghpur exceeded this figure and just one other district, Dhenkanal, crossed the Rs 1-lakh mark.
However, in terms of multidimensional poverty, which measures the exposure to deprivation including lack of access to education, healthcare, housing and other basic infrastructure, these 11 districts do not feature among the worst performers in the state. Nuapada is the only district in which more than 20% of households are considered multidimensionally poor.
Health and nutritional outcomes
Generally, these districts perform well in terms of access to electricity and clean drinking water, but Ganjam is the only district with more than 70% of the population having access to private sanitation facilities connected to a sewage system.
Odisha lags behind on access to health insurance overall, and no district among these 11, barring Puri, has more than 60% of households covered under an insurance or health financing scheme.
Though more than 90% of births in these districts are institutional, public or private, they lag behind on other health indicators like nutritional outcomes for children. In Nuapada, for instance, more than 40% of children under 5 are stunted (low height-for-age), compared to 31% for the state overall. In Bolangir and Subarnapur, one in four children is wasted (low weight-for-height), while in Boudh, nearly 40% of children are underweight (low weight-for-age).
Education
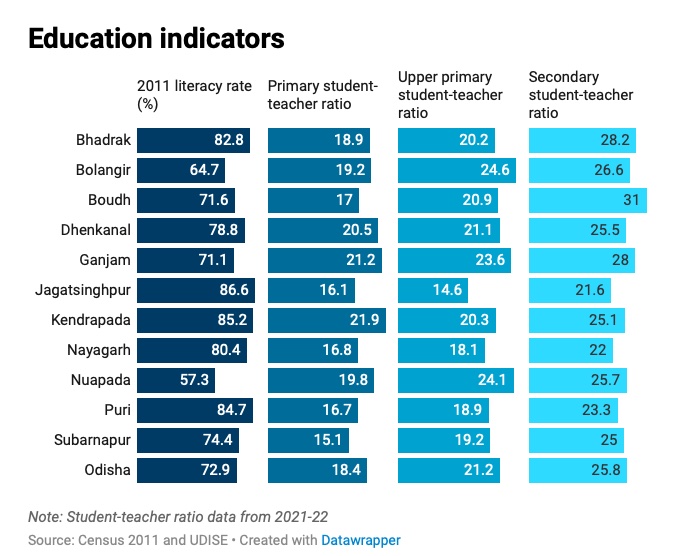
Odisha has about 135 schools, public and private, for every lakh population and though most of these 11 districts have a greater density of schools, about half have higher dropout rates than the state average.
In terms of student-teacher ratios, six of these districts are higher than the state average for primary schools. For upper primary and secondary schools, however, a majority of these districts have better student-teacher ratios.