Per capita Income: India and its states
This is a collection of articles archived for the excellence of their content. |
Contents |
India and the world
AD 1600: India richer than France, UK, China, Germany, Japan

From: June 19, 2018: The Times of India
See graphic:
In 1600AD, India was richer than British and Americans
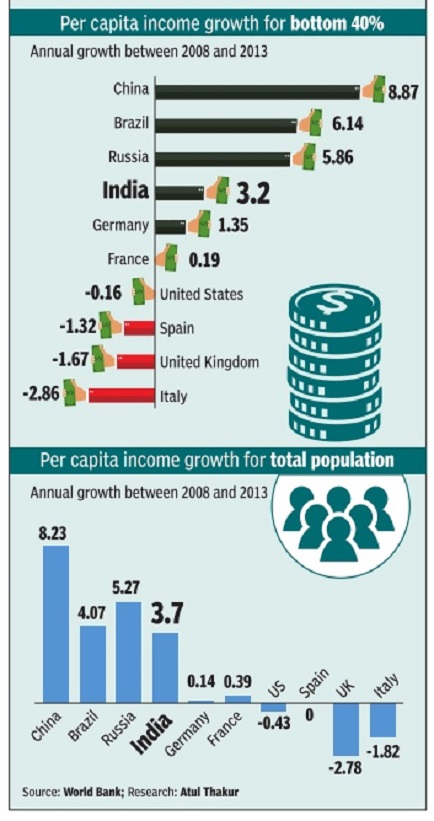
2008-13: Vis-à-vis Brazil, China, Russia
CHINA'S POOREST GETTING RICHER 3 TIMES FASTER THAN INDIA'S POOREST Oct 07 2016 : The Times of India
India's economy might be growing at a faster rate than many developed nations, but at per capita level, its growth rate of income is the lowest among emerging economies. A recent report by the World Bank shows that between 2008 and 2013, per capita income in China grew at 8.23% for overall population and 8.87% for the poorest 40%. India, however, not only witnessed a slower overall growth in comparison, but also a 2.7 times slower growth among the bottom 40%, indicating slugging closing of the inequality gap.
2016, India’s poorest 40% vis-à-vis other countries
With an average daily income of Rs 30 per day, India's bottom 40% in income terms is among the poorest in the world. Comparably, the poorest 40% in Norway earn the equivalent of Rs 652 per day. Even lower than India at the poorest level is the segment in Democratic Republic of Congo, with an average daily income equivalent to Rs 10
Fertility rates and the per capita income, 1960- 2020

From: February 2, 2020: The Times of India
See graphic:
Fertility rates and the per capita income in India, its states and other countries, 1960- 2020
The ranks of the states
1960- 2021
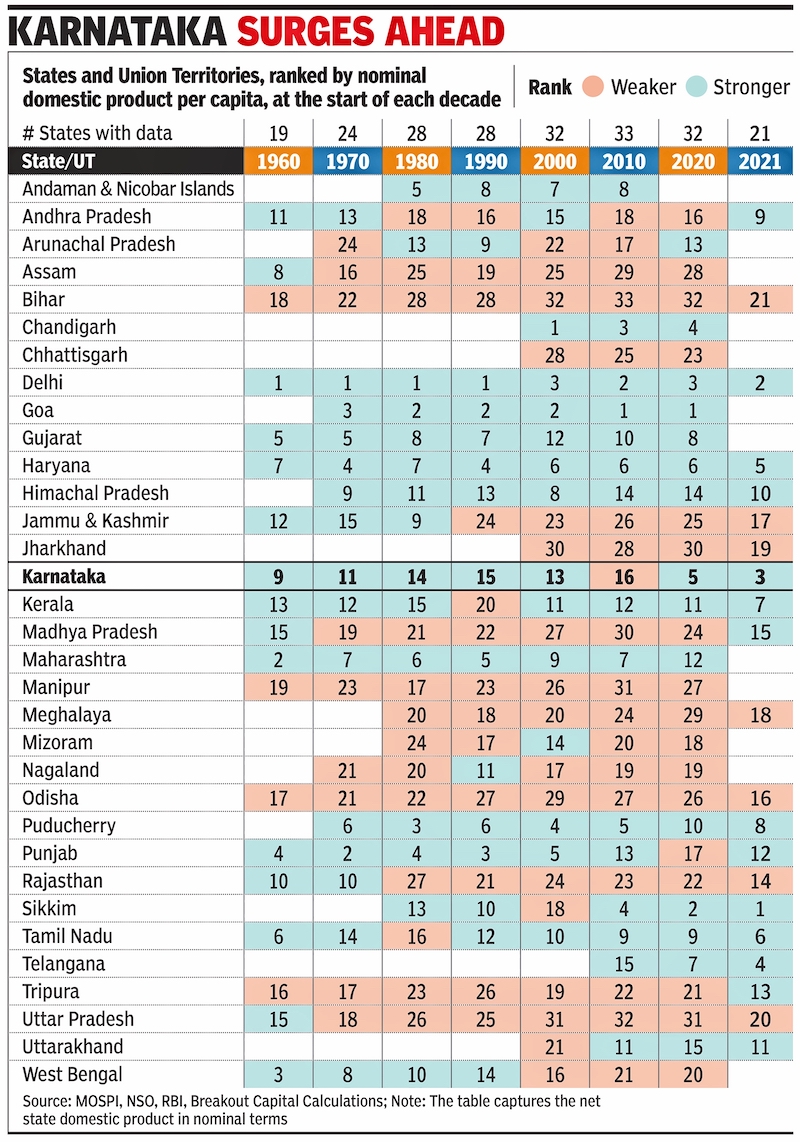
From: Ruchir Sharma, May 9, 2023: The Times of India
See graphic:
The ranks of the states and union territories of India in terms of per capita income, 1960- 2021.
Trends, region-wise
2017-18
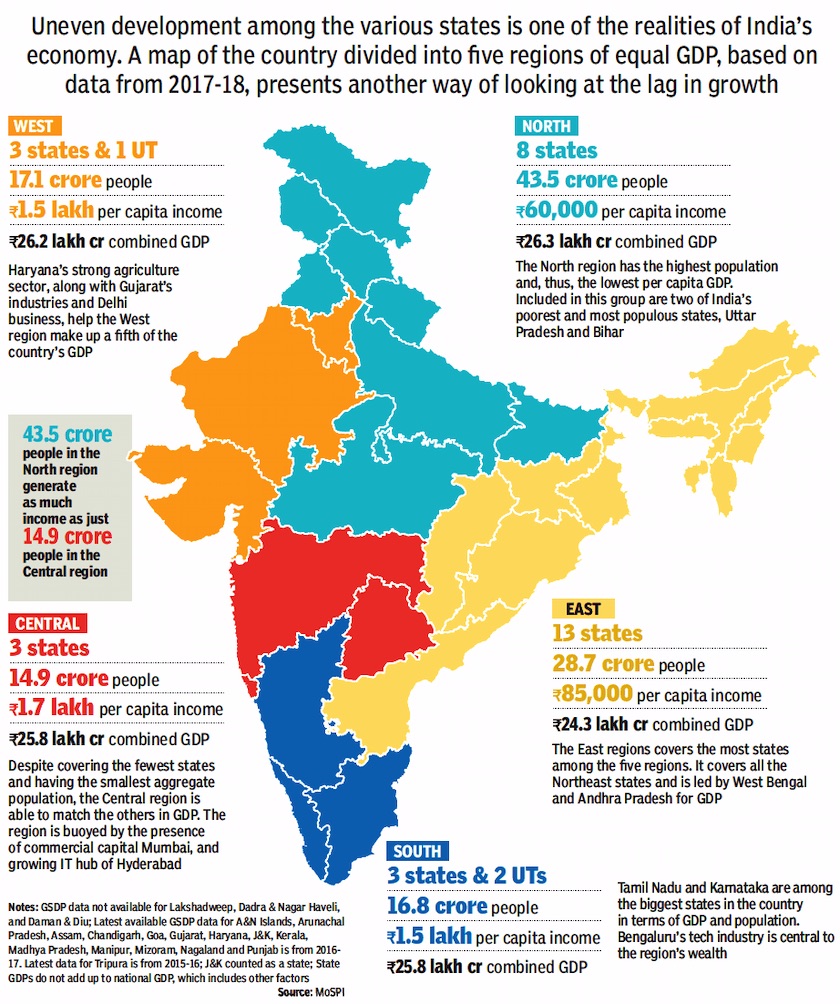
See graphic:
The Per capita Incomes of the Indian regions, 2017-18
Trends, state-wise
Per Capita Income: Delhi
Per capita income up, and highest
December 17, 2014
The per capita annual income in the capital has increased to Rs 2.19 lakh in 2013-14 as compared to Rs 1.92 lakh in 2012-13, which is the highest among the major states.
The per capita income of people in Delhi at current prices without factoring in inflation has been estimated at Rs 2,19,979 which is a rise of Rs 27,392 from Rs 1,92,587 in 201112, according to Delhi government statistics.
According to report, there were around 39.54 lakhs domestic electricity consumers during 2013-14. The total consumers are 48.97 lakhs.
As regards water, per capita consumption in the city is 48 gallons per day with 16, 02,099, metered and 4,69,705 un-metered connections. The generation of water was 855 MGD in 2013.
Per capita incomes of states, 2013-15
The Times of India, Apr 20 2017
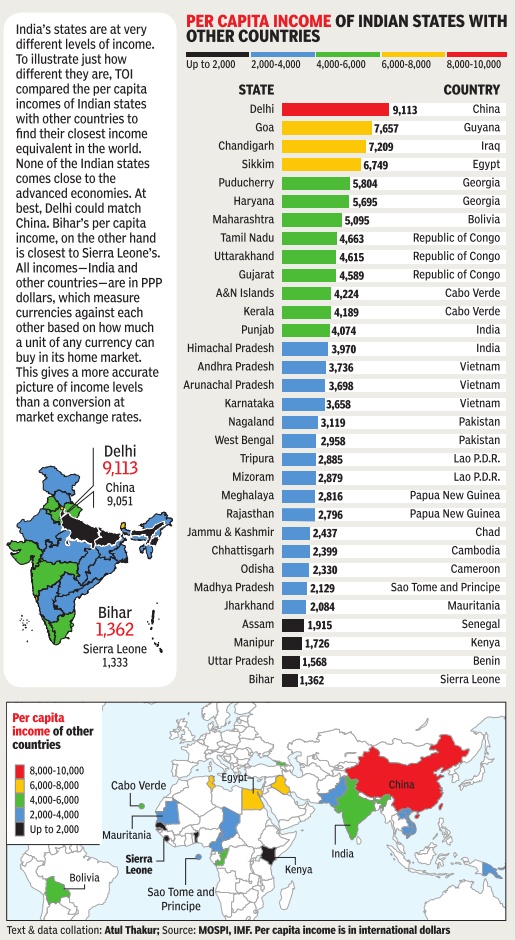
See graphic.: The per capita income of Indian states compared with countries at the same level, 2013-15
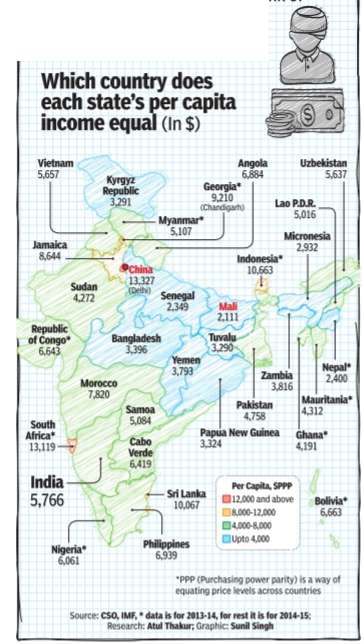
Using the yardstick of per capita income to compare the quality of life in Indian states with life in other countries, it is fairly clear that a significant chunk of the Indian states can be placed alongside some of the poorest nations of the world
Per capita income of Indian states: vis-à-vis other countries/ 2014
INDIA VS BHARAT OR CHINA VS SIERRA LEONE?
STATOISTICS
The Times of India Jul 27 2014
India's states are at very different levels of income.
To illustrate just how different they are, The Times of India compared the per capita incomes of Indian states with other countries to find their closest income equivalent in the world.
None of the Indian states comes close to the advanced economies. At best, Delhi could match China. Bihar's per capita income, on the other hand is closest to Sierra Leone's.
All incomes--India and other countries--are in PPP dollars, which measure currencies against each other based on how much a unit of any currency can buy in its home market.
This gives a more accurate picture of income levels than a conversion at market exchange rates.
Trends, year-wise
1990-2017
June 15, 2019: The Times of India

From: June 15, 2019: The Times of India
Since Liberalisation, India’s income has grown faster than world’s
In 1990, a year before Liberalisation, the average citizen of the world earned five times more than the average Indian. The period of steady growth that followed has made India one of the largest economies. Although it is still poor in per capita terms, the gap with global income levels has considerably narrowed. Today, the average Indian earns about half as much as the average world citizen.
1993-2019

From: February 2, 2021: The Times of India
See graphic:
Indian states’ per capita income growth, 1993-2019
2008-13

From: January 28, 2019: The Hindu
See graphic:
Per Capita Income growth of states and their growth, FY08, FY09-FY13
2008-18, difference of a state's PCI with national average

From: January 28, 2019: The Hindu
See graphic:
Table shows the difference of a state's PCI with national average- 2008-18
2013-18

From: January 28, 2019: The Hindu
See graphic:
Per Capita Income growth of states and their growth, FY13, FY14-FY18
2013-19
Income growth set to touch double digits, January 10, 2019: The Times of India
From: Income growth set to touch double digits, January 10, 2019: The Times of India
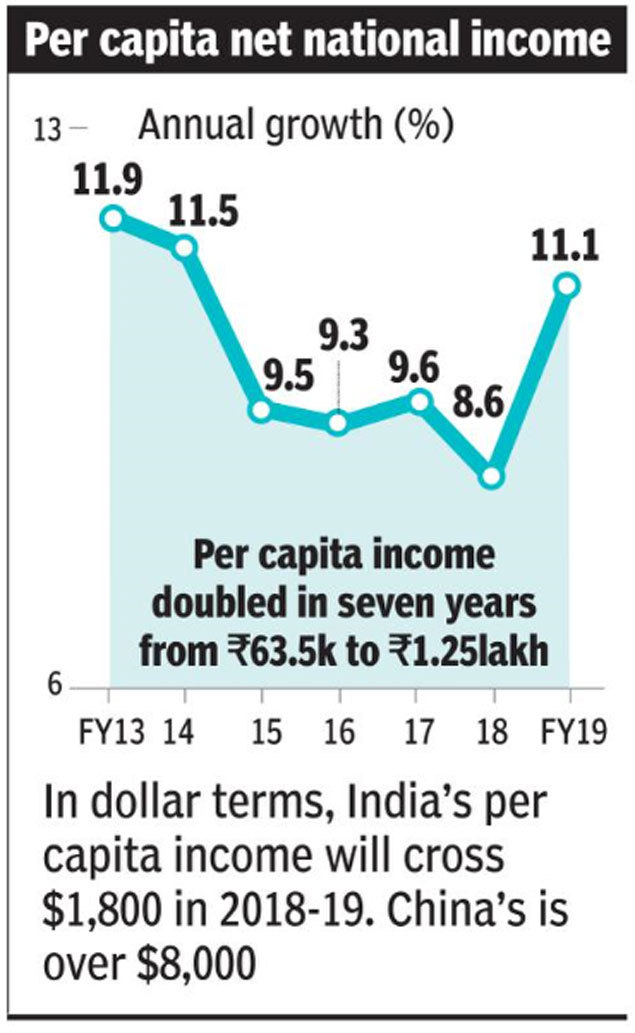
Per capita net national income in the country is set to expand at the fastest pace in five years in 2018-19, according to the first advance estimate of GDP unveiled by the government.
The data showed that per capita net national income is estimated to grow by 11.1% to Rs 1,25,397 in 2018-19 at current prices, faster than the 8.6% growth rate notched up in the previous year. At 2011-12 prices, it is expected to be at Rs 91,921, displaying a growth of 6.1% compared to the previous year.
Economists attributed the increase to a string of factors, including low inflation, expectations of a pick-up in overall growth as well as an increase in remittances. But they said the divergence in per capita among states was an issue that deserves attention. They also cautioned that since the estimates are provisional, it could also be revised downwards. In fiscal year 2013-14, the growth rate in net national income was 11.5% and in high growth years such as 2010-11 and 2011-12, the growth rate was 13.8% and 18.2% respectively. Economists also cautioned about drawing any concrete conclusions from the data.
“The good news is that the five year CAGR (FY15 to FY19) of nominal per capita income is 9.7%. However, the not so good news is the divergence in per capita income across states,” said Soumya Kanti Ghosh, group chief economic adviser at SBI.
Citing data for 18 states up to fiscal year 2017-18, he said seven states were above the national average and 11 below the national average. “Real per capita income CAGR grew by 6% during FY14 to FY18. States need to push policies in accordance with the emerging demographic dividends,” said Ghosh.
Some other economists said that sustained efforts are needed to catch up with the rest of the world in terms of per capita income, which is a measure of prosperity.
2016-17, per capita Y to cross Rs.1 lakh
India's FY17 per capita income to cross Rs 1 lakh, Jan 07 2017: The Times of India
India's per capita income, a gauge for measuring living standard, is estimated to cross Rs 1 lakh in 2016-17, up from Rs 93,293 in 2015-16.
According to the Central Statistics Office (CSO), the per capita net national income during 2016-17 is “estimated to be Rs 103,007“ at current prices.This is higher by 10.4% compared to Rs 93,293 during 2015-16.
“The per capita income in real terms (at 2011-12 prices) during 2016-17 is likely to be Rs 81,805 as compared to Rs 77,435 for the year 2015-16,“ the estimates said.
At constant prices, the growth rate in per capita income is estimated at 5.6% during 2016-17, as against 6.2% in the previous year. The CSO said India's GDP is expected to slow down to 7.1% during 2016-17 from 7.6% in the previous fiscal mainly due to slump in manufacturing, mining and construction activities. The CSO did not figure in the impact of demonetisation, effected on November 9 and the estimates are based on sectoral data available till October.
The CSO projections on national income are in line with the RBI's estimates, which too had lowered the GDP growth prospects to 7.1%.
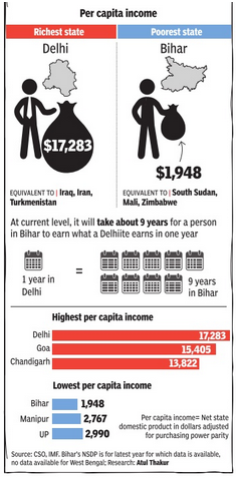
The 3 richest, 3 poorest states
Indpaedia’s note: A Delhiite earns in a year what a Bihari does in 6.6 years (not nine), actually, going by figures from the same chart.
TWO STATES: THE GREAT INDIA DIVIDE I
Economic disparities in India are wide and deep. We will explore different facets of it, starting with per capita income. Measured in purchasing power parity terms, Delhi's per capita Net State Domestic Product (NSDP) is higher than countries like Brazil, China and South Africa. Bihar, in contrast, has the lower income level of the poorest African countries like Kenya, Cameroon, Tanzania and Senegal
2011-2025
Atul Thakur, August 28, 2025: The Times of India

From: Atul Thakur, August 28, 2025: The Times of India
Confirming Delhi’s place among the richest states/UTs in the country, a recently released report says the capital’s per capita income is now Rs 4.93 lakh, placing it at No. 2 spot ahead of Goa although the latest data from the coastal state is not available.
Even if Goa retains its second position after data updation, the national capital will remain among India’s top three states/UTs. Both Goa and the No.1 state, Sikkim, have a much smaller population than Delhi. Other industrialised states such as Karnataka, Tamil Nadu and Maharashtra are much lower in the list.
In absolute GDP, Delhi ranks 11th in India. Its economy is much larger than that of Kerala, Haryana, Bihar, Odisha, Punjab and Assam.
Delhi’s high income is largely linked to two factors: its skewed share in population and economic activities, and its economy being services-based like advanced countries.
Share of agri <;1% in city’s economy
In 2011-12, the national capital’s share was 3.9% of India’s GDP. It rose to 4% in 201314 but has now decreased to 3.7%. Despite being a magnet for migrants from all parts of the country, its share in India’s population has not increased at a rate that one may assume. In 2011-12, Delhi constituted 1.4% of India’s population and today the share is 1.6%, much smaller than its share in GDP.
Apart from this, Delhi’s economy is like the advanced economies of western Europe and America. In 2011-12, the share of agricultural activities or the primary sector was 3.5% in its economy, which has now reduced to less than 1%. The share of manufacturing has largely remained the same at around 13% while the share of services has increased from 83.4% to 86.6%.
2013> 2024
State-Wise List Of Indian States And Their Per Capita Income:
| Serial No | State/UT | 2013-14 (Rs ) | 2014-15 (Rs) | 2023-24 (Rs) | 2024-25 (Rs) | Change in 2023-24 over 2013-14 (per cent) | Change in 2024-25 over 2014-15 (per cent) |
|---|---|---|---|---|---|---|---|
| 1 | Andhra Pradesh | 72254 | 79174 | 131083 | 141609 | 81.4 | 78.9 |
| 2 | Arunachal Pradesh | 79004 | 91034 | 111107 | NA | 40.6 | - |
| 3 | Assam | 43002 | 44809 | 75938 | 81127 | 76.6 | 81.1 |
| 4 | Bihar | 22776 | 23223 | 32227 | NA | 41.5 | - |
| 5 | Chhattisgarh | 61409 | 61122 | 87681 | 93161 | 42.8 | 52.4 |
| 6 | Goa | 188358 | 241081 | 357611 | NA | 89.9 | - |
| 7 | Gujarat | 102589 | 111370 | 195617 | NA | 90.7 | - |
| 8 | Haryana | 119791 | 125032 | 182816 | 194285 | 52.6 | 55.4 |
| 9 | Himachal Pradesh | 98816 | 105241 | 154330 | 163465 | 56.2 | 55.3 |
| 10 | Jharkhand | 43779 | 48781 | 65062 | NA | 48.6 | - |
| 11 | Karnataka | 101858 | 105697 | 191970 | 204605 | 88.5 | 93.6 |
| 12 | Kerala | 107846 | 112444 | 162040 | NA | 50.3 | - |
| 13 | Madhya Pradesh | 42548 | 44027 | 67301 | 70434 | 58.2 | 60.0 |
| 14 | Maharashtra | 109597 | 115058 | 166013 | 176678 | 51.5 | 53.6 |
| 15 | Manipur | 41441 | 44101 | 65471 | NA | 58.0 | - |
| 16 | Meghalaya | 59729 | 57478 | 74489 | 77412 | 24.7 | 34.7 |
| 17 | Mizoram | 67594 | 85056 | 152363 | NA | 125.4 | - |
| 18 | Nagaland | 58619 | 60372 | 81158 | NA | 38.4 | - |
| 19 | Odisha | 54209 | 54361 | 99396 | 106918 | 83.4 | 96.7 |
| 20 | Punjab | 93238 | 95807 | 129561 | 135356 | 39.0 | 41.3 |
| 21 | Rajasthan | 61053 | 64496 | 90414 | 96638 | 48.1 | 49.8 |
| 22 | Sikkim | 168897 | 180675 | 292339 | NA | 73.1 | - |
| 23 | Tamil Nadu | 102191 | 107117 | 179732 | 196309 | 75.9 | 83.3 |
| 24 | Telangana | 96039 | 101424 | 177000 | 187912 | 84.3 | 85.3 |
| 25 | Tripura | 54645 | 63992 | 97250 | NA | 78.0 | - |
| 26 | Uttar Pradesh | 34044 | 34583 | 50341 | NA | 47.9 | - |
| 27 | Uttarakhand | 112900 | 118979 | 150931 | 158819 | 33.7 | 33.5 |
| 28 | West Bengal | 53811 | 54520 | 77933 | 82781 | 44.8 | 51.8 |
| 29 | Andaman & Nicobar Is. | 98735 | 106711 | 177335 | NA | 79.6 | - |
| 30 | Chandigarh | 180615 | 182867 | 256912 | NA | 42.2 | - |
| 31 | Delhi | 200702 | 213669 | 271490 | NA | 35.3 | - |
| 32 | Jammu & Kashmir UT* | 54783 | 51649 | 76653 | 81774 | 39.9 | 58.3 |
| 33 | Ladakh | NA | NA | NA | NA | - | - |
| 34 | Puducherry | 129127 | 117102 | 145921 | 155533 | 13.0 | 32.8 |
GSDP of Indian states
GSDP of Indian states: vis-à-vis other countries’ states/ 2017
February 2, 2019: The Times of India
From: February 2, 2019: The Times of India
See graphic:
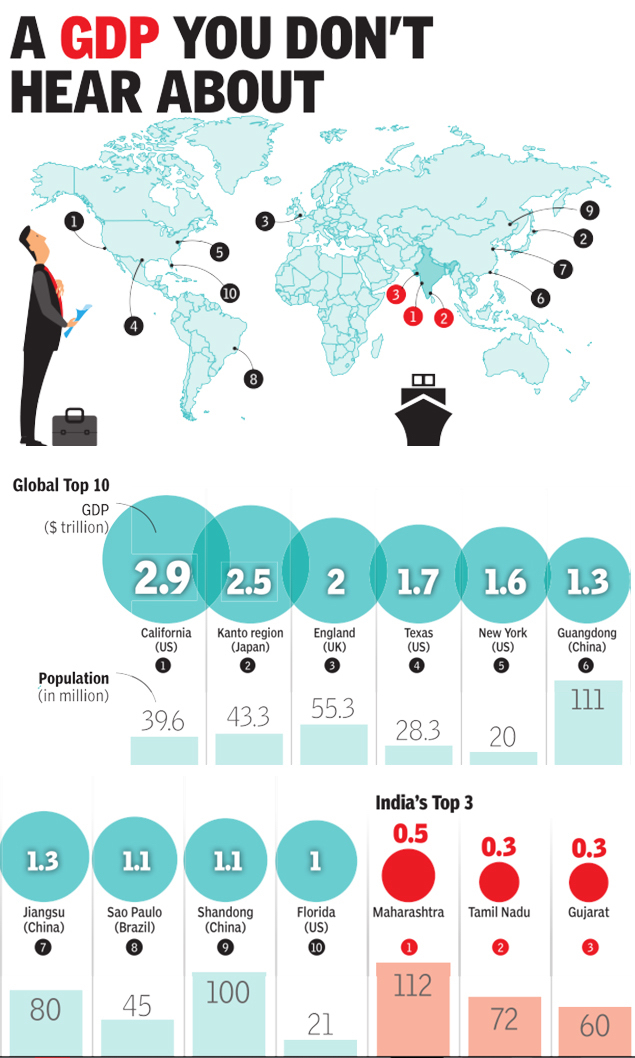
The GSDP of the three top Indian states- vis-à-vis other countries’ states/ cities, presumably as in 2017
In simplest terms, gross domestic product is the value of all goods and services produced in a country in a year. But GDP is also calculated for administrative units smaller than a country - states, districts and cities. A global ranking of world's largest states (or regions) by GDP reveals how large some of the country sub-divisions are
The uneven spread of India’s wealth
Oct 30, 2021: The Times of India
From: Oct 30, 2021: The Times of India

From: Oct 30, 2021: The Times of India

From: Oct 30, 2021: The Times of India

From: Oct 30, 2021: The Times of India

From: Oct 30, 2021: The Times of India

From: Oct 30, 2021: The Times of India
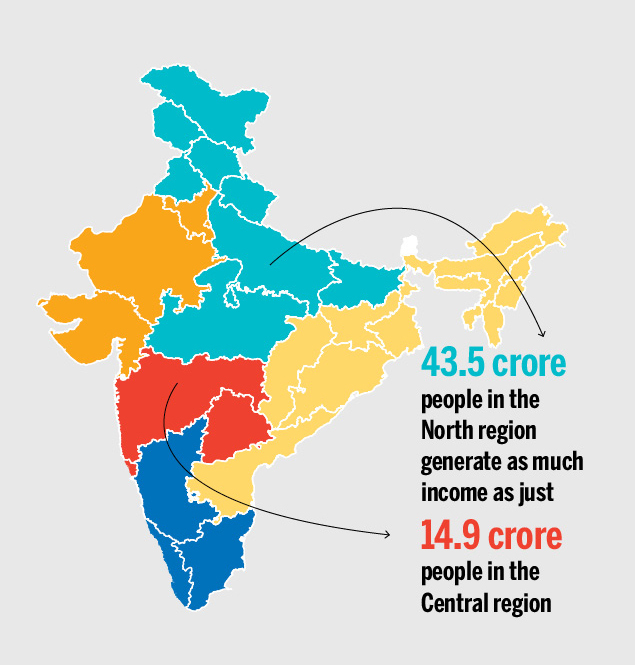
Uneven development among the various states is one of the realities of India’s economy. A map of the country divided into five regions of equal GDP, based on data from 2017-18, presents another way of looking at the lag in growth.
Here's how the regions stack up…
Haryana’s strong agriculture sector, along with Gujarat’s industries and Delhi business, help the West region make up a fifth of the country’s GDP.
The North region has the highest population and, thus, the lowest per capita GDP. Included in this group are two of India’s poorest and most populous states, Uttar Pradesh and Bihar.
Despite covering the fewest states and having the smallest aggregate population, the Central region is able to match the others in GDP. The region is buoyed by the presence of commercial capital Mumbai, and growing IT hub of Hyderabad.
The East region covers the most states among the five regions. It covers all the Northeast states and is led by West Bengal and Andhra Pradesh for GDP.
Tamil Nadu and Karnataka are among the biggest states in the country in terms of GDP and population. Bengaluru’s tech industry is central to the region’s wealth.
See also
Gross domestic product (GDP): India
Per capita Income: India and its states
