Poverty: India
This is a collection of articles archived for the excellence of their content. Readers will be able to edit existing articles and post new articles directly |
Defining poverty

Planning Commission's formula
Plan panel sticks to old formula to define poor
Mahendra Singh, TNN | Jul 24, 2013
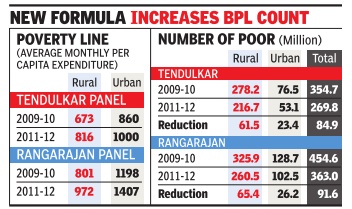
NEW DELHI: People spending more than Rs 27.2 per day in villages and Rs 33.3 in cities are not poor, according to latest data released by the government.
The proportion of the poor has come down to 21.9% of the country's population in 2011-12 from 37.2% in 2004-05, a decline of 2.18 percentage points every year during seven years of UPA rule.
The absolute number of poor declined by nearly 137.4 million between 2004-05 and 2011-12 and by around 85 million between 2009-10 and 2011-12.
However, there are still 269.7 million poor — 217.2 million in villages and 53.1 million in cities — across the country as against 407.3 million in 2004-05.
The percentage of persons below the poverty line in 2011-12 has been estimated at 25.7% in rural areas and 13.7% in urban areas.
The sharp decline in poverty levels across the country is based on the benchmark of a fresh poverty line. But the timing and the methodology for estimating poverty is questionable as the fresh estimates are based on the Tendulkar methodology, which was junked by the Planning Commission last year after a huge public outcry.
The plan panel's earlier figures showed that poverty was declining by 1.5 percentage points from 37.2% to 29.8% between 2004-05 and 2009-10, but the data was disowned after it was criticized for pegging the poverty line too low at Rs 22.42 per person per day in rural areas and Rs 28.65 in urban areas.
After intervention from the UPA's top leadership, the government set up another committee headed by C Rangarajan to look at a methodology for determining poverty lines and estimating poverty.
The commission justified the release of the data using the old methodology saying the data from the National Sample Survey (NSS) 68th round (2011-12) was now available and the Rangarajan committee recommendation will only be available in mid-2014 so it had updated the poverty estimates for the year 2011-12 as per the methodology recommended by the Tendulkar committee.
After the controversy, a special survey was conducted by the NSSO to determine poverty, an exercise which taken up after a gap of five years.
The official argument is that whatever be the poverty line, there will be a decline in poverty in percentage terms.
The commission argued that it is important to note that although the declining trend is based on the Tendulkar poverty line, which is being reviewed and may be revised by the Rangarajan committee, an increase in the poverty line will not alter the fact of a decline. "While the absolute levels of poverty would be higher, the rate of decline would be similar," it said.
Definition of poverty in 2011-12
According to the [Planning] commission, in 2011-12 for rural areas, the national poverty line by using the Tendulkar methodology is estimated at Rs 816 per capita per month in villages and Rs 1,000 per capita per month in cities.
This would mean that the persons whose consumption of goods and services exceed Rs 33.33 in cities and Rs 27.20 per capita per day in villages are [below the poverty line].
The commission said that for a family of five, the all India poverty line in terms of consumption expenditure would amount of Rs 4,080 per month in rural areas and Rs 5,000 per month in urban areas. The poverty line however will vary from state to state.
2014: McKinsey’s definition
McKinsey pegs poverty line at 1,336 per month
Prabhakar Sinha | TNN
A Global consultancy firm pegged a new level for poverty or empowerment line — at Rs 1,336 per month per person as against the poverty line prescribed by the government at around Rs 870 per month per person.
McKinsey, in a report, said the empowerment line determines the level of consumption required for an individual to fulfill his/her basic need for food, energy, housing, drinking water, sanitation, health care, education and social security at a level sufficient to achieve a modest standard of living.
According to the report —From poverty to empowerment: India’s imperative for jobs, growth, and effective basic services — 56% of the population lacks the means to meet essential needs as consumption level falls below Rs 1,336 per person per month or almost Rs 6,700 per month for a family of five. This translates to 680 million people whose consumption levels across both rural and urban area of the country fall short of this mark.
SIGNS OF POVERTY
The Times of India 2013/08/10
Deprivation indicators for poverty survey
One-room kuchcha households No adult member (in the family)
Women-headed households without any [presumably male] adult
Households with disabled member and without any able adult
SC/ST
Households without literate adult
Landless households
Groups for automatic inclusion
Shelterless households
Destitutes
Manual scavengers
Primitive tribal groups
Legally released bonded labourers
Rural poverty
Poverty in rural households: Socio-economic census (2014?)
The Times of India, Jul 13 2015
Subodh Ghildiyal
Census: 5.4cr homes deprived on this count
`Landless manual workers most prone to poverty'
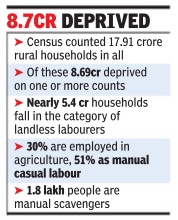
Landlessness and dependence on manual casual labour for a livelihood are key deprivations facing rural families, socio-economic census figures suggest. This, experts say , means they are far more vulnerable to impoverishment than indicated by a plain reading of the census data.
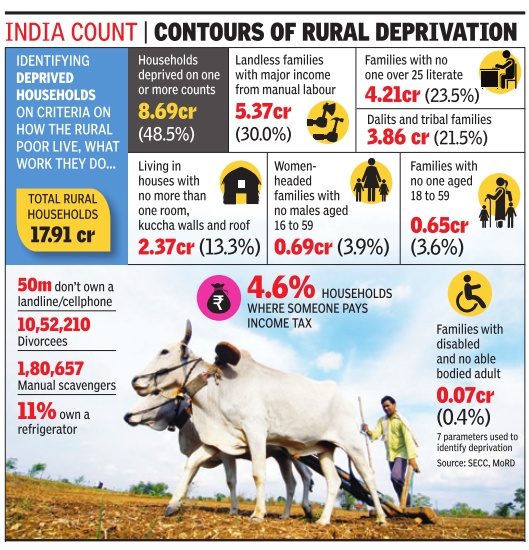
The rural census mapped deprivation on the basis of seven indicators -households with kuchha house; without an adult in working age; headed by a woman and without an adult male in working age; with a disabled member and without an able-bodied adult; of SCSTs; without literate adults over 25 years; and land less engaged in manual labour.
While 48.5% of rural households are saddled with at least one deprivation indicator, the eye-opener is how much the other factors over lap with the worst of them landless households engaged in manual labour. The intersection of any of the six other handicaps with `landless-labour' makes it more acute than otherwise suggested by the observation that the household has “two deprivations“. Nearly 5.40 crore house holds are in the landless labourer category -dubbed by the rural development ministry as the “main running theme of deprivation“.
The more the number of parameters on which a household is deprived, the worse its extent of poverty . It has been found that nearly 30% have two deprivations, 13% have three, though mercifully , only 0.01% suffer from all seven handicaps. Explan panel member Mihir Shah said the correlation between poverty and landless labour was a worrying feature.
“That a very high number of deprived households are also landless doing casual manual labour is significant. Land being the most important asset in rural India, its absence with other deprivations means a household has no asset and is that much more vulnerable.“ He said small and marginal farmers are also getting pauperized and more engaged in manual labour.
2017 yardsticks
Subodh Ghildiyal, Rs 20k in a|cs to be rural poverty barometer , May 22, 2017: The Times of India
A gram panchayat's success in reducing poverty will be judged by the number of households with over Rs 20,000 in savings bank accounts or percentage of families with Aadhaarlinked bank accounts. Or, by the percentage of its households which have availed over Rs 20,000 as bank credit.
Interestingly, higher the number of households with bank loans for “diversified livelihood“, the better the village would be assessed on the scale of progress. It will also be a positive if greater number of families are in nonfarm jobs with skilled work, or are selling their products in markets. Another key indicator of positive change will be the number of families using compost as the primary source to fertilise crops.
Progress of a village will also be measured against the prevalence of malnutrition among children up to three years, percentage of children with full immunisation, number of girls completing secondary education and skilling courses.
These are among the parameters being considered by the rural development ministry to monitor its coming plan to create 50,000 poverty-free gram panchayats, its success to be measured against the “wellbeing of households“ of a village.
Around 20 criteria for development will be clubbed into three categories -infrastructure, social development and economic development.
A senior official said the scale to measure poverty-free panchayats -Mission Antyodaya -was being final ised. According to the plan in the works, the target 50,000 gram panchayats will be bunched together in clusters of 5,000, the idea being that development or economic activity best happens in a collection of villages, be it dairy de velopment or manufacturing or horticulture or tourism.
Sources said the gram panchayats will be selected on the basis of evidence that they have done “model work“ or have demonstrated a level of “social initiative“. Creation of poverty-free gram panchayats is a flagship plan mooted by the government, with the RD ministry in the process of drawing up the details of its implementation.
In a bid to understand the factors that aid development in rural areas, the ministry recently sent officials to study 50 villages across Jharkhand, Odisha, Bihar, Gujarat, Madhya Pradesh, Uttarakhand, Rajasthan, Tamil Nadu and Kerala, which have made visible progress in overcoming poverty.
Also, an elaborate coordination mechanism for the scheme is being created.While it will be included in the list of schemes assessed by the PM and CMs in the Niti Aayog governing council, there will be state level coordination committees under the CMs.
Urban poverty
Bibek Debroy Committee: 2017
Dipak Dash, The Times of India, August 7, 2017
Own fridge, AC or car? No welfare schemes for you
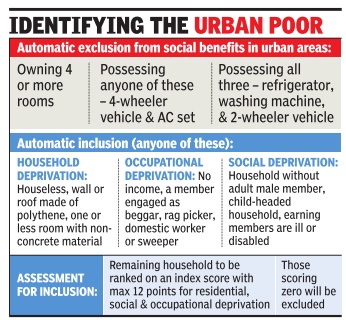
About six in every 10 households in urban areas will be eligible for assessment for identifying whether they are entitled for government's social welfare schemes, according to the recommendation of a government panel.
Those having a four-room set or four-wheeler or an airconditioner will be automatically excluded from being eligible for social benefits in urban areas. Households owning all of three items -refrigerator, washing machine and a two-wheeler -will also be automatically excluded, the Bibek Debroy Committee for implementation of the Socio Economic Survey has recommended. The report also specifies who will be automatically included in the list of beneficiaries based on the parameters set for residential, occupational and social deprivation. Those who are houseless or have a house with polythene wall or roof, no income or households without adult male or headed by a child will be included.
According to the report, the rest of the households will be assessed to find whether they can also be included in the list of beneficiaries. “They will be ranked on the basis of an index score on a scale of zero to 12. The parameters will be residential, social and occupational deprivation,“ said an official. Earlier, the S R Hashim Committee had submitted its report on urban poor in December 2012, but the government never accepted it.
“Going by the recommen dation of Hashim panel, 41% households in urban areas could have been included for assessment to find whether they are eligible for getting benefits from government schemes. But the Debroy panel recommendations will make 59% households eligible for this assessment,“ said a source.The panel has said categorising of householdspopulation as BPL or above poverty line would be a misnomer.
Inability to afford a healthy diet: 2017> 2024

From: August 9, 2025: The Times of India
See graphic:
Inability to afford a healthy diet in Bangladesh, China, India, Nepal, Pakistan and Sri Lanka. : 2017> 2024
Poverty Line
[ From the archives of the Times of India]
Tendulkar committee
Urban (for 2004-5): 446.68
Rural (for 2004-5): 578.8
Plan panel revised estimates (now withdrawn)
Urban (for 2009-10): 859.6
Rural (for 2009-10): 672.8
WORLD BANK Poverty
[ From the archives of the Times of India]
<$1.25 per day (PPP) or 648 per month (urban) & 429 (rural) as of 2005 Extreme poverty: <$1 per day (PPP) or 516 per month (urban) and 342 (rural) as of 2005
Angus Deaton on the Indian poverty line
The Times of India, Oct 13 2015
Partha Sinha & Srikant Tripathy
Eco Nobel winner strong critic of India's poverty line
Had a tiff with Panagariya on why Indian kids are shorter
Angus Deaton, the Scottish-American Princeton professor who won the Economics Nobel on Monday “for his analysis of consumption, poverty , and welfare“, has a strong India connect with several of his academic papers and articles focused on the country and based on data collected here. Deaton (69) has worked with Jean Dreze of Delhi School of Economics, Abhijit Banerjee of MIT and Jishnu Das of World Bank on areas like poverty , healthcare, nutrition, etc. Even his homepage on Princeton website lists `Poverty in the world and in India' as one of the Nobel winner's main areas of research. It's not only collaboration with Indians and on India, the Princeton professor even had a tiff with Arvind Panagariya, former Columbia University professor and now the deputy chief of Niti Aayog, about the reasons behind the shorter height of Indian children compared to the global average. Deaton is also a harsh critique of the measure of poverty line used by the Indian government that was a hot topic two years ago.
One of Deaton's leading works, along with MIT's Banerjee and Esther Duflo, and Das from World Bank, was based on a healthcare-related survey of tribal households in Udaipur, then one of the poorest districts in the country . In 2002 and 2003, Deaton and others worked on a survey-based project titled `Health Care Delivery in Rural Rajasthan'. Seva Mandir, an Udaipur-based NGO that works for integrated rural development in the district, was involved in the project as the local facilitator and coordinator.
According to Priyanka Singh, CEO, Seva Mandir, Deaton visited Udaipur twice and had gone to the villages to have first-hand experience of the situation there.“He was very sound on subjects of nutrition and health.During interactions, we found he could explain difficult things in a very simple way ,“ said Singh.
Deaton, Banerjee and others' survey of 100 hamlets in Udaupir threw up interesting results -like low level of immunization in rural areas, ab sence of government-sponso red healthcare facility, reliance on private healthcare even at a much higher cost, etc -some of which have strong relevance even today .
A few years ago, Deaton had an academic debate with Pana gariya on the reasons for shor ter height of Indian children The article by Deaton and others in the Economic and Po litical Weekly points out that Indian children are very short on average, compared to child ren living in other countries “Because height reflects early life health and net nutrition and because good early life he alth also helps brains to grow and capabilities to develop, wi despread growth faltering is a human development disaster Panagariya while acknowled ges these facts had argued in (another) article that Indian children are particularly short because they are genetically programmed to be so,“ the article had pointed out.
Deaton is also a strong critic of how India fixes its poverty line, the estimated minimum income required for basic necessities of life. “Indian poverty is measured using a series of household surveys, run by India's National Sample Survey. The results of these surveys have been subject to intense debate in recent years.There are also significant questions about the appropriateness of the poverty lines used by the Government of India. Finally , the Indian consumer price indexes used in the poverty calculations have also been questioned,“ the Nobel laureate wrote on his home page.
Poverty line, population below
1951-2012
May 26, 2019: The Times of India
From: May 26, 2019: The Times of India
See graphic:
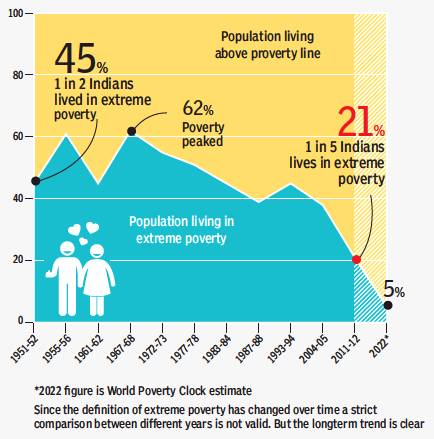
The percentage of Indians living above and below the poverty line, 1951-2012
The persistence of extreme poverty has cast a shadow on India’s many economic achievements. For nearly three decades, the country was home to the world’s largest number of poor. Beginning in the 1990s, the fall in poverty picked up speed, which accelerated after 2004-5. Most international forecasts predict poverty will fall to negligible levels in the next five years. The next elections may be fought in an India almost free of extreme poverty
1973- 2005: Percentage and Number of Poor Estimation
December 22, 2014: The Planning Commission
|
Year |
Poverty Ratio (%) |
Number of Poor (million) | ||||
|
Rural |
Urban |
Total |
Rural |
Urban |
Total | |
|
1973-74 |
56.4 |
49.0 |
54.9 |
261.3 |
60.0 |
321.3 |
|
1977-78 |
53.1 |
45.2 |
51.3 |
264.3 |
64.6 |
328.9 |
|
1983 |
45.6 |
40.8 |
44.5 |
252.0 |
70.9 |
322.9 |
|
1987-88 |
39.1 |
38.2 |
38.9 |
231.9 |
75.2 |
307.0 |
|
1993-94 |
50.1 |
31.8 |
45.3 |
328.6 |
74.5 |
403.7 |
|
1999-2000 |
27.1 |
23.6 |
26.1 |
193.2 |
67.0 |
260.2 |
|
2004-051(Uniform Reference Period) |
28.3 |
25.7 |
27.5 |
220.9 |
80.8 |
301.7 |
|
2004-052 (Mixed Reference Period) |
21.8 |
21.7 |
21.8 |
170.3 |
68.2 |
238.5 |
Footnotes:
1 - Comparable with 1993-94 Estimates;
2 - Comparable with 1999-2000 Estimates
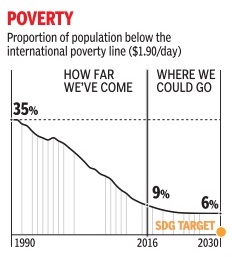
1990-2016: below the international poverty line
See graphics:
Proportion of population below the international poverty line between 1990 and 2016
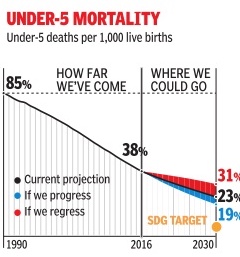
Reduction in the death of children under the age of 5, for every 1,000 live births, between 1990 and 2016
1993-2005: Percentage, number of Poor Estimated by Tendulkar Method
(Poverty Estimates) by Expert Group by Tendulkar Method using Mixed Reference Period
December 22, 2014: The Planning Commission
|
Poverty Ratio (%) |
Number of Poor (million) | |||||
|
Rural |
Urban |
Total |
Rural |
Urban |
Total | |
|
I. Expert Group 2009 (Tendulkar Methodology) | ||||||
|
1. 1993-94 |
50.1 |
31.8 |
45.3 |
328.60 |
74.50 |
403.70 |
|
2. 2004-05 |
41.8 |
25.7 |
37.2 |
326.30 |
80.80 |
407.10 |
|
3. 2009-10 |
33.8 |
20.9 |
29.8 |
278.21 |
76.47 |
354.68 |
|
4. 2011-12 |
25.7 |
13.7 |
21.9 |
216.50 |
52.80 |
269.30 |
|
II. Expert Group 1993 (Lakdawala Methodology) | ||||||
|
1. 1993-94 |
37.3 |
32.4 |
36.0 |
244.0 |
76.3 |
320.4 |
|
2. 2004-05 |
28.3 |
25.7 |
27.5 |
220.9 |
80.8 |
301.7 |
|
Annual Average Decline from 1993-94 to 2011-12 | ||||||
|
Poverty Ratio (% points) |
Number of Poor (million) | |||||
|
Rural |
Urban |
Total |
Rural |
Urban |
Total | |
|
Annual Average Decline : 1993-94 to 2004-05 (% points per annum) |
0.75 |
0.55 |
0.74 |
0.21 |
-0.57 |
-0.31 |
|
2004-05 from 1993-94 by Expert Group 1993 |
0.82 |
0.61 |
0.77 |
2.10 |
-0.41 |
1.70 |
|
2009-10 from 2004-05 by Expert Group 2009 |
1.60 |
0.96 |
1.48 |
9.62 |
0.87 |
10.48 |
|
Annual Average Decline : 2004-05 to 2011-12 (% points per annum) |
2.32 |
1.69 |
2.18 |
15.69 |
4.00 |
19.69 |
2011-13: the enormity of the poverty that remains
The Times of India, Jul 04 2015
MOST EXHAUSTIVE SOCIO-ECONOMIC SURVEY SHOWS COUNTRY FACES A GIGANTIC CHALLENGE
Half of rural India touched by poverty
India has a problem at hand and its magnitude is much higher than what was imagined or reported. That is the short and succinct message of the SocioEconomic and Caste Census (SECC) released on Friday . According to the census, 49% of rural households show signs of poverty . And 51% of households have `manual casual labour' as the source of income. Whichever way the figures are sliced and diced, the poverty data leaves no scope for assurance or optimism. Till now, every survey had been showing poverty as receding.
The survey has used seven indicators of deprivation: All definite pointers to subsistence-level existence and seri ous handicaps like `kuccha houses', landless households engaged in manual labour, female-headed households with no adult working male member, households without a working adult, and all SC ST households.
While there can be room for correction, experts are unanimous that this would not change the bleak picture significantly . For instance, they are unanimous that all those dependent on `manual casual labour' for livelihood -51.14% of households -are bound to be poor.
The dismal scenario is illustrated by another set of dire figures: 2.37 crore households live in one-room kuccha houses, constituting 13.25% of the 17.91 crore rural households. At the same time, 30% of rural households own no land and are engaged in manual labour. The overall poverty figures for the country will also take into account the urban household survey that is yet to be released. But they , whenever they are out, are unlikely to change the overall picture.
The degree of deprivation as evidenced by the rural survey poses an intractable challenge for the Modi government if it wants to draw up a consolidated list of the poor, known as `Below Poverty Line'. If the government goes by the new evidence, the BPL category would balloon beyond its fiscal capacity . Conversely , if it seeks to put a ceiling and depress the figures, it would attract the kind of controversy that had hit the UPA.
The last government-commissioned figure had put the poverty line at a much lower 30%. The divergence is possibly the reason why the rural development ministry has desisted from coming out with a poverty figure while releasing the data for SECC.
A possible way out for the Centre would be to keep various deprivation figures -like on housing, employment, destitution -separate and use them for better targeting of niche welfare and development programmes. The option of drawing up a fresh consolidated poverty list a la BPL may not be exercised.
SECC may be the fuel to partisan political fire. For Prime Minister Narendra Modi, who does not tire of accusing Congress of keeping the country trapped in under-development, it will serve as the catalyst to intensify his campaign. But the negative messaging has its limits and there is risk of the damning statistics getting identified with the government of the day , that is BJP.
2012 poverty: World Bank report
The Indian Express, June 28, 2016
Yue Li and Martin Rama
Using National Sample Survey (NSS) data from 2012
Where you live decides how ‘well’ you live
Whether a household is poor or not depends not only on its assets, education and skills but also, importantly, on where it lives. Consider a ‘typical’ Indian household, which has four members and where the adults have less than nine years of education. Assuming this household is also ‘typical’ in other respects, it would spend Rs 8,121 per month if it lived in urban Maharashtra, but only Rs 3,735 a month if it resided in rural Bihar. A part of this difference can be explained by the higher cost of living in urban Maharashtra. Nonetheless, a big part of it can be attributed to the real difference in consumption levels between the two locations. One may think of this difference in consumption levels — 117 per cent in this case — as the gain associated with living in a ‘good’ location.
It is, however, important to note that this clear distinction between urban and rural areas no longer exists in India. A decade ago, India’s cities and countryside were truly different. Nowadays, the difference between urban and rural areas is mostly a matter of degree. While cities are expanding beyond their municipal boundaries, many once-rural areas are becoming denser and acquiring more urban characteristics. Today, as cities move to people as much as people move to cities, India’s rural-urban divide is being replaced by a rural-urban gradation.
In a recent paper, we explored how this messy urbanisation affects the likelihood of a household being poor, and its living standards more generally. We used National Sample Survey (NSS) data from 2012 to compare patterns in living standards across four different types of locations along the rural-urban gradation, from small rural areas with a population of less than 5,000 to large urban areas with a population greater than one million. In all, we considered roughly 1,400 places spread across the 599 districts for which we have good data. With this more granular spatial perspective, we found that the ‘typical’ Indian household could consume Rs 13,554 per month in urban Gurgaon in Haryana, which has the highest consumption levels among all the 1,400 places considered. At the other extreme, a similar household in a small village in the Malkangiri district of Odisha would consume only Rs 2,928. Seen from this more detailed standpoint, the difference in consumption levels rises to 362 per cent.
Clearly, where a household lives matters. About half of the overall variation in consumption expenditure across places can be explained by differences in a household’s characteristics such as its ownership of assets, in its education and skills, and in its age composition — or how many working members there are in a household. But when we also take the household’s place of residence into account, nearly two thirds of this difference can be explained. This means that one third of the variation in per capita consumption in India is related, in one way or another, to the place where a household lives. The analysis yields other insights too. First, it has now become difficult to tell the difference between large rural areas and small urban areas. And, that on average, small urban areas and large rural areas can support similar consumption levels.
It’s not just where you live, near what you live matters too
It also appears that the ‘best’ places to live in India tend to be near each other. Clusters of such places are to be found in the northwest of India, along the western and southwestern coasts, and in India’s northeast, towards Bangladesh. Among them are the agglomerations surrounding Ahmedabad, Bengaluru, Delhi, Jodhpur, Kolkata, Mumbai, Puducherry, South Goa and Thiruvananthapuram. Some of these clusters are huge. For example, the one around Delhi spreads across 60 districts, spanning seven of India’s northwestern states and Union Territories. Similarly, the cluster around Thiruvananthapuram spans 19 districts across the three southern states of Karnataka, Kerala and Tamil Nadu. Although generally, urban India tends to have higher consumption levels than rural areas, there are some surprises. Interestingly, it is not only large urban areas which display the highest gains in living standards. In fact, many of the best places to live and work are secondary towns, and some of them are still administratively rural. What makes these ‘good’ rural locations special is that they lie in the catchment area of some of the best locations in the country. Seen this way, what matters for a household is not just ‘where’ it lives, but also ‘near what’ it lives.
Some ‘good’ locations spread their prosperity more than others
However, all the ‘good’ locations do not spread their prosperity around them evenly. For instance, both Bengaluru and Delhi are among India’s top locations. Between them, Bengaluru enjoys a slightly higher gain in living standards than Delhi, arguably making it a better city to live and work in. But Delhi spreads its benefits more widely, doing substantially better than Bengaluru in the extent of its impact on surrounding areas. In Delhi’s case, the gain in living standards is still high up to 200 km away from the core of the city, while in Bengaluru it almost vanishes just 100 km from the city centre. We do not know for sure why this is so, but the issue certainly warrants further research. T‘e ‘least good’ places to live and work are concentrated in the centre of India, where the states of Madhya Pradesh, Chhattisgarh, and Odisha meet. A number of such places can also be found in Uttar Pradesh and Bihar, along the Ganga basin. Surprisingly, most of them do not fall in the rural parts of these states, but rather in small urban areas.
Tribal populations live in some of the most disadvantaged places
Last but not least, paying attention to the places where people live changes our interpretation of the key determinants of poverty. One of the most dramatic changes concerns our understanding of why some social groups are poorer than others. For instance, a tribal household consumes 23 per cent less than a household from the general category that is otherwise identical. But when the place of residence is taken into account, this gap falls to 13 per cent. In other words, a superficial analysis would suggest that poverty among tribals is related to their socio-economic characteristics. On the other hand, our spatial analysis suggests a key reason why tribal populations are poor is because they live in some of the most disadvantaged places in the country.
2018: In India, Brazil, China, Pakistan, Sri Lanka etc
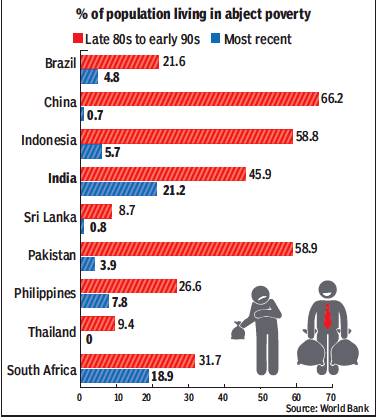
From: August 17, 2019: The Times of India
See graphic, ‘The percentage of the population living in abject poverty in India, Brazil, China, Pakistan, Sri Lanka etc.: between 1980-90 and presumably 2018. ’
2011> 2023
Siddharth Upasani, Oct 19, 2025: The Indian Express
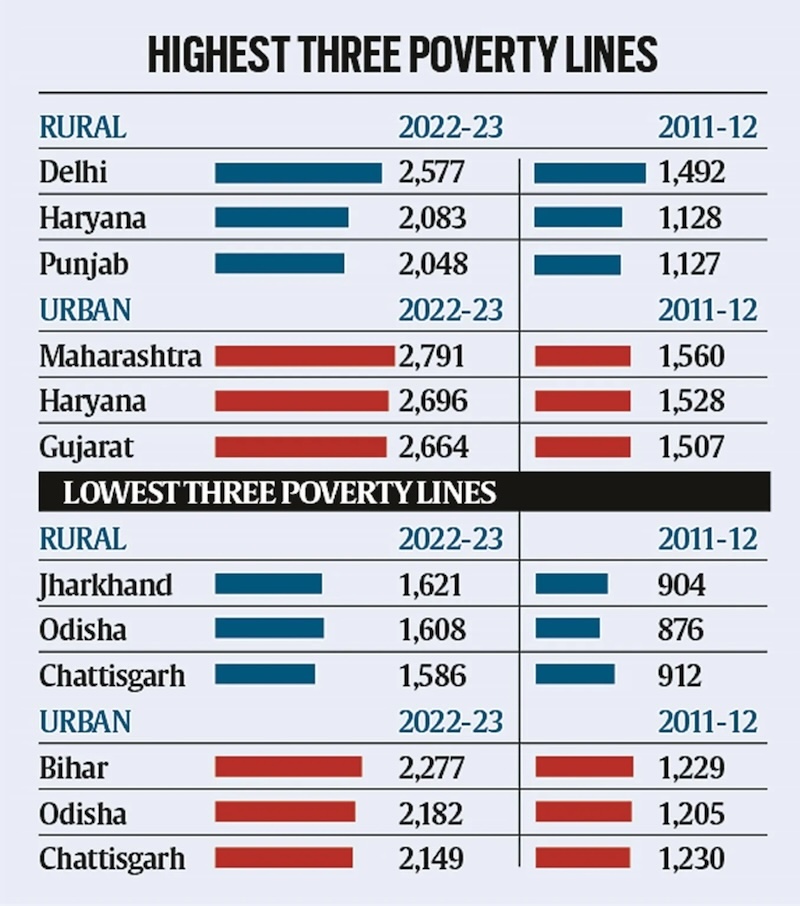
From: Siddharth Upasani, Oct 19, 2025: The Indian Express
Almost 15 years ago, the erstwhile Planning Commission set up a committee headed by C Rangarajan, a former governor of the Reserve Bank of India (RBI), to review the methodology for measurement of poverty in the country. The committee, which submitted its report in June 2014, caused a stir when it estimated the national poverty line at Rs 1,407 in terms of monthly per capita expenditure for urban areas and Rs 972 for rural areas.
What this meant was that anyone spending more than Rs 47 per day in urban areas and Rs 32 per day in rural areas was not ‘poor’. These thresholds led to the number of poor in India being pegged at 29.5 per cent of the population. Since then, no new poverty line, at least one backed by the government, has been created.
Odisha, Bihar big movers
Last week, economists from the RBI’s Department of Economic and Policy Research published a paper in which they ‘updated’ the Rangarajan line for 20 major states of India using the government’s Household Consumption Expenditure Survey (HCES) for 2022-23. The results showed Odisha and Bihar had posted the biggest decline in poverty levels between 2011-12 and 2022-23, with the proportion of the population below the updated version of the Rangarajan poverty line falling by around 40 percentage points.
Rural poverty in Odisha fell to 8.6 per cent in 2022-23 from 47.8 per cent in 2011-12 – the biggest decline of any state in India. On the urban side, the fall was the most for Bihar, with 9.1 per cent of the population below the updated poverty line, down from 50.8 per cent in 2011-12 as estimated by the Rangarajan committee.
On the other hand, the decline in the percentage of the population below the poverty line was the least in Kerala and Himachal Pradesh. However, both states have one of the lowest poverty levels. In 2022-23, the percentage of the rural population below the RBI staff’s updated poverty line was 1.4 per cent in Kerala, down 590 basis points (bps) from 7.3 per cent in 2011-12. For urban areas, the decline was the least for Himachal Pradesh: from 8.8 per cent to 2 per cent, or 680 bps.
On the whole, rural poverty in 2022-23 was lowest in Himachal Pradesh (0.4 per cent) and highest in Chhattisgarh (25.1 per cent). Urban poverty, meanwhile, was lowest in Tamil Nadu (1.9 per cent) and highest, again, in Chhattisgarh (13.3 per cent).
It is worth pointing out that the all-India rural and urban poverty lines estimated by the Rangarajan committee were not updated by the RBI economists in their study.
Updating Rangarajan’s lines
Unlike some others, the RBI staff study chose not to ‘adjust’ the old poverty lines using Consumer Price Index (CPI) inflation – because it’s not accurate to do so as the CPI basket and the Rangarajan poverty line basket (PLB) are different: the weight of food in the rural Rangarajan PLB is 57 per cent compared to 54 per cent in rural CPI, while 47 per cent of the urban Rangarajan PLB is food compared to 36 per cent for urban CPI.
What they instead did was create a new price index – like the CPI – but one whose constituent items have the same weight as the Rangarajan PLB. This price index and the resultant inflation levels were then used to inflate each state’s 2012 rural and urban poverty lines as estimated by the Rangarajan committee. Using 2022-23 HCES data, the percentage of households below the updated poverty lines was found. Of course, as the RBI staff themselves noted, consumption patterns changed between 2011-12 and 2022-23, as the latter HCES showed. And just as this requires a change in the CPI basket – which the statistics ministry is in process of doing on the basis of the 2023-24 survey – the PLB and the poverty line too might require alterations.
Indian poverty debates
The level of poverty in India has been a matter of intense discussion for years. Earlier this year in January, State Bank of India Research estimated using 2023-24 HCES data that poverty in rural areas was 4.86 per cent and 4.09 per cent in urban areas. These estimates were based on inflation-adjusted 2023-24 poverty lines of Rs 1,632 for rural areas and Rs 1,944 for urban areas.
A couple of other attempts back in 2022 sparked what development economist Justin Sandefur called ‘The Great Indian Poverty Debate, 2.0’, alluding to the 2005 book by Nobel laureate Angus Deaton. In April 2022, two separate papers were published under the aegis of the International Monetary Fund (IMF) and the World Bank (WB), respectively. In the absence of HCES data post 2011-12, the two papers attempted to use alternate data sets to estimate poverty in India but reached rather different conclusions.
The WB working paper – helpfully titled ‘Poverty in India Has Declined over the Last Decade But Not As Much As Previously Thought’ – concluded that poverty stood at 10.2 per cent in 2019. The IMF working paper, co-authored by economist Surjit Bhalla – then the Indian government’s Executive Director at the Fund – asserted that the poverty rate was a much lower 0.8 per cent in 2019, aided by the government’s food transfers.
Multidimensional poverty
As far as the government is concerned, poverty lines are seemingly a thing of the past. What matters now is multidimensional poverty, which goes beyond just money and consumption. Based on the global Multidimensional Poverty Index (MPI), the Indian MPI looks at poverty through three lenses: health, education, and standard of living. These are represented by 12 indicators: nutrition, child and adolescent mortality, maternal health, years of schooling, school attendance, cooking fuel, sanitation, drinking water, housing, electricity, assets, and bank account.
The global MPI does not take maternal health and bank accounts into consideration while measuring poverty.
The government said in January 2024 that 24.82 crore people had escaped multidimensional poverty in the last nine years, with multidimensional poverty reducing from 29.17 per cent in 2013-14 to 11.28 per cent in 2022-23. According to the World Bank, India’s poverty headcount ratio stood at 23.9 per cent in 2022 at the $4.2 per day international poverty line for lower-middle-income countries.
1991, 2011-2022
SWAMINATHAN S ANKLESARIA AIYAR, April 16, 2023: The Times of India
An IMF working paper by Bhalla, Bhasin and Virmani (henceforth called BBV) has come out with a series of poverty projections based on different assumptions, the most optimistic of which shows extreme poverty virtually disappearing at just 0. 86% of the population (12 million people). (This is based on the World Bank’s extreme poverty line of consumption of $1. 9 per day).
Is this plausible? If so, how much credit goes to the BJP? Listing the estimates of all research papers can be boring. But all show that poverty has plummeted after the economic reforms of 1991 that helped accelerate GDP growth. Clearly fast growth is the best poverty alleviator.
India is a land of a thousand statistical debates. A World Bank study last year by Roy and Weide estimated that poverty declined from 22. 5% (270 million people) in 2011 to 10. 2% (140 million people) in 2019. This was very substantial but nowhere near the IMF estimates.
Noah Smith, a prominent US blogger-economist, startled Americans by tweeting a chart citing the World Poverty Clock and The Washington Post, showing poverty crashing in just six years in India, from 124 million in 2016 to just 15 million in 2022.
I was about to protest that this was too good to be true. But then Smith himself tweeted additional charts with very different estimates based on different assumptions. A longterm chart from India’s country profile in the World Bank’s website used an updated poverty line of $2. 15 at 2017 prices. This showed the poverty ratio plummeting from 47. 6% (441 million people) in 1993 to 10.
0% (138 million people) in 2019. The poverty ratio declined throughout the whole period when many different parties ruled. Both the Congress party (which ruled in 1991-96 and 2004-14) and the BJP (which ruled in 1998-2004 and 2014 onwards) can claim credit. In what roughly corresponds to the Manmohan Singh era, poverty fell from 39. 9% (453 million people) in 2004 to 18. 7% (248 million people) in 2015. This favourable trend continued after Modi came to power, with the poverty ratio falling further to 10% (138 million people) by 2019.
Poverty used to be estimated through five-year surveys of consumption, but no such survey data is available after 2011. So, the IMF researchers assume that consumption for all classes has risen in line with GDP growth since 2011. They make further adjustments for high food subsidies. The 2013 Food Security Act mandated 5 kg per head of rice at Rs 3/kg or wheat at Rs 2/kg for poorer people. In addition, when Covid struck, the government mandated an additional five kgs per head absolutely free. With the end of Covid, the additional ration has ended but the original ration is now free. Adjusting for cheap food is important to accurately estimate poverty.
In surveys, Indian consumers used to be asked to recall consumption of all items over a uniform 30 days. However, people reported significantly higher consumption when asked to recall how much they consumed in the preceding week, especially for perishables. Using a mixed recall period (weekly for perishables) is now India’s standard methodology.
Based on mixed recall, BBV estimate that the poverty ratio declined from 32. 7% in 2004 to 7. 4% in 2014 (Congress era) and further to 2. 5% by 2020 under BJP rule. The heavy lifting was done by Congress, and the BJP followed suit.
The researchers then adjust for highly subsidised food. On this adjusted basis, the poverty ratio fell from 31. 9% in 2004 to 5. 1% in 2014, in the Congress era. It declined further to 0. 86% in 2020, in the Modi era.
World Bank researchers caution against the assumptions of BBV. They agree that poverty has crashed but think 2019 poverty was 12 times higher than the BBV estimate! Economist Jean Dreze says real rural wages have risen very little in the last eight years.
How much difference did cheap food make after 2013? Not much. For 2020, BBV estimate that the poverty ratio was 2. 5% without adjustments for subsidised food and 0. 86% after adjustments. Evidently poverty plummeted mainly because of rapid GDP growth.
When highly subsidised food under the National Food Security Act was first proposed, some economists feared fiscal disaster. One calculated that the food subsidy might be as much as 3% of GDP. In practice it was less than half as much. Besides, GDP grew much faster than the food subsidy, making it fiscally very affordable. Even with an expanded ration of 10 kg per head after Covid, the food subsidy came to barely one percent of GDP in 2022. With Covid petering out and reversion to the original ration of 5 kg per head (now totally free), the fiscal cost will fall to just 0. 63% of GDP. That demonstrates how rapid GDP growth makes welfare benefits affordable.
2025: Best and worst states
March 19, 2025: The Times of India
Kerala, Goa Have Eliminated Poverty
More than 30% of people in Bihar struggle with deprivations that affect multiple aspects of life. Only 0.6% of people in Kerala face a similar situation. Multidimensionally Poor…
...Making up more than 20% of the state's population Bihar – 33.8%
Jharkhand – 28.8%
Meghalaya – 27.8%
Uttar Pradesh – 22.9%
Madhya Pradesh – 20.6%
...Making up less than 5%
Delhi – 3.4%
Sikkim – 2.6%
Tamil Nadu – 2.2%
Goa – 0.8%
Kerala – 0.6%
Source: NITI Aayog
India’s best and worst states: The percentage of population below the poverty line, presumably in the early 2020s
Causes of poverty
Expenditure on health
‘38 Million Made Poor Just By Having To Buy Medicines’
About 55 million Indians were pushed into poverty in a single year because of having to fund their own healthcare and 38 million of them fell below the poverty line due to spending on medicines alone, a study by three experts from the Public Health Foundation of India has estimated. The study, published in the British Medical Journal, reveals that non-communicable diseases like cancer, heart diseases and diabetes account for the largest chunk of spending by households on health.
The study concluded that among non-communicable diseases, cancer had the highest probability of resulting in “catastrophic expenditure” for a household. Health expenditure is considered to be catastrophic if it constitutes 10% or more of overall consumption expenditure of a household. In the case of road traffic and non-road traffic injuries, it was found that catastrophic expenditure was higher among the poorest, with average stay in hospital beyond seven days.
Data from nationwide consumer expenditure surveys spanning two decades from 1993-94 up to 2011-12 and the ‘Social Consumption: Health’ survey done by the National Sample Survey Organisation in 2014 were analysed by the study authors including health economists Sakthivel Selvaraj and Habib Hasan Farooqui.
While the study looks at data up to 2011-12, it refers to measures taken by the government since then to reduce the expenditure burden on medicines and healthcare on households. It noted that though the Drug Price Control Order 2013 brought all essential drugs in the National List of Essential Medicines under price control, these constituted just 20% of the retail pharmacy market and that the sales volume of many of the drugs brought under price control has fallen.
Despite governments launching several health insurance schemes, a majority of the population continued to incur significant expenditure on medicines as hospitalisationbased treatment, which is what most insurance schemes cover, constitutes only one third of India’s morbidity burden, noted the study. It added that frequency of hospitalisation was smaller than outpatient visits in general, especially for NCDs, which are chronic in nature requiring multiple consultations and long-term or lifelong medication and support.
With shrinking availability of free drugs in the government health system for outpatients and a sharper decline in their availability for inpatients, there was little incentive for patients to seek public healthcare, noted the study, adding that medicine-related expenditure for households remained high as most patients sought outpatient care in the more expensive private sector.
As for the government's promise to provide cheap medicines through Jan Aushadhi stores, though the target of opening over 3,000 stores has been met, they have been plagued with frequent stockouts and quality issues. Most Jan Aushadhi stores have barely 100-150 formulations instead of the promised 600-plus medicines and their numbers are too small compared to the 5.5 lakh plus pharmacies in India.
Growth and Poverty
"Raise Growth, Reduce Poverty": economists
Nov 19, 2019: The Times of India
Raise Growth, Reduce Poverty
Time now to think of universal supplementary income in the fight against poverty
C Rangarajan and S Mahendra Dev
In the post-reform period, poverty ratio in India, based on Tendulkar methodology, declined 0.74% per annum during 1993-94 to 2004-05 while it declined 2.18% during 2004-05 to 2011-12. In fact, the number of poor came down by 137 million in the latter period. According to Rangarajan Committee methodology, the decline between 2009-10 and 2011-12 is 92 million, which is 46 million per annum.
The impact of higher growth on poverty reduction can also be seen from the decile-wise growth in per capita consumption expenditure. A comparison of the growth rate of per capita consumption (in real terms) during the periods 1993-94 to 2004-05 and 2004-05 to 2011-12 shows that the average growth of per capita consumption of the top five deciles is more than that of the bottom five deciles. However, the ratio of the average growth rates of the two periods is higher for the bottom five deciles as compared to the top five.
Faster reduction in poverty is true even if we take multidimensional poverty index (MPI). According to the Report of the Global MPI, 2018, India has made momentous progress in reducing multidimensional poverty. The incidence of multidimensional poverty was almost halved between 2005-06 and 2015-16, climbing down to 27.5%. Within 10 years, the number of poor people in India fell by more than 271 million.
Thus, whether we look at consumption based poverty or MPI, poverty declined faster during the high growth period. It may be noted that real per capita GDP growth was 7.0% per annum during 2004-05 to 2011-12 as compared to 4.4% per annum during 1993-94 to 2004-05.
The pattern of growth matters for reduction of poverty. Agricultural and rural growth is important for raising the incomes of bottom deciles. Agricultural sector recorded highest growth rate of 4.2% per annum during 2004-05 to 2011-12. Construction sector also generated a lot of employment. Rural real wage growth was higher than the earlier periods. One could see rise in incomes of farmers, landless labourers and other rural non-farm workers. These factors had significant impact on poverty reduction.
In the post 2011-12 period, we do not have data to examine trends in poverty as government is yet to release the consumer expenditure data for the recent period. But, during the period 2011-12 to 2018-19, GDP growth and agriculture growth were lower than those of the earlier period. Terms of trade were not in favour of agriculture and rural wage growth declined. The economy showed a GDP growth rate of 5% in the first quarter of FY20 and it is expected to be around 6% for this fiscal year. We have concerns about the behaviour of the poverty ratio in the light of the slowing down of growth recently.
C Rangarajan is former Chairman of PM’s Economic Advisory Council. S Mahendra Dev is Vice Chancellor, Indira Gandhi Institute of Development Research, Mumbai
Multi-dimensional poverty
In brief
Atul Thakur, Oct 13, 2021: The Times of India
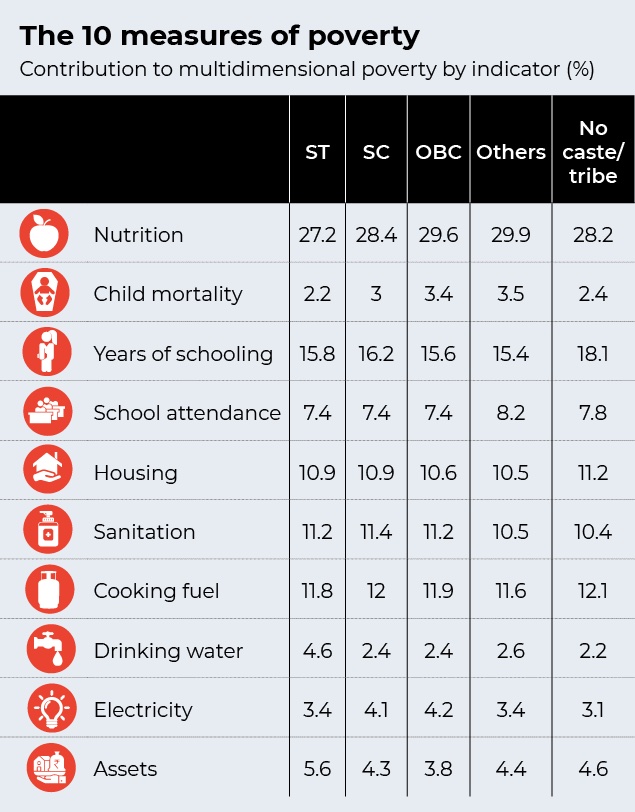
From: Atul Thakur, Oct 13, 2021: The Times of India
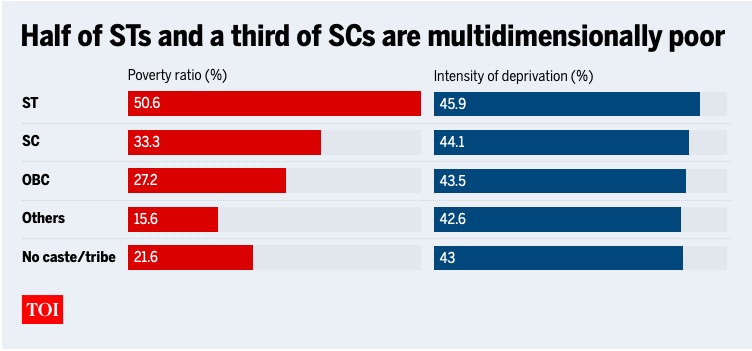
From: Atul Thakur, Oct 13, 2021: The Times of India
From: Atul Thakur, Oct 13, 2021: The Times of India
From: Atul Thakur, Oct 13, 2021: The Times of India
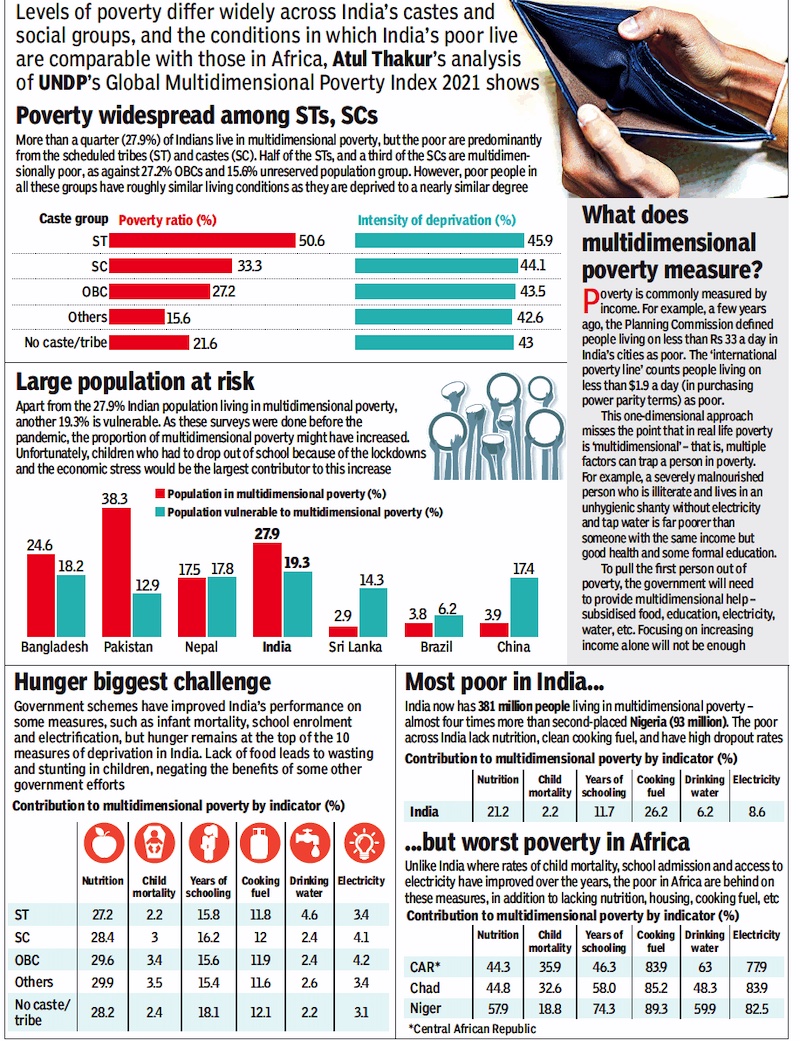
Poverty is commonly measured by income. For example, a few years ago the Planning Commission defined people living on less than Rs 33 a day in India’s cities as poor. Similarly, the ‘international poverty line’ counts people living on less than $1.9 a day (in purchasing power parity terms) as poor.
This one-dimensional approach, however, misses the point that in real life poverty is ‘multidimensional’ – that is, multiple factors can trap a person in poverty. For example, a severely malnourished person who is illiterate and lives in an unhygienic shanty without electricity and tap water is far poorer than someone with the same income but good health and some formal education. To pull the first person out of poverty, the government will need to provide multidimensional help – subsidised food, education, electricity, water, etc. Focusing on increasing income alone will not be enough.
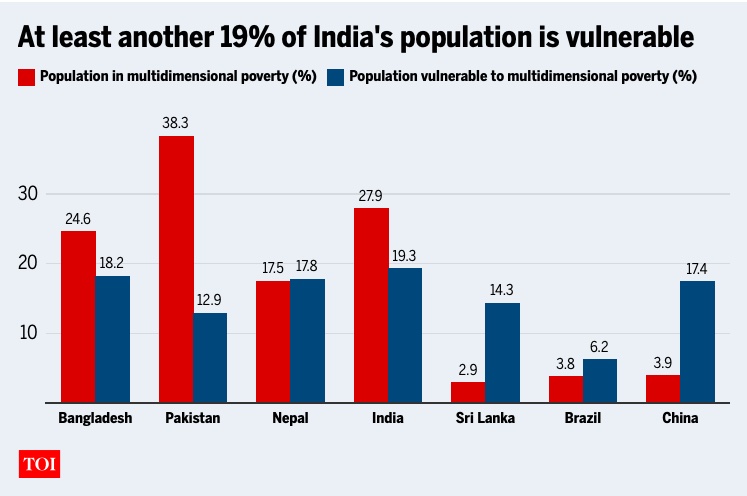
In India, levels of poverty differ widely across castes and social groups, and the conditions in which the country's poor live are comparable with those in Africa, Here's what TOI's analysis of UNDP’s Global Multidimensional Poverty Index 2021 shows.
Poverty widespread among STs, SCs
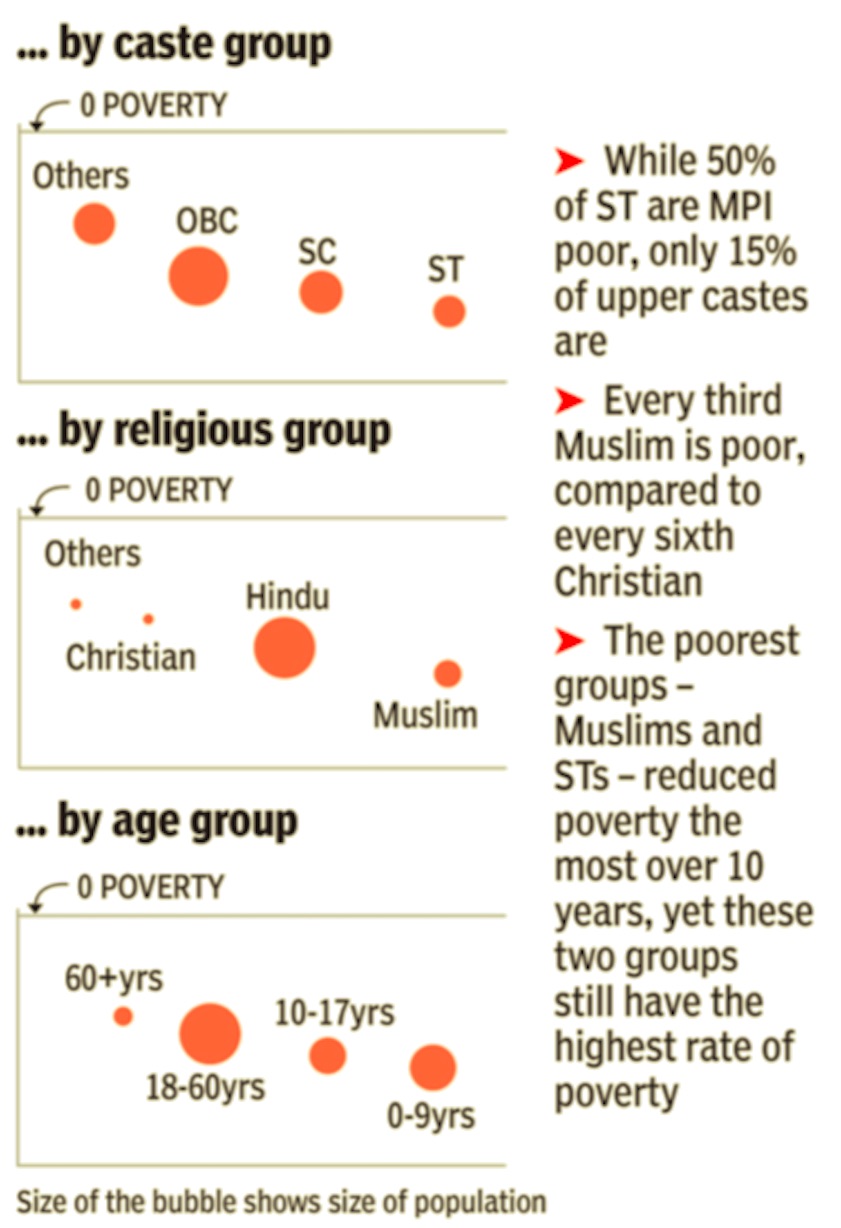
More than a quarter (27.9%) of Indians live in multidimensional poverty, but the poor are predominantly from the scheduled tribes (ST) and scheduled castes (SC). Half of the STs, and a third of the SCs are multidimensionally poor, as against 27.2% OBCs and 15.6% of the unreserved population group. However, poor people in all these groups have roughly similar living conditions as they are deprived to a nearly similar degree.
Large population at risk
Apart from the 27.9% Indian population living in multidimensional poverty, another 19.3% is under the vulnerable category. As these surveys were done before the pandemic, the proportion of multidimensional poverty might have increased. Unfortunately, children who had to drop out of school because of the lockdowns and the economic stress would be the largest contributor to this increase.
Hunger biggest challenge
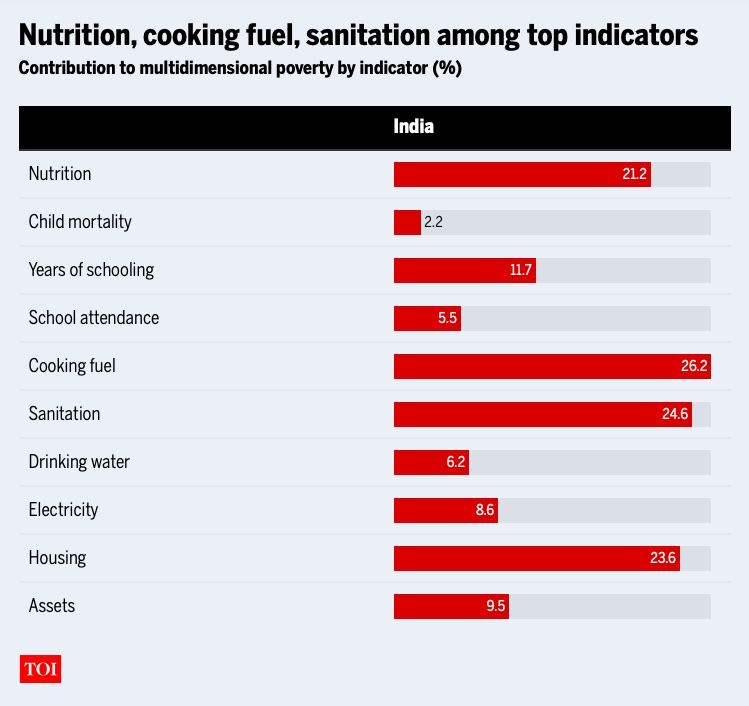
Government schemes have improved India’s performance on some measures, such as infant mortality, school enrolment and electrification, but hunger remains at the top of the 10 measures of deprivation in India. Lack of food leads to wasting and stunting in children, negating the benefits of some other government efforts.
Most poor in India...
India now has 381 million people living in multidimensional poverty – almost four times more than second-placed Nigeria (93 million). Pakistan, Ethiopia, Democratic Republic of Congo and China are the only other countries with over 50 million such vulnerable people each. The poor across the Indian subcontinent lack nutrition, proper housing, access to clean cooking fuel, and have high school dropout rates.
...but worst poverty in Africa
Unlike the Indian subcontinent where rates of child mortality, school admission and access to electricity have improved over the years, the poor in Africa are behind on these measures, in addition to lacking nutrition, proper housing, clean cooking fuel, etc.
2005>21: falls from 55% to 16%; 10 poverties remains
Dec 21, 2024: The Times of India

From: Dec 21, 2024: The Times of India
1 Over 40 Cr Have Beaten Poverty In 15 Yrs
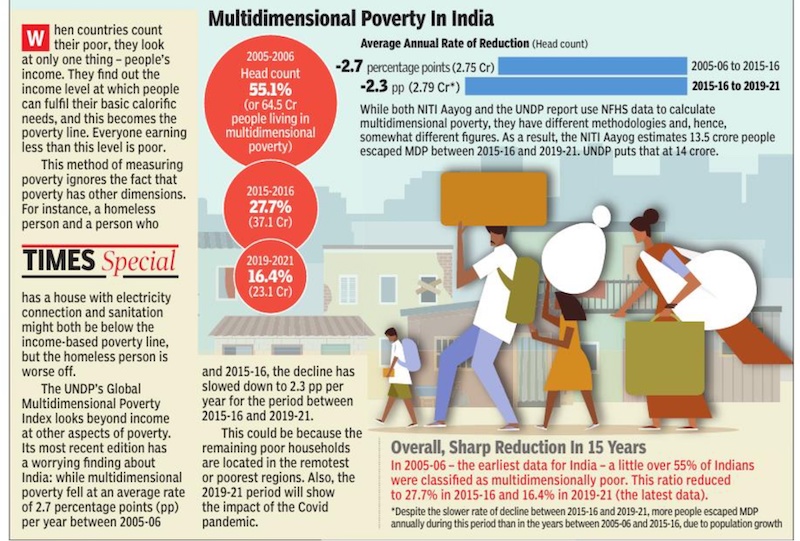
Multidimensional poverty measures diverse socio-economic indicators to provide a comprehensive picture of well-being. Between 2005-06 and 2019-21, the share of Indians facing multidimensional poverty fell from 55% to 16%. In absolute terms the number came down from 64 crore to 23 crore.
2 Gains Span The Kitchen And Classroom
Niti Aayog’s Multidimensional Poverty Index (MPI) seeks to measure poverty that goes beyond traditional income-based metrics. The three dimensions of health, education, and standard of living are further broken down into 10 indicators, all of which have seen substantial improvements in recent years.
3 But Big Picture Hides Stark Differences
Despite the overall decrease in MPI, certain states continue to lag, pulling the national average down. Bihar, Jharkhand and UP are among the states with the highest levels of multidimensional poverty, facing persistent challenges across multiple indicators, including nutrition, sanitation, and education.
4 North, North-East Lag The Most
Poor nutrition is a major contributor to multidimensional poverty in nearly every state while those with better access to education and healthcare services tend to have lower MPI scores. Investment in health, education, and living standards can drive improvements that would further reduce multidimensional poverty.
Multi-dimensional poverty index
India: 2005-21
July 21, 2023: The Times of India
From: July 21, 2023: The Times of India
Poverty isn’t just about low income. Lack of home ownership, nutrition and education matters, too. Between 2005-06 and 2015-16, India made strides in providing the poor with these basics. But progress has slowed a tad since. Covid didn’t help and a lower base could be making a difference too, writes Atul Thakur
India, South Asia in 2021
Nov 28, 2021: The Times of India
From: Oct 13, 2021: The Times of India
See graphic:
Bangladesh, Brazil, China, India, Nepal, Pakistan Sri Lanka on the Multi-dimensional poverty index, 2021
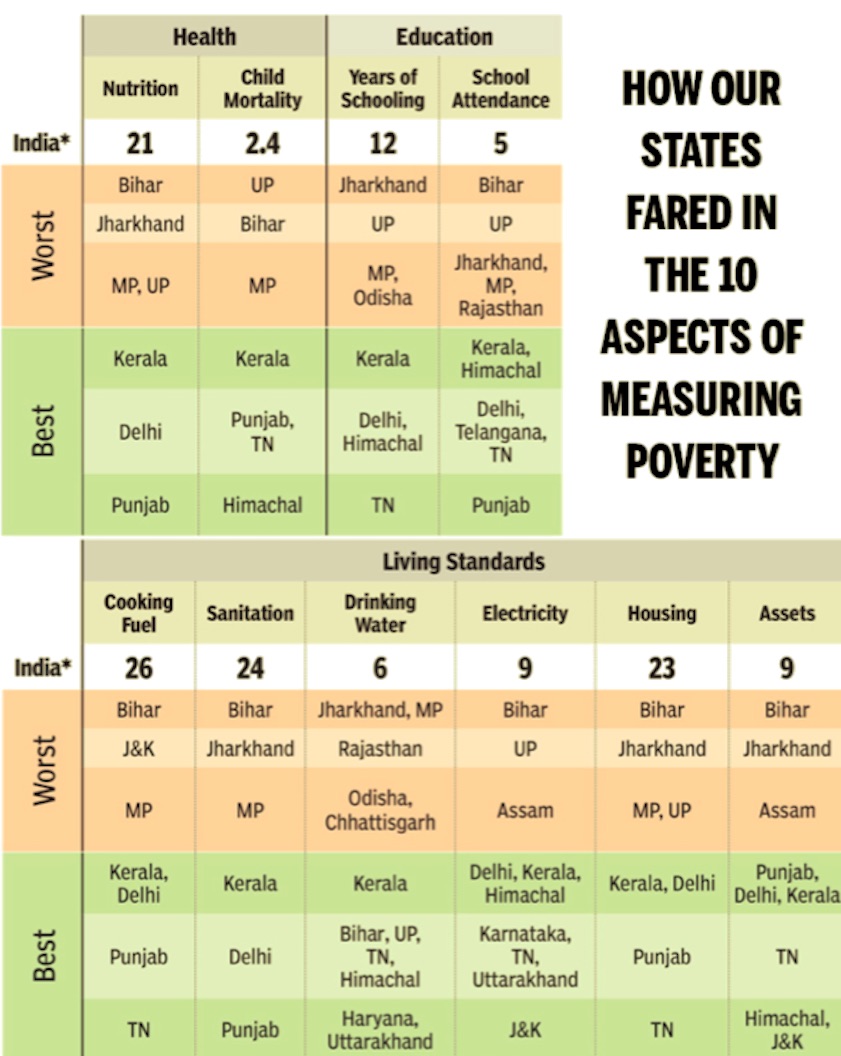
Bihar, with its dismal scores across key development indicators such as nutrition, child and adolescent mortality, maternal health, years of schooling, sanitation and electricity, has topped the list of states with the largest share of population who are poor, according to a report released by the government think tank Niti Aayog.
More than 50% of Bihar’s population has been classified as poor under the national Multidimensional Poverty Index (MPI), followed by Jharkhand (42.2%), UP (37.8%), Madhya Pradesh (36.7%) and Meghalaya (32.7%). Kerala has the least number of poor with only 0.7% of its population classified as such. Among the Union territories, 27.4% of Dadra and Nagar Haveli’s population is poor, according to the MPI parameters.
“The headcount ratio answers the question: ‘How many are poor?’ India’s national MPI identifies 25.01% of the population as multi-dimensionally poor,” the report. The headcount ratio measures the multidimensionally poor in the total population.
The data showed 51.9% of the population in Bihar is deprived of nutrition, followed by Jharkhand (47.8%), Madhya Pradesh (45.5%) and UP (44.5%). Sikkim has the lowest percentage of population deprived of nutrition at 13.3%. According to the report, a household is considered deprived if any child between the ages of 0 to 59 months, or woman between the ages of 15 to 49 years or man between the ages of 15 to 54 years — for whom nutritional information is available — is found to be under nourished.
The national MPI baseline report based on the National Family Health Survey-4 (2015-16) has been developed by Niti Aayog in consultation with 12 ministries and in partnership with state governments and the index publishing agencies — Oxford University’s Oxford Poverty and Human Development Initiative (OPHI) and United Nations Development Programme (UNDP).
UP is on top of the list with a population of nearly 5% categorised as deprived under child and adolescent mortality, followed by Bihar (4.6%), Madhya Pradesh (3.6%), Chattisgrah (3.3%) and Jharkhand (3.3%). Under maternal health, Bihar tops the chart with 45.6% categorised as deprived, followed by Uttar Pradesh (35.5%), Jharkhand (33.1%) and Nagaland (33.1%).
Among Union territories, Delhi has a share of 15.2% of the population categorised as deprived under maternal health. A household is deprived if any woman in the family, who has given birth in the five years preceding the survey, has not received at least four ante-natal care visits for the most recent birth, or has not received assistance from trained skilled medical personnel during the most recent childbirth, report said while elaborating on the methodology.
India vis-a-vis other countries
8 Indian states poorer than Africa’s 26 poorest
London: Eight Indian states, including Bihar, Uttar Pradesh and West Bengal, together account for more poor people than the 26 poorest African nations combined, a new ‘‘multidimensional’’ measure of global poverty has said.
The Multidimensional Poverty Index (MPI) was developed and applied by the Oxford Poverty and Human Development Initiative (OPHI) with UNDP support and will feature in the forthcoming 20th anniversary edition of the UNDP Human Development Report due late October. The MPI, which supplants the Human Poverty Index, assesses a range of critical factors or ‘‘deprivations’’ at the household level: from education to health outcomes to assets and services.
An analysis by MPI creators reveals that there are more ‘MPI poor’ people in eight Indian states (42.1 crore in Bihar, Chhattisgarh, Jharkhand, Madhya Pradesh, Orissa, Rajasthan, Uttar Pradesh, and West Bengal) than in the 26 poorest African countries combined (41 crore).
In fact, according to the new measure that includes key services such as water, sanitation and electricity, half of the world’s poor live in South Asia (51% or 84.4 crore) and one quarter in Africa (28% or 45.8 crore).
Niger has the greatest intensity and incidence of poverty in any country, with 93% of its population classified as poor in MPI terms.
AGENCIES Deprivation Count 42 crore poor in Bihar, Jharkhand, UP, Madhya Pradesh, Chhattisgarh, Orissa, Rajasthan and West Bengal compared to 41 crore in 26 of Africa’s poorest countries Half of world’s poor (48.4cr) live in south Asia, a quarter in Africa (45.8crore), says new Multi-dimensional Poverty Index Of 104 countries surveyed (5.2bn people in all), 1.7bn live in poverty
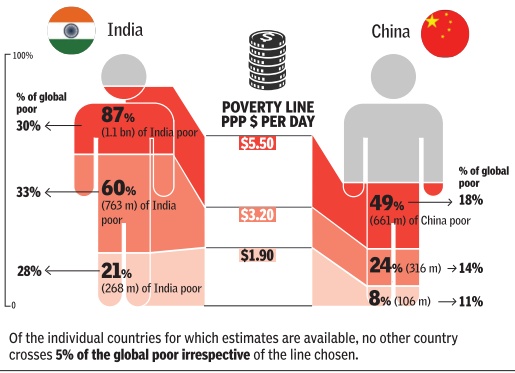
From: NEW LINES, BUT INDIA STILL HOME TO BIGGEST CHUNK OF GLOBAL POOR, November 2, 2017: The Times of India
In November 2017, the World Bank has started reporting poverty rates for all countries using two new international poverty lines: a lower middle-income line, set at $3.20 per day, and an upper middle-income line, set at $5.50 per day. These are in addition to the main poverty line of $1.90 per day. The new lines are supposed to serve two purposes. One, they account for the fact that “achieving the same set of capabilities may need a different set of goods and services in different countries“ and, specifically, a costlier set in richer countries. Second, “they allow for cross-country comparisons and benchmarking both within and across developing regions“.Using the $1.90 line, the incidence of poverty in lower middle-income countries is 15.5%, as against 45.8% in low-income countries. However, using the $3.20 line, 46.7% of the population of lower middle-income countries is poor. Similarly, for upper middle-income countries, the proportion of the poor at $1.90 is just 2.3%, but at $ 5.50 it is 29.2%.
2016-18: India’s international position improves
June 27, 2018: The Times of India
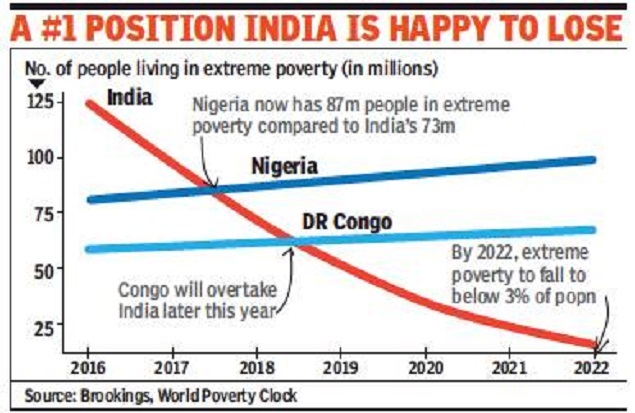
From: June 27, 2018: The Times of India
HIGHLIGHTS
India has finally shed the dubious distinction of being home to the largest number of poor, with Nigeria taking that unwanted position in May 2018
If present trends continue, India could drop to No. 3 later this year, with the Democratic Republic of the Congo taking the number 2 spot
In the time that it takes you to read this article, several Indians will have escaped the clutches of extreme poverty. In fact, about 44 Indians come out of extreme poverty every minute, one of the fastest rates of poverty reduction in the world. As a result, India has finally shed the dubious distinction of being home to the largest number of poor, with Nigeria taking that unwanted position in May 2018.
If present trends continue, India could drop to No. 3 later this year, with the Democratic Republic of the Congo taking the number 2 spot. Defining extreme poverty as living on less than $1.9 a day, a recent study published in a Brookings blog says that by 2022, less than 3% of Indians will be poor and extreme poverty could be eliminated altogether by 2030.
The study, published in the ‘Future Development’ blog of Brookings, says, “At the end of May 2018, our trajectories suggest that Nigeria had about 87 million people in extreme poverty, compared with India’s 73 million. What is more, extreme poverty in Nigeria is growing by six people every minute, while poverty in India continues to fall.”
However, the estimates of extreme poverty reduction may not match with Indian numbers because of differences in how poverty is measured. According to the World Bank, between 2004 and 2011 poverty declined in India from 38.9% of the population to 21.2% (2011 purchasing power parity at $1.9 per person per day).
Economists said the finding of the study supports the argument that rapid economic growth had helped make a dent in extreme poverty. “Basically it supports the growth story and the 1991 economic reforms that have helped reduce poverty,” said N R Bhanumurthy, professor at the National Institute of Public Finance and Policy. “Going ahead, the challenge is to meet the Sustainable Development Goals, which will help realise the study’s findings that India would be able to eliminate extreme poverty by 2030,” he said.
Bhanumurthy said the assumption that India would be able to eliminate extreme poverty by 2030 seems realistic given the country’s record in the past 10 years in reducing poverty and its ability to meet the Millennium Development Goals. “But to achieve that we must continue to grow at 7%-8% for the remaining period,” he said. The UN-sponsored Sustainable Development Goals aim to eliminate global poverty by 2030.
The benchmark projections of poverty by country imply a high speed of poverty reduction in South Asia, East Asia and the Pacific, fuelled by the high rates of income per capita growth in India, Indonesia, Bangladesh, the Philippines, China and Pakistan, the study says. It showed global income increases in the last decades have led to systematic decreases in poverty rates worldwide, with the experience in India and China having played the most important role when it comes to the overall number of persons escaping absolute poverty.
At the heart of the study is the World Poverty Clock. It takes into account household surveys and projections of economic growth from the IMF’s World Economic Outlook. These form the basic building blocks for poverty trajectories computed for 188 countries. The study said that Africa accounts for about two-thirds of the world’s extreme poor.
If current trends persist, they will account for nine-tenths by 2030. Fourteen out of 18 countries in the world where the number of extreme poor is rising are in Africa, it added. The study model estimated that on September 1, 2017, 647 million people lived in extreme poverty. “Every minute 70 people escape poverty (or 1.2 people per second). This is close to the Sustainable Development Goal target (92 people per minute, or 1.5 per second) and allows us to estimate that around 36 million people have escaped extreme poverty in the year 2016,” it added.
Decline
2005-12
Number of poor reduced from 407 million to 269 million
Why no applause for 138 million exiting poverty?
Swaminathan S Anklesaria Aiyar
The Times of India 2013/07/28
When China reduced people in poverty by 220 million between 1978 and 2004, the world applauded this as the greatest poverty reduction in history. Amartya Sen, Joseph Stiglitz and all other poverty specialists cheered.
India has just reduced its number of poor from 407 million to 269 million, a fall of 138 million in seven years between. This is faster than China’s poverty reduction rate at a comparable stage of development, though for a much shorter period. Are the China-cheerers hailing India for doing even better?
No, many who hailed China are today rubbishing the Indian achievement as meaningless or statistically fudged. This includes the left, many NGOs and some TV anchors. The double standard is startling.
The Tendulkar Committee determined India’s poverty definition. The Tendulkar poverty line in 2011-12 came to Rs 4,000 per rural and Rs 5,000 per urban family of five. Critics say this is ridiculously low. But it is roughly equal to the World Bank’s well-established poverty line of $1.25 per day in Purchasing Power Parity terms (which translates into around 50 cents/day in current dollars). This is used by over 100 countries, by the United Nations and many other international agencies. When the whole world uses this standard, why call it statistical fudge?
When China claimed to have lifted 220 million people out of poverty, guess what its poverty line was? Just $85 per year, or $0.24 per day! Whatever statistical adjustments you make for comparability, it was far lower than today’s Tendulkar line. Did today’s critics of the Tendulkar line castigate China for fudging? No, they sang China’s praises.
Defining extreme (Tendulkar) and moderate poverty (Rangarajan)
The World Bank actually has two lines — $1.25 denoting extreme poverty, and $2 denoting moderate poverty. India can also adopt two lines, the Tendulkar line for extreme poverty and a new Rangarajan line for moderate poverty, at around $2/day.
But this will in no way diminish the great achievement of slashing the number of those historically called poor — we can call them the “extreme poor”— by 138 million in seven years. Allowing for rising population in this period, the number saved from extreme poverty is even higher at 180 million.
Given our rising GDP and expectations, we can rename the Tendulkar line as our extreme poverty line. But to condemn it as statistical fudge is ridiculous. The $1.25 line is a world standard, even if it is below the cynics’ line. Indian critics may not accept it, but the world will.
A higher poverty line is drawn
There is, of course, the separate issue of who should be entitled to various government subsidies, including food subsidies. Economists talk of targeting subsidies at those below the Tendulkar line. But for politicians, the aim of subsidies is to win votes. And clearly you win more votes by extending subsidies to two-thirds of the population, rather than the poorest one-third.
This spread of subsidies to those above the extreme poverty line was once called “leakages to the non-poor.” But it is considered good politics even if it is bad economics. This explains why the government chose to cover 67% of the population in the Food Security Bill, even though the poverty ratio at the time was 30%.
However, critics quickly exposed this as a double standard. They asked, if your Food Security Bill views two-thirds of the people as needy, how could you have a poverty line saying only one third are poor? The government found it difficult to say this was good politics even if it was bad economics. Instead, it appointed the Rangarajan Committee to devise a higher poverty line. This line will almost certainly be around the moderate poverty line ($ 2/day in PPP terms) of the World Bank.
Many critics and TV anchors will cheer at the prospect of freebies to two-thirds of the population. Yet here lie the seeds of fiscal disaster. India is poor because it has spent too much on ill-targeted subsidies, leaving too little for infrastructure and effective education that will raise incomes permanently. Total subsidies (mostly non-merit subsidies) exploded in the 1980s, reaching 14.5 % of GDP, almost as much as all central and state tax revenue. This ended in a fiscal and balance of payments crisis in 1991.
The risk of a new poverty line of $2/day is that it will create political demands for more freebies to twothird of the population. That will further erode limited funds for productive spending.
In theory we can limit subsidies to the poorest and cut out unworthy subsidies. In practice, the combined pressure of vote banks and TV anchors threatens to raise subsidies beyond all prudent limits. There lie the seeds of another 1991-style disaster.
2005-16
2005-16: Over 270m in India moved out of poverty
‘Over 270m in India moved out of poverty in 10 years’, September 21, 2018: The Times of India
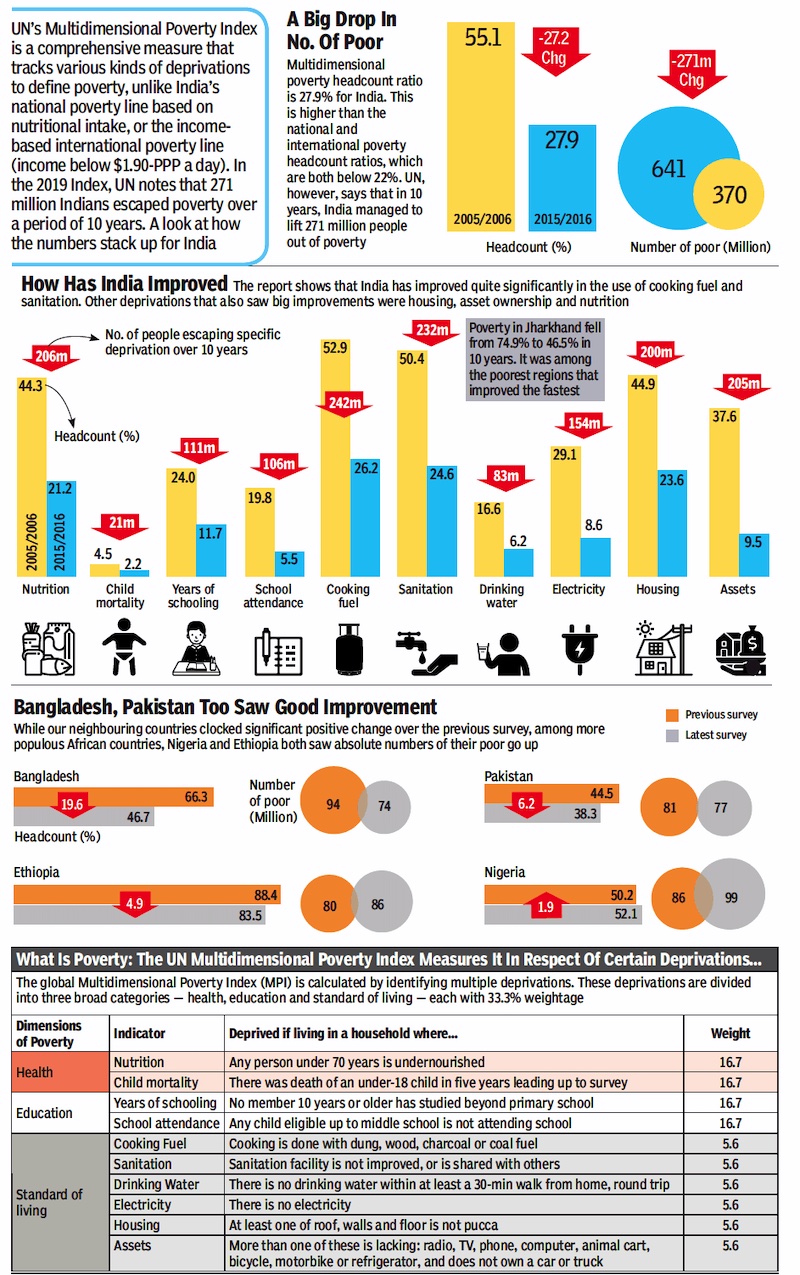
From: July 13, 2019: The Times of India
See graphic:
2005-16: Over 27 crore Indians moved out of poverty
Over 270 million people in India moved out of poverty in the decade since 2005-06 and the poverty rate in the country nearly halved over the 10-year period, a promising sign that poverty is being tackled globally, according to latest estimates.
The 2018 global Multidimensional Poverty Index released here by the United Nations Development Programme and the Oxford Poverty and Human Development Initiative noted that in India, 271 million moved out of poverty between 2005/06 and 2015/16. The country’s poverty rate has nearly halved, falling from 55%to 28% over the 10-year period.
India is the first country for which progress over time has been estimated. “Although the level of poverty is staggering, so is the progress that can be made in tackling it” UNDP administrator Achim Steiner said. PTI
1.3bn live in poverty globally, says report
The 2018 global Multidimensional Poverty Index (MPI) released here by the United Nations Development Programme (UNDP) and the Oxford Poverty and Human Development Initiative (OPHI) said that about 1.3 billion people live in multidimensional poverty globally.
This is almost a quarter of the population of the 104 countries for which the 2018 MPI is calculated. Of these 1.3 billion, almost half — 46% — are thought to be living in severe poverty and are deprived in at least half of the dimensions covered in the MPI, it said.
While there is much that needs to be done to tackle poverty globally, there are “promising signs that such poverty can be, and is being, tackled”.
“The Multidimensional Poverty Index gives insights that are vital for understanding the many ways in which people experience poverty, and it provides a new perspective on the scale and nature of global poverty while reminding us that eliminating it in all its forms is far from impossible,” UNDP administrator Achim Steiner said.
Although similar comparisons over time have not yet been calculated for other countries, the latest information from UNDP’s Human Development Index shows significant development progress in all regions, including many sub-Saharan African countries.
Between 2006 and 2017, life expectancy increased over seven years in sub-Saharan Africa and by almost four years in South Asia, and enrolment rates in primary education are up to 100%.
This bodes well for improvements in multidimensional poverty.
The new figures show that in 104 primarily low- and middle-income countries, 662 million children are considered multidimensionally poor. In 35 countries, half of all children are poor. The MPI looks beyond income to understand how people experience poverty in multiple and simultaneous ways.
It identifies how people are being left behind across three key dimensions: health, education and living standards, lacking such things as clean water, sanitation, adequate nutrition or primary education. Those who are deprived in at least a third of the MPI’s components are defined as multidimensionally poor. AGENCIES
The estimates showed that half of all people living in poverty are younger than 18 years
…according to the Multidimensional Poverty Index
Is this the best news for India in over a decade?, September 22, 2018: The Times of India
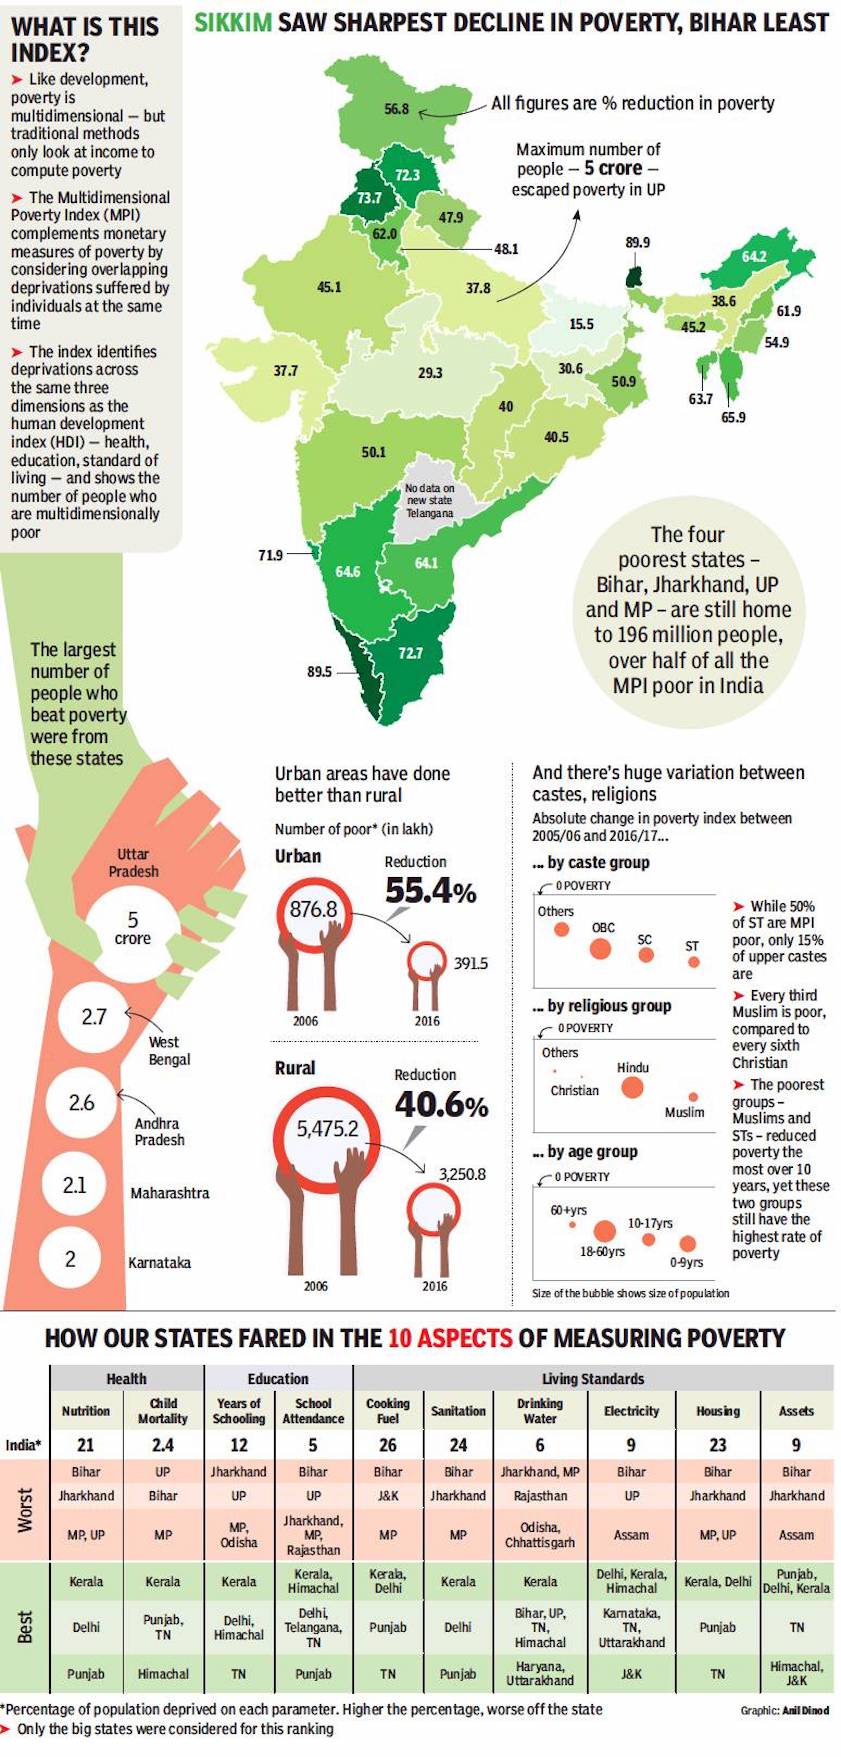
i) Per cent reduction in poverty in the various states of India ;
ii) The largest number of people (absolute numbers) who rose above the poverty were from these states;
iii) The reduction in poverty in urban and rural areas;
From: Is this the best news for India in over a decade?, September 22, 2018: The Times of India
From: Is this the best news for India in over a decade?, September 22, 2018: The Times of India
From: Is this the best news for India in over a decade?, September 22, 2018: The Times of India
India has made tremendous progress in pulling its people out of poverty. Over a 10-year period between 2005-06 and 2015-16, 271 million people moved out of poverty, with the country’s poverty rate nearly halving — falling from 55% to 28%. But there’s still a huge discrepancy between states. While Kerala has performed consistently well, some states like Bihar have struggled to better their lot. These are the findings of a UN report that takes a holistic view of poverty, factoring in education, health and standard of living to come up with an index of poverty.
WHAT IS THIS INDEX?
Like development, poverty is multidimensional — but traditional methods only look at income to compute poverty.
The Multidimensional Poverty Index (MPI) complements monetary measures of poverty by considering overlapping deprivations suffered by individuals at the same time.
The index identifies deprivations across the same three dimensions as the human development index (HDI) — health, education, standard of living — and shows the number of people who are multidimensionally poor.
2005-21
415 million people exited multidimensional poverty
TNN, Oct 18, 2022: The Times of India
NEW DELHI: As many as 415 million people exited multidimensional poverty in India in 15 years (2005/06 to 2019/21) with the incidence of poverty showing a steep decline from 55.1% to 16.4%, states the Global Multidimensional Poverty Index 2022. The United Nations Development Programme while citing this to be a "tremendous gain and a historic change" also highlights in the report the challenges as India continues to have the largest number of poor people worldwide at 228.9 million in 2020.
The report states that across states and UTs the fastest poverty reduction in relative terms was in Goa, followed by Jammu & Kashmir, Andhra Pradesh, Chhattisgarh and Rajasthan.
The report also shows that West Bengal is the only state of the 10 poorest states in 2015/16 to move out of this category in 2019/2021. The rest- Bihar, Jharkhand, Meghalaya, MP, UP, Assam, Odisha, Chhattisgarh and Rajasthan-remain among the 10 poorest. However, Bihar, the poorest state in 2015/16, saw the fastest reduction in MPI value in absolute terms. The incidence of poverty in Bihar fell from 77.4% in 2005/06 to 52.4% in 2015/16 and further down to 34.7% in 2019/21. Deprivations in sanitation, cooking fuel, and housing declined the most from 2015/16 to 2019/21.
UNDP India in a statement observed that "India's success, with 415 million people exiting multidimensional poverty, has significantly contributed to the decline in poverty in South Asia. In a first, South Asia is not the region with the highest number of poor people, at 385 million, compared with 579 million in Sub-Saharan Africa."
The report produced by UNDP and the Oxford Poverty and Human Development Initiative (OPHI), assesses poverty by considering various deprivations experienced by people across health, education, and standard of living. The data used to estimate the 2022 global MPI values were gathered from across 111 countries. Multidimensional poverty is measured across 10 indicators related to health, education and standard of living.
Children are still the poorest age group, with more than one in five children being poor, compared with around one in seven adults. This translates to 97 million poor children - more than the total number of poor people in any other country covered by the global MPI. The report makes it clear that the most recent data for MPI were collected pre-pandemic, so the effects of Covid-19 and subsequent impact on poverty in India cannot be assessed yet.
2005- 22: Major decline in poverty but big wealth disparity
Nov 8, 2023: The Times of India
NEW DELHI: The latest UNDP report that assesses progress on human development in the Asia-Pacific region places India among the countries with the highest income and wealth inequalities measured in terms of the share of the richest 10% of the population. However, since 2005 India has managed to get around 415 million people out of multidimensional poverty.
According to the report, other countries with highest income inequality in the region are Maldives, Thailand and Iran.
Besides India, countries exhibiting highest wealth inequalities, as measured by wealth share of the top 10%, include Thailand, China, Myanmar and Sri Lanka.
Over the decades, India has improved living standards and significantly reduced poverty despite rising inequalities, says the 2024 Regional Human Development Report. In India, between 2000 & 2022, per capita income soared from $442 to $2,389. Between 2004 & 2019, poverty rates (based on international poverty measure of $2.15 per day) plummeted from 40% to 10%. For example, between 2005 & 2006 and 2019 & 2020, India decreased its multi-dimensional poverty index by 39 percentage points, lifting 415 million out of multidimensional poverty. Moreover, between 2015-16 & 2019-21, the share of population living in multidimensional poverty fell from 25 to 15%.
“Despite these successes, poverty remains persistently concentrated in states that are home to 45% of India’s population but contain 62% of its poor. In addition, many other people are vulnerable, hovering just above the poverty line,” the report finds.
The report also draws attention to the fact that India has a demographic advantage in terms of rapidly expanding youth population (15-24 years).
“India is contributing significantly to the growth in the global middle class-encompassing those living between $12 and $120 a day. India is expected to contribute 24% to the global middle-class growth (192 million people),” it said.
The report highlights that there are lessons for others to learn from India’s digital success story. It cited how CoWIN became the digital backbone of one of the world’s largest vaccination programmes and UPI, with 260 million users, facilitated over 2,000 transactions per second in 2022.
2010> 19
India had the biggest reduction in the number of multi-dimensionally poor people estimated at 273 million during the 2005-15 period, a UN report has said.
The data, released by United Nations Development Programme (UNDP) and Oxford Poverty and Human Development Initiative (OPHI), showed that 65 of the 75 countries studied significantly reduced multidimensional poverty levels between 2000 and 2019.
Four countries — Armenia (2010–2015/2016), India (2005/2006–2015/2016), Nicaragua (2001–2011/2012) and North Macedonia (2005/2006–2011) — halved their global MPI (multidimensional poverty index) value and did so in 5.5–10.5 years. These countries show what is possible for countries with very different initial poverty levels. They account for roughly a fifth of the world’s population, mostly because of India, the report said. The multidimensional index is a measure that looks beyond income to include access to safe water, education, electricity, food, and six other indicators.
But the impact of Covid-19 may slow down efforts to reduce multidimensional poverty. The pandemic unfolded in the midst of this analysis. While data is not yet available to measure rise of global poverty after the pandemic, simulations based on different scenarios suggest that, if unaddressed, progress across 70 developing countries could be set back by 3–10 years, the report said.
“Covid-19 is having a profound impact on the development landscape. But this data — from before the pandemic — is a message of hope. Past success stories on how to tackle the many ways people experience poverty in their daily lives can show how to build back better and improve the lives of millions,” said Sabina Alkire, director of Ophi at the University of Oxford.
Among the 1.3 billion people still living in multidimensional poverty today, more than 80% are deprived in at least five of the ten indicators used to measure health, education and living standards in the global MPI. The data also reveals that the burden of multidimensional poverty disproportionately falls on children. Half of the 1.3 billion poor have not yet turned 18, while 107 million are 60 or older, the report said.
Children show higher rates of multidimensional poverty: half of multidimensionally poor people (644 million) are children under age 18. One in three children is poor compared with one in six adults, the report said.
2011-12: I
Odisha, Bihar show biggest drop in percentage of poor
Mahendra Singh, TNN | Jul 24, 2013
Odisha and Bihar
Odisha and Bihar have registered the sharpest decline in poverty levels between 2004-05 and 2011-12, although the proportion of the poor in these states remains well above the national average.
Latest data released on Tuesday revealed that in Odisha, the proportion of people below the poverty line (BPL) in total population came down from 57.2% in 2004-05 to 32.6% in 2011-12, a decline of 24.6 percentage points.
In Bihar, which logged the fastest growth rate during the 11th five-year plan (2007-12), the share of BPL in total population was estimated at 33.7% in 2011-12, compared to 54.4% in 2004-05, a reduction by 20.7 percentage points.
All-India
At the all-India level, the share of the BPL population was estimated at 21.9%, which is almost 270 million. This means that roughly every fifth Indian lives below the poverty line. The government has set the bar low, defining anyone earning Rs 27.20 or less in rural areas as BPL, while those earning up to Rs 33.30 a day in urban areas are classified as poor, though these benchmarks vary from state to state.
Bimaru
Although things seem to looking up in the poor states, especially Bimaru, they still remain home to the maximum number of poor people in the country. While Uttar Pradesh has just under 30% of its population in the BPL group, the number adds up to almost 60 million. Bihar, despite the improvement, still has 35.8 million poor, and ranks second, followed by Madhya Pradesh where 23.4 million or 31.6% of the population is BPL.
Rajasthan
Among the Bimaru states, only Rajasthan has managed to do better than the national average with the share of BPL in total population estimated at 14.7% in 2011-12, compared to 34.4% in 2004-05. In fact, the state now is a better performer than Gujarat, famed for its rapid growth and good infrastructure. The state ruled by Narendra Modi had 16.6% people below the poverty line.
Rural India has seen faster improvement than urban centres
The other important trend coming from the latest poverty estimates, which have traditionally created controversy, is the fact that rural India has seen faster improvement than urban centres. The decline in poverty was steeper in rural areas as BPL population came down to 25.8% (2011-12) from 42% (2004-05), around 17 percentage points, as against around 12 percentage points in urban areas.
On an all-India basis, there were 217 million poor in rural areas and 53 million in urban areas in 2011-12, as against 326 million and 81 million, respectively, in 2004-05.
The final figures for 2011-12 are likely to be revised once a government-appointed committee under C Rangarajan submits its report on a new methodology for fixing the poverty line, but the Planning Commission in its press release pointed out that this would only change the numbers, not the declining trend.
2011-12: II
This article contains many points given in the article above.
Poverty declines to 21.9% in 2011-12: Planning Commission
According to the commission, in 2011-12 for rural areas, the national poverty line by using the Tendulkar methodology is estimated at Rs 816 per capita per month in villages and Rs 1,000 per capita per month in cities.
PTI | Jul 23, 2013
NEW DELHI: Poverty ratio in the country has declined to 21.9% in 2011-12 from 37.2% in 2004-05 on account of increase in per capita consumption, Planning Commission said.
The poverty ratio in 2011-12
The percentage of persons below poverty line in 2011-12 has been estimated at 25.7% in rural areas, 13.7% in urban areas and 21.9% for the country as a whole, a commission's press statement said.
The percentage of persons below poverty line in 2004-05 was 41.8% in rural areas, 25.7% in cities and 37.2% in the country as a whole.
In actual terms, there were 26.93 crore people below poverty line in 2011-12 as compared to 40.71 crore in 2004-05.
Suresh Tendulkar committee’s methodology
This ratio for 2011-12 is based on the methodology suggested by Suresh Tendulkar committee which factors in money spent on health and education besides calorie intake to fix a poverty line.
The commission said the decline in poverty is mainly on account of rising real per capita consumption figures which is based on 68th round of National Sample Survey on household consumer expenditure in India in 2011-12.
Earlier, a committee was appointed under Prime Minister's economic advisory council chairman C Rangarajan to revisit the Tendulkar committee methodology for tabulating poverty.
The committee is expected to submit its report by mid 2014.
Best and worst states
State-wise, the commission said the poverty ratio was highest in Chhattisgarh at 39.93% followed by Jharkhand (36.96%), Manipur (36.89%), Arunachal Pradesh (34.67%) and Bihar (33.47%).
Among the union territories, the Dadra and Nagar Haveli was the highest, with 39.31% people living below poverty line followed by Chandigarh at 21.81%.
Goa has the least percentage of people living below poverty line at 5.09% followed by Kerala (7.05%), Himachal Pradesh (8.06%), Sikkim (8.19%), Punjab (8.26%) and Andhra Pradesh (9.20%).
2011-12: BPL population
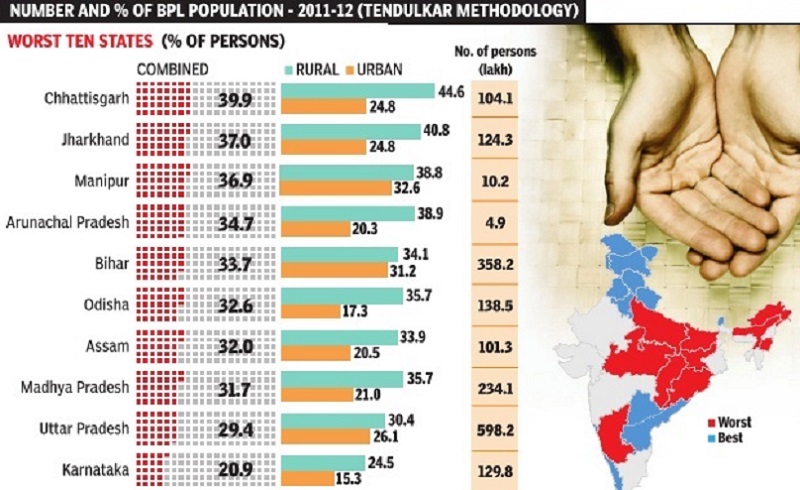
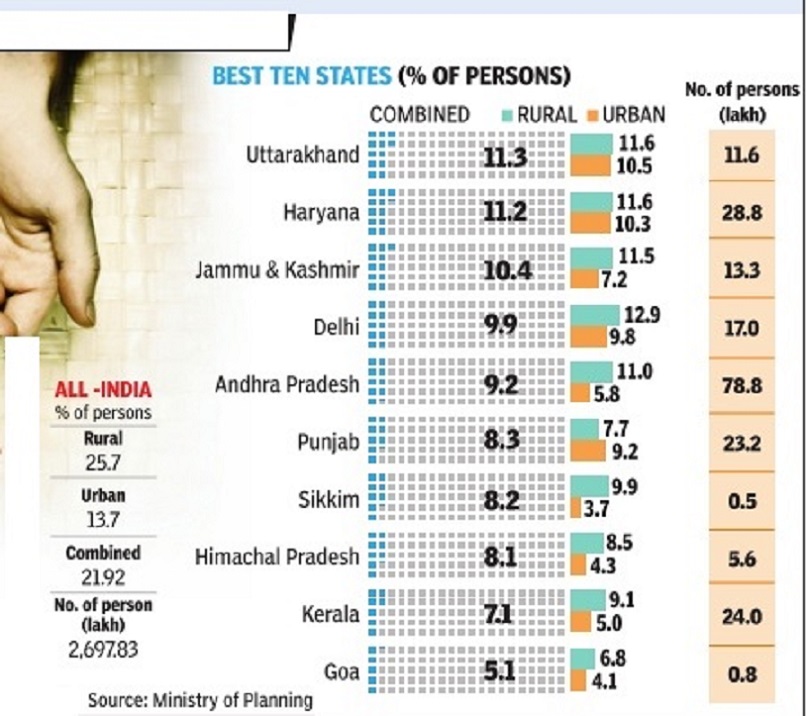
Mar 20 2015
There are two ways to measure poverty--relative and absolute. Poverty estimates in advanced economies are based on the calculation of relative poverty, with the average standard of living used as the reference point. People are counted as poor if they cannot maintain this level. In India, poverty is estimated at absolute level or the minimum money required for subsistence. The poverty line is defined as the minimum money required for maintaining a per capita caloric intake of 2,100 calories in an urban area and 2,400 calories in a rural area. These estimates are done by analysing monthly per capita expenditure baskets of NSSO surveys.By this methodology, Chhattisgarh, Jharkhand, Manipur, Arunachal Pradesh and Bihar have the highest proportion of BPL persons in the latest estimates.
2011-12: Rangarajan panel's estimate: III
3 out of 10 in India are poor: Rangarajan panel
PTI | Jul 6, 2014
The Rangarajan committee was set up in 2013 to review the Tendulkar committee methodology for estimating poverty and clear the ambiguity over the number of poor in the country.
NEW DELHI: A panel headed by former Prime Ministers economic advisory council chairman C Rangarajan has dismissed the Tendulkar committee report on estimating poverty and said that the number of poor in India was much higher in 2011-12 at 29.5 per cent of the population, which means that three out of 10 people are poor.
As per the report submitted by Rangarajan to planning minister Rao Inderjit Singh earlier, persons spending below Rs 47 a day in cities would be considered poor, much above the Rs 33-per-day mark suggested by the Suresh Tendulkar committee.
As per the Rangarajan panel estimates, poverty stood at 38.2 per cent in 2009-10 and slided to 29.5 per cent in 2011-12.
This is at variance with the Tendulkar methodology under which poverty was estimated at 29.8 per cent in 2009-10 and declined to 21.9 per cent in 2011-12.
The Planning Commission's estimates based on Tendulkar committee had drawn flak in September 2011, when in an affidavit to the Supreme Court it was stated that households with per capita consumption of more than Rs 33 in urban areas and Rs 27 in rural areas would not be treated as poor.
The Rangarajan committee was set up last year to review the Tendulkar committee methodology for estimating poverty and clear the ambiguity over the number of poor in the country. As per Rangarajan panel estimates, a person spending less than Rs 1,407 a month (Rs 47/day) would be considered poor in cities, as against the Tendulkar Committee's suggestion of Rs 1,000 a month (Rs 33/day).
In villages, those spending less than Rs 972 a month (Rs 32/day) would be considered poor. This is much higher than Rs 816 a month (Rs 27/day) recommended by Tendulkar Committee.
In absolute terms, the number of poor in India stood at 36.3 crore in 2011-12, down from 45.4 crore in 2009-10, as per the Rangarajan panel.
Tendulkar Committee, however, had suggested that the number of poor was 35.4 crore in 2009-10 and 26.9 crore in 2011-12.
II
New poverty line: Rs 32 per day in villages, Rs 47 in cities
Mahendra Kumar Singh New Delhi:
TNN
The Times of India Jul 07 2014
Rangarajan Panel Puts Number Of Poor At 363m
Those spending over Rs 32 a day in rural areas and Rs 47 in towns and cities should not be considered poor, an expert panel headed by former RBI governor C Rangarajan said in a report submitted to the BJP government last week.
The recommendation, which comes just ahead of the budget session of Parliament, is expected to generate fresh debate over the poverty measure as the committee's report has only raised the bar marginally . Based on the Suresh Tendulkar panel's recommendations in 2011 12, the poverty line had been fixed at Rs 27 in rural areas and Rs 33 in urban areas, levels at which getting two meals may be difficult.
The Rangarajan committee was tasked with revisiting the Tendulkar formula for estimation of poverty and identification of the poor after a massive public outcry erupted over the ab normally low poverty lines fixed by UPA government.
The panel's recommendation, however, results in an increase in the below poverty line population, estimated at 363 million in 2011-12, compared with the 270 million estimate based on the Tendulkar formula -a rise of 35%. This means 29.5% of InT dia's population lives below the poverty line as defined by the Rangarajan committee, as against 21.9% according to Tendulkar. For 2009-10, Rangarajan has estimated that the share of BPL group in total population was 38.2%, translating into a decline in poverty ratio by 8.7 percentage points over a twoyear period.
The real change is in urban areas where the BPL number is projected to have nearly doubled to 102.5 million based on Rangarajan's estimates, compared to 53 million based on the previous committee's recommendations. So, based on the new measure, in 2011-12, 26.4% of the people living in urban areas were BPL, compared to 35.1% in 2009-10.
In case of rural areas, the rise is of the order of 20% to 260.5 million, compared to around 217 million based on the Tendulkar formula. Rang arajan's estimates would put the BPL share of total population in rural areas at 30.9%, compared to 39.6% in 2009-10.
Documents accessed by TOI show that the Rangarajan panel has suggested to the government that those spending more than Rs 972 a month in rural areas and Rs 1,407 a month in urban areas in 2011-12 do not fall under the definition of poverty .
If calculated on a daily basis, this translates into a per capita expenditure of Rs 32 per day in rural areas and Rs 47 per day in urban areas in 2011-12.
2011-12: Falls from 21% in 2011-12 to 8.5% in (2023)- NCAER
Sidhartha & Surojit Gupta, July 3, 2024: The Times of India
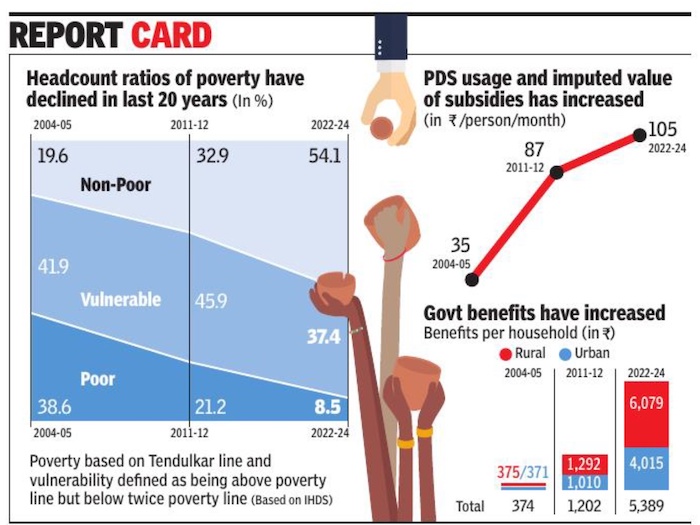
PDS usage and imputed value of subsidies has increased, 2004-24
From: Sidhartha & Surojit Gupta, July 3, 2024: The Times of India
New Delhi : A new survey has estimated poverty to have declined to 8.5% from 21% in 2011-12 and pointed out that chronic poverty has come down but there is a significant proportion of people who can slip back into poverty due to “accident of life”.
Based on the initial findings of the just-concluded India Human Development Survey, it has estimated headcount ratios of poverty using inflation-adjusted poverty line by the Tendulkar Committee, which is used by govt to formulate and implement its schemes. This is lower than the World Bank’s $2.15 international poverty line using the 2017 purchasing power parity.
A paper by economists led by Sonalde Desai of think tank NCAER, which was released on Tuesday, estimated a sharper fall in headcount poverty ratios in rural areas — from 24.8% in 2011-12 to 8.6% now. In urban areas it decreased from 13.4% to 8.4%.
The estimates are higher than SBI Research, which used the NSSO’s Household Consumption Expenditure Survey to estimate rural poverty at 7.2% and urban at 4.6%. In March, former RBI governor C Rangarajan and economist S Mahendra Dev have estimated India’s poverty rate to have declined to 10.8% in 2022-23, compared to 2011-12, based on HCES. Niti Aayog CEO B V R Subhramanyam had recently indicated that the poverty level could be less than 5% based on preliminary estimates on the household consumption expenditure data released by the statistics office.
Desai’s paper estimated that there was a significant in- crease in food subsidy through the public distribution system and other benefits through multiple schemes run by the Centre as well as the states.
It, however, suggested that the approach to social protection must pay greater attention to circumstances of life, such as illness, marriage and natural disasters, which push people into poverty rather than circumstances of birth associated with social identity or region of birth.
Using IHDS data for 2011-12 and 2022-24, the paper estimated that out of 8.5% poor, 3.2% were poor by birth, while 5.3% became poor due to “accident of life”.
“Historically, India’s approach to social safety nets has involved identifying the poor and providing them with priority access to various social protection programmes that include both in-kind and cash assistance—however, the nature of poverty changes with economic growth,” says the paper presented at India Policy Forum, adding that identifying the poor is often a challenge.
The paper said economic growth and poverty decline create a dynamic climate that requires nimble social protection programmes. “Ensuring that social protection systems keep up with the pace of social transformation will be a key challenge facing India as it strives towards equitable development,” it said. It said that flexibility remains key to ensuring effective programme design that can respond to changing conditions. Rights-based approaches that institute pro- grams through legislative acts sometimes create such inflexible systems that they fail the purposes for which they were designed and cites the example of MGNREGS.
The paper has suggested three principles for thinking about safety which include universal programs for a limited set of basic safety nets, risk insurance and building in flexibility and institutional framework.
It proposed that identifying and keeping the core set limited and fully funded is the challenge. “Massive expansion of the number of programs without concomitant resource increase would render this approach futile,” the paper said while detailing the reasons for making universal programs for a limited set of basic safety nets.
2011-23: World Bank’s analysis
April 26, 2025: The Times of India
New Delhi : Over the past decade, India has significantly reduced poverty with extreme poverty declining from 16.2% in 2011-12 to 2.3% in 202223, lifting 171 million people above the poverty line, a World Bank report said.
Rural extreme poverty dropped from 18.4% to 2.8% and urban from 10.7% to 1.1%, narrowing the ruralurban gap from 7.7 to 1.7 percentage points — a 16% annual decline, according to the multilateral agency’s Poverty and Equity Brief.
“India also transitioned into the lower-middle-income category. Using the $3.65 per day LMIC (lower middle income country) poverty line, poverty fell from 61.8% to 28.1%, lifting 378 million people out of poverty,” said the report.
It said rural poverty dropped from 69% to 32.5%, and urban poverty from 43.5% to 17.2%, reducing the rural-urban gap from 25 to 15 percentage points with a 7% annual decline. The five most populous states — Uttar Pradesh, Maharashtra, Bihar, West Bengal, and Madhya Pradesh — accounted for 65% of the country’s extreme poor in 2011-12 and contributed to two-thirds of the overall decline in extreme poverty by 202223, according to the report.
“Nevertheless, these states still accounted for 54% of India’s extremely poor (2022-23) and 51% of the multidimensionally poor (2019-21). As measured by the multidimensional poverty index (MPI), non-monetary poverty declined from 53.8% in 2005-06 to 16.4% by 2019-21,” it said.
The World Bank’s Multidimensional Poverty Measure is at 15.5% in 2022-23. India’s consumption-based Gini index improved from 28.8 in 201112 to 25.5 in 2022-23, though inequality may be underestimated due to data limitations. In contrast, the World Inequality Database shows income inequality rising from a Gini of 52 in 2004 to 62 in 2023.
It said employment growth has outpaced the working-age population since 2021-22. Employment rates, especially among women, are rising, and urban unemployment fell to 6.6% in Q1 FY24/25, the lowest since 2017-18. “Recent data indicates a shift of male workers from rural to urban areas for the first time since 2018-19, while rural female employment in agriculture has grown,” said the report. TNN
2018
South and east lead; central India worst off
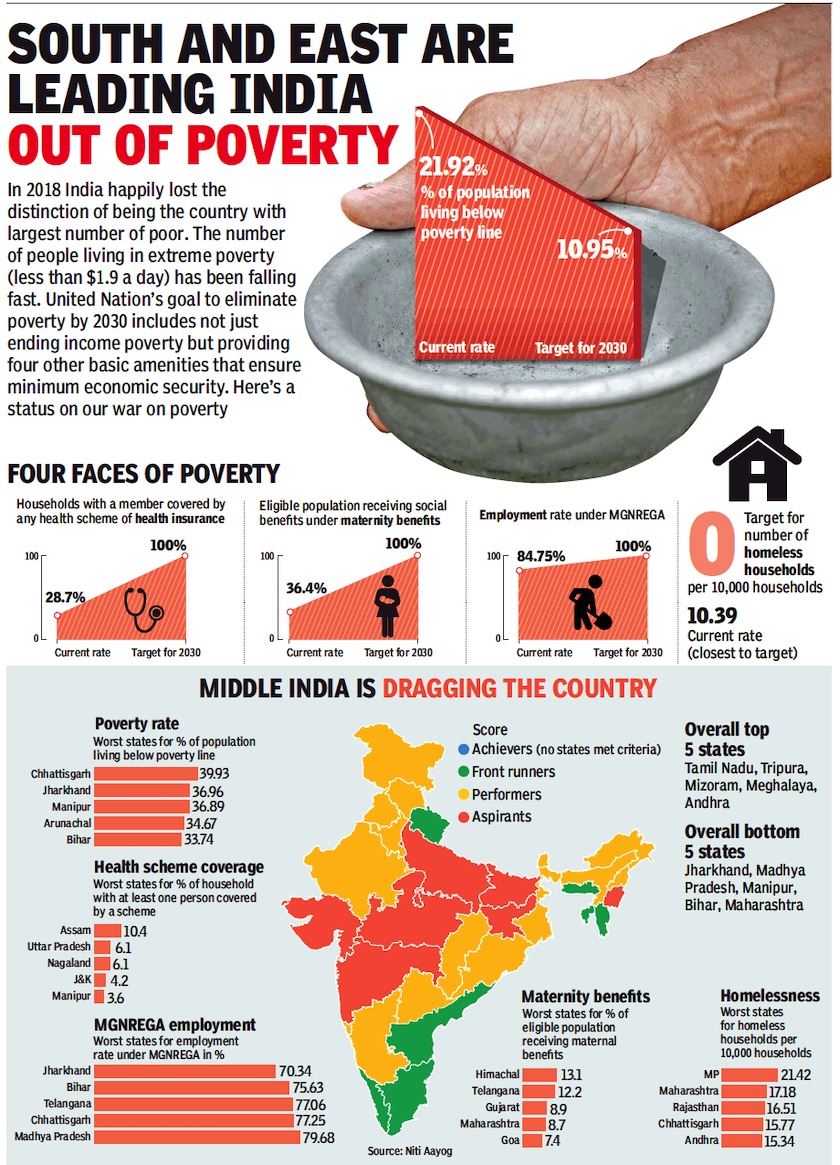
From: April 24, 2019: The Times of India
See graphic :
2018: Poverty decline most in south and east India, and the least in central India.
2017-18
World Data Lab estimates
Surojit Gupta, New data may show big cut in no. of poor, January 27, 2019: The Times of India
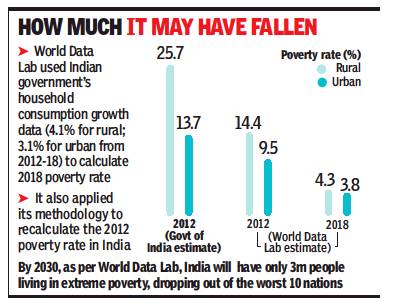
From: Surojit Gupta, New data may show big cut in no. of poor, January 27, 2019: The Times of India
Fresh Govt Numbers To Be Out In June
India may have reduced extreme poverty far more effectively than most of us are aware of. The last official data is eight years old. In 2011, 268 million were surviving on less than $1.90 a day, the World Bank measure for extreme poverty. The next round of data on household consumption is likely to come out in June, and it may well show a drastic drop in the number of poor.
India’s chief statistician Pravin Srivastava told TOI that data will be published in June. Poverty estimates are derived from household consumption data. According to the World Data Lab, which monitors global poverty using advanced statistical models, less than 50 million Indians may be living on less than $1.90 a day now.
“The soon-to-be-largest country in the world has been reducing extreme poverty fast and the world may have underestimated India’s achievements,” a report by thinktank Brookings said.
‘Poverty has declined in India since 2004-05’
India’s last household survey of 2017/18 (to be released in 2019) captures household consumption more comprehensively — it will include an adjustment for owner-occupied housing and measure other items in accordance with international practices,” a report by thinktank Brookings said.
Economists said rapid economic growth and the use of technology for social sector programmes have helped make a significant dent in extreme poverty in the country. “As such there has been a decline in poverty for quite some time. Since 2004-05 there is a sustained decline in extreme poverty,” said N R Bhanumurthy, professor at the National Institute of Public Finance and Policy.
2015-21
July 18, 2023: The Times of India
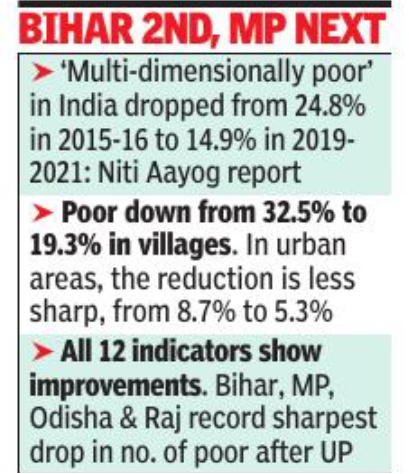
From: July 18, 2023: The Times of India
New Delhi: Nearly 13. 5 crore people moved out of multi-dimensional poverty between 2015-16 and 2019-21 in India with the fastest reduction seen in UP, followed by Bihar, MP, Odisha and Rajasthan, a report released by government think tank Niti Aayog showed.
The country registered a significant decline of 9. 89 percentage points in the number of multi-dimensionally poor from 24. 8% in 2015-16 to 14. 9% in 2019-2021, according to the report. Rural India witnessed the fastest decline in poverty from 32. 5% to 19. 3%. In the same period, the urban areas saw a reduction from 8. 7% to 5. 3%. UP registered the biggest decline in the number of poor with 3. 43 crore people wriggling out of multidimensional poverty.
Details
July 18, 2023: The Times of India
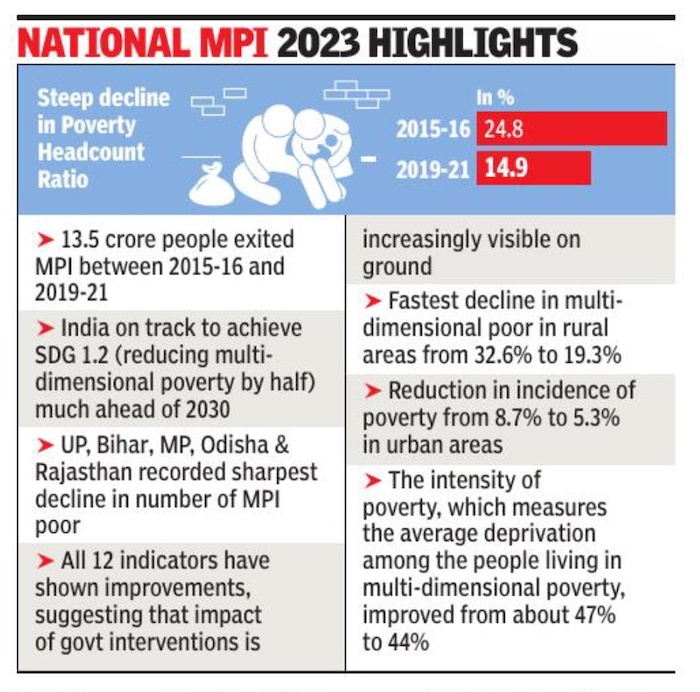
From: July 18, 2023: The Times of India
New Delhi : The Niti Aayog report provides multi-dimensional poverty estimates for India’s 36 states and Union territories and 707 districts. The broad methodology followed is in consonance with the global practices.
Between 2015-16 and 2019-21, the multi-dimensional poverty index (MPI) value has nearly halved from 0.117 to 0.066 and the intensity of poverty has reduced from 47% to 44%, thereby setting India on the path of achieving the SDG target 1.2 (of reducing multi-dimensional poverty by at least half) much ahead of the stipulated deadline of 2030.
“It demonstrates the government’s strategic focus on ensuring sustainable and equitable development and eradicating pov erty by 2030, thereby adhering to its commitment towards the Sustainable Development Goals (SDGs),” according to an official statement. The national MPI measures deprivations across health, education, and standard of living that are represented by 12 SDGaligned indicators. These include nutrition, child and adolescent mortality, maternal health, years of schooling, school attendance, cooking fuel, sanitation, drinking water, electricity, housing, assets, and bank accounts. Marked improvement is witnessed across all the 12 indicators, according to the report.
“I am happy to note that between NFHS (National Family Health Survey)-4 and NFHS-5, all states and UTs have made commendable progress. India’s multi-sectoral approach in addressing poverty has been evident in the reduction of multi-dimensionally poor people to near ly half, accounting for 14.96%, and the improved MPI score highlighted in this edition,” said Niti Aayog vice chairman Suman Bery.
The Centre’s focus on improving access to sanitation, nutrition, cooking fuel, financial inclusion, drinking water and electricity has led to significant advancements in these areas. All 12 parameters of the MPI have shown improvements. Flagship schemes such as the Poshan Abhiyan and Anaemia Mukt Bharat have contributed to reduced deprivations in health.
Initiatives such as Swachh Bharat Mission (SBM) and Jal Jeevan Mission (JJM) have improved sanitation across the country. The impact of these efforts is evident in the 21.8 percentage points improvement in sanitation deprivations. The provision of subsidised cooking fuel through the Pradhan Mantri Ujjwala Yojana (PMUY) has positively transformed lives, with a 14.6 percentage points improvement in cooking fuel deprivations.
Schemes such as Saubhagya, Pradhan Mantri Awas Yojana (PMAY), Pradhan Mantri Jan Dhan Yojana (PMJDY), and Samagra Shiksha have also played a crucial role in significantly reducing multi-dimensional poverty in the country, said the report.
“The remarkable progress achieved through extremely low deprivation rates especially for electricity, access to bank accounts and drinking water, reflects the government’s unwavering commitment to improving citizens’ lives and creating a brighter future for all. Consistent implementation across a diverse set of programmes and initiatives that have strong interlinkages has led to significant reduction in deprivations across multiple indicators,” the official statement added.
The resident representative UNDP India, Shoko Noda said the national MPI report outlines the remarkable progress made by India in nearly halving multidimensional poverty between 2015-2016 and 2019-2021, highlighting the country’s unwavering commitment to achieving the SDGs and its determined efforts to address poverty and improve the lives of its citizens. “It is commendable that India’s rural areas and its poorest states have shown the fastest decline,” Noda said in her message on the report.
2005-22
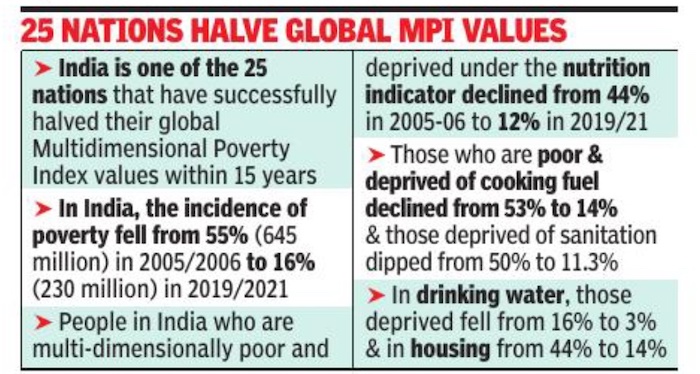
From: July 12, 2023: The Times of India
See graphic:
Multidimensional Poverty Index, some facts
2011-2023: extreme poverty declines from 27.1% to 5.3%/ WB
June 8, 2025: The Times of India
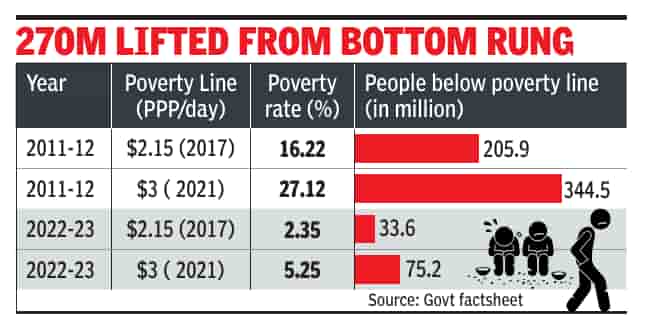
From: June 8, 2025: The Times of India
New Delhi : India’s extreme poverty rate has fallen sharply over the past decade after the World Bank updated its international poverty line definition, and included updated data in its June upgrade of the methodology.
Based on the update, latest WB data showed the extreme poverty rate had declined from 27.1% in 2011-12 to 5.3% in 2022-23. The number of people living in extreme poverty also fell sharply during this period from 344.47 million in 2011-12 to 75.24 million in 2022-23. This would mean nearly 270 million were lifted out of extreme poverty during this period. In a blog, WB said the international poverty line for low-income countries has been raised to $3 per person per day from the existing $2.15 per person per day; for lower middle-income countries, it’s changed from $3.65 to $4.20 per day; and for upper middle-income countries it went up from $6.85 to $8.40.
Given India’s inflation rate, between 2017 and 2021, a revised extreme poverty line of $3 would constitute a 15% higher threshold than $2.15 expressed in 2021 prices, and result in a 5.3% poverty rate in 2022-23. A new LMIC line of $4.20 would imply a 5% lower threshold for poverty than $3.65 adjusted in 2021 prices and yield a poverty rate of 23.9%, according to WB.
Using the new poverty line for low middle-income countries (LMIC), which is at $4.20 per day per person, India’s poverty rate fell to 23.9% in 202223 from 57.7% in 2011-12. The number of people in extreme poverty was down from 732.48 million in 2011-12 to 342.32 million in 2022-23, according to the data available on WB’s Poverty and Inequality Platform. Free and subsidised food transfers supported poverty reduction, and the rural-urban poverty gap narrowed. The five most populous states account for 54% of the extremely poor, it had said. According to the poverty and equity brief published by WB in April, extreme poverty (living on less than $2.15 per day) fell from 16.2% in 2011-12 to 2.3% in 2022-23, lifting 171 million people above this line. Rural extreme poverty dropped from 18.4% to 2.8%, and urban from 10.7% to 1.1% , narrowing rural-urban gap from 7.7 to 1.7 percentage points — a 16% annual decline.
It had also said India has transitioned into the lower middle-income category. Using the $3.65 per day LMIC poverty line, poverty fell from 61.8% to 28.1%, lifting 378 million people out of poverty. Rural poverty dropped from 69% to 32.5%, and urban poverty from 43.5% to 17.2%, reducing the rural-urban gap from 25 to 15 percentage points with a 7% annual decline.
The updated WB data is expected to come as a shot in the arm for the govt and bolster its record of handling the economy and pursuing policies to push inclusive growth and lift millions out of poverty.
Last year, Niti Aayog CEO BVR Subhramanyam hadindicated that the poverty level could be less than 5% based on preliminary estimates on the household consumption expenditure (HCES) data released by the statistics office. WB has said in recent years, the scope and quality of information provided by household surveys has improved enormously, particularly in low-income and lower-middle-income countries, offering a clearer view into people’s welfare and day-to-day lives.
Several research papers have also indicated the reduction in extreme poverty over the last decade thanks to robust growth. A survey released last year estimated poverty to have declined to 8.5% from 21% in 2011-12 and pointed out that chronic poverty has come down but there is a significant proportion of people who can slip back into poverty due to “accident of life”.
WB, which introduced the international poverty line (IPL) in 1990, has undertaken several updates to include changing prices and costs, and the latest update was undertaken on June 5. The first update to the IPL happened in 2001, with subsequent revisions in 2008, 2015, 2022, and more recently this month. This update, which also applies to poverty lines for middleincome countries, follows the release last year of a new set of PPPs based on prices collected in 2021 by International Comparison Programme. It also reflects changes in national poverty lines, which is a big reason for the increase, especially for the line that tracks extreme poverty, according to WB.
