Power: India, 1
What Is the Difference Between Power and Energy? The Staff of QUEST explains:
The word “energy” is used to describe many different things—how we heat and cool our homes, how we fuel cars. Energy isn’t something that can be seen or felt, but you can see and feel the effects when energy is transferred from one place to another.
Energy is what makes change happen and can be transferred form one object to another. Energy can also be transformed from one form to another.
Power is the rate at which energy is transferred. It is not energy but is often confused with energy. The watt is the most commonly used unit of measure for power. It measures the rate of energy transfer.
A watt equals a joule per second. If a smart phone uses five joules of energy every second, then the power of the phone is five joules per second, or five watts.
Indpaedia has separate pages on
Energy: India and
Power: India, 1
Power: India, 2 (ministry data)
This article has been sourced from an authoritative, official readers who wish to update or add further details can do so on a ‘Part II’ of this article. |
Coal-based plants
Pollution
Feb 23 2015
CSE's study rates 47 coal-based plants
A first-ever environmental rating of coalbased power plants has found that India's thermal power generating units figure among the world's “most inefficient“ in terms of compliance to pollution norms, use of resources and overall operation efficiency . Though private sector thermal plants in the country perform better than governmentowned ones, there is “immense scope for improvement“ in almost all units so that they can pollute less and generate more electricity with efficient use of available resources.
The study behind the ratings, done by experts at the Centre for Science and Environment (CSE), also noted that Delhi is home to one of the most polluting power plants in the country NTPC's Badarpur Thermal Power Plant which has contributed in turn ing the capital into the most polluted city in the world.
The study , done under CSE's Green Rating Project (GRP), analysed and rated 47 coal-based thermal power plants from across the country on a variety of environmental and energy parameters. About half of all plants operating in 2011-12 were selected for the rating.
“The objective of the study was to give a clear picture of the environmental performance of the sector. Our finding is that in India, where demand for power is increasing, power plants are performing way below the global benchmarks“, said Sunita Narain ahead of the study's release on Saturday.
She said, “Given the rapid increase in coal-based power projected by the government, stress on precious resources like water and land will increase and air and water pollution will worsen unless corrective measures are taken by the industry and policy-makers“.
The study was released jointly by M S Swaminathan, environment secretary Ashok Lavasa and chief economic advisor Arvind Subramanian in a function here, organized to award the greenest power plants.
Three top power plants (CSESBudge Budge, JSWELToranagallu and Tata-Trombay) were awarded for their overall environmental performance, while two others received awards for their efficient use of resources such as energy and water.
The study found that the country's thermal power plants are estimated to draw around 22 billion cubic meter of water, which is over half of India's domestic water need.It also noted that 55% of the units were violating air pollution standards which are already extremely lax.
Supply of coal to thermal power stations: 2018
Sanjay Dutta, Govt rushing coal to power plants to tackle summer, March 14, 2018: The Times of India

From: Sanjay Dutta, Govt rushing coal to power plants to tackle summer, March 14, 2018: The Times of India
The government has enhanced coal supply to ramp up buffer stock at thermal power stations in anticipation of electricity demand shooting in line with the weatherman’s prediction of an early and hot summer this year. Coal ministry data show 16 power stations, or 14%, of the 112 coal-fired power plants monitored by the Central Electricity Authority have received fuel supplies in excess of their 100% requirement.
Data show the level of excess supply reaching as high as 200% in one case, while remaining between 104% and 163% for the remaining 13 stations under this group.
There are 28 other power stations, or a quarter of the monitored plants, that are getting supplies well in excess of their ‘trigger level’ – which ranges between 75% and 90% – of the annual contracted quantity of coal tied up from state-run Coal India Ltd.
The push for increased coal supply is aimed at avoiding a repeat of last year’s situation when coal demand spiked as thermal plants raised output to bridge shortfall in generation from hydel, wind and nuclear sources. In the August-September period of 2017, nuclear generation fell 36%, wind 14% and hydel 12%.
Supplies from Bhutan also dropped. This supply gap was met by coal-fired plants, which saw generation rising by 17% as plants spun at 58% of capacity against 52% in August 2016.
This had led to coal demand rising by 20 million tonne. Coal India raised despatch by 21% but it still proved inadequate because power demand spiked with rising humidity and a prolonged dry spell.
Since then, the coal and railway minister Piyush Goyal has initiated several steps to ensure adequate coal stocks at power stations, some of which are still operating with low fuel stocks due to various reasons.
Coal India is despatching 8% more coal than it did a year ago, loading 308-310 rakes per day to wheel 1.8 million tonnes (mt) of the fuel daily.
Coal India’s production has also gone up to 2 million tonne a day and is set to increase further to 2.5 mt in the remaining days of March.
Consumption of electricity in India
1950-2023

From: Sep 8, 2025: The Times of India
See graphic:
1950-2023: Per capita consumption of electricity in India
Consumption of electricity in India and the world
2019
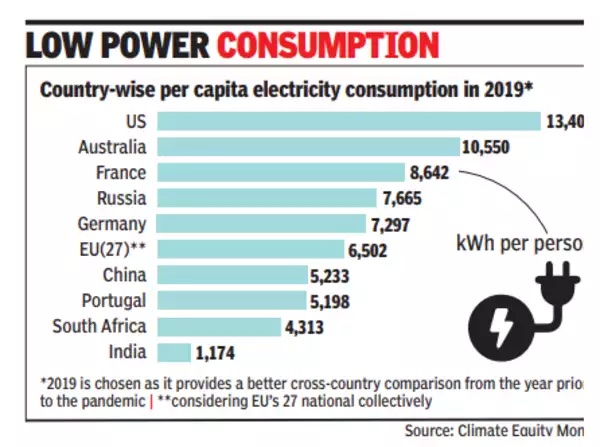
From: Vishwa Mohan, Nov 15, 2022: The Times of India
See graphic:
Per capita Consumption of electricity in India and the world, 2019
Consumption of electricity, in one day
2021, Jan 20
January 21, 2021: The Times of India
India’s daily power demand surges to record 186 GW
New Delhi:
India’s power demand hit a record at 185.8 GW (gigawatts) on Wednesday, rising 1.6% over the previous record of 182.9 GW on December 30 and marking a 9% increase over the highest single-day supply of 171 GW in January 2020.
According to power secretary S N Sahai, the demand peaked at 9.35am. Government officials said the surge in demand indicated a rebound in industrial and commercial activities in January after a 0.3% dip in factory output in December. The country’s factory output had shown a growth of 1.8% in November. Others said the prolonged cold spell across the northern region also contributed to the surge in demand.
In another indicator of rising consumption, the NTPC group, the country’s largest generation utility, recorded highest-ever generation in a day at 1,009 million units on January 18. The group achieved gross cumulative generation of 222.4 billion units in the April-December period of 2020, marking an increase of 3.8% over the previous corresponding period.
Consumption of electricity, state-wise
Delhi vis-à-vis the other Top 3/ 2017

Paras Singh, Power demand in capital soars to all-India high, June 6, 2017: The Times of India
The soaring mercury level has pushed Delhi's power demand to an all-time high. The capital's peak consumption demand at 3.06pm on Monday touched 6,361MW, the highest ever recorded in any city of India. The last time Delhi set an all-time record was on June 30, 2016 when the electricity demand shot up to 6,261MW.
On May 15, Delhi's peak power demand breached the 6,000MW mark. In April, it was 5,685MW, a whopping 18% rise from last year's figure. Similarly , March too saw the peak power demand going up up to 4,000MW, first time in that month. It was an increase of over 14% from that of March 2016--3,617MW.
These numbers make it clear that Delhi is also the “power capital“ of the count ry. Currently , hovering around 6,000MW, the city's peak demand is almost thrice of Kolkata's (around 2,100 MW), four times than that of Chennai (1,500-1,800MW) and as much as 60% higher than financial capital, Mumbai's demand of 3,700MW. Delhi's power appetite is so huge that it is nearly two and a half times the total demand of seven Northeastern states--around 2,500 MW.
The higher power demand has been attributed to growing population, rising standard of living and exceptionally hot weather. Starting from 2MW in 1905, 27MW in 1947 to over 6,000MW now, the city's electricity appetite has grown exponentially in the past seven decades.
2018/ electricity consumption vis-à-vis per capita NSDP, state-wise

Power consumption per capita and per capita State domestic product at current prices in Rs 1000s,
presumably in 2018
From: July 25, 2018: The Hindu
See graphic:
Graph shows that in general, States with higher per capita NSDP consume higher electricity;
Power consumption per capita and per capita State domestic product at current prices in Rs 1000s,
presumably in 2018
2022-23

From: March 18, 2025: The Times of India
See graphic:
State-wise annual per capita electricity consumption (kWh, 2022-23)
Consumption of electricity, year-wise
2001-19

From: Sanjay Dutta, February 10, 2021: The Times of India
See graphic:
Access to electricity and clean cooking in India. 2001- 19; Annual distance travelled per capita, 2000- 19
2012-18: power consumption in India, other countries

From: Sanjay Dutta, August 5, 2019: The Times of India
See graphic, ‘2012-18: power consumption in India, China, Japan, South Korea and USA ’
2015 study
The Times of India Jan 11 2016
Chittaranjan Tembhekar
Mumbai
The Indian winter appears to be the warmest in Mumbai if we go by the pattern of electricity consumption of air conditioners and refrigerators across India's four major metros. It's high time Mumbaikars' fight against global warming is intensified as even during colder days their refrigerators and ACs are guzzling power much more than those living in other metros such as Kolkata and Bengaluru, whose temperature patterns are more or less similar to the maximum city .
A study by The Energy and Resources Institute (TERI) conducted in 2015 on behalf of the Bureau of Energy Efficiency, finds Mumbai's consumption of power for refrigerators and air-conditioners (as percentage of power consumed by a household) is the highest among the households surveyed in Mumbai, Delhi, Kolkata and Bengaluru in both autumn and winter seasons respectively . Over 800 households were surveyed in each of these cities as part of the study .
Experts agree Mumbai obviously will spend more than Delhi, where winters are cold and autumns pleasant, but criticise Mumbaikars for spending so much more on air-conditioners than Calcutta and Bangalore.
While in autumn Mumbai showed 26.4% power consumption by a refrigerator in an average household, in winter it showed 45%, much high er among the four metros. For air conditioners a city household showed an average of 19.3 % power consumption in autumn while in winter it stood at 7.9% which is again much higher than remaining three cities surveyed during the study .
Power expert Ashok Pendse said air-conditioners were the killer for Mumbai as against 3200 MW consumption during summer, winter consumption of the city stood at just 1500 MW. “Keeping AC temperature between 24 and 26, servicing it regularly , avoiding its excess use, going for LED and star-rated gadgets, and strengthening greenery and avoiding vehicle pollution were the steps needed to be taken by Mumbaikars to counter the global warming which is indicative with the growing use of ACs,“ he said.
It may be recalled that a similar study made by BEE through TERI in 2009 had suggested that Mumbaikars' consumption on refrigerators, air conditioners and geysers was more than those living in Delhi, Bengaluru and Kolkata.
The survey had revealed that Mumbai's consumption was all time high across all four seasons summer, winter, spring and autumn. Among these three gadgets, as per 2009 study , Mumbai had consumed the most on refrigerators and air conditioners whereas Delhi consumed highest power on geyser during prolonged winter months followed by Kolkata.
2016-17: Conventional and renewable
Sanjay Dutta, Solar energy helps boost power generation to 10gW , March 7, 2017: The Times of India

Green power is driving the growth in India's electricity generation as total installed solar capacity , including rooftop and off-grid projects, has crossed 10 gigawatts (gW), latest government and market data show.
Generation from conventional sources showed an annual growth rate of over 5% in the 11-month period of 2016-2017 financial year, while output from renewable power projects rose more than 26% during this period. Together, the total growth in generation is in excess of 6% from a year-ago period, government data show.
Power ministry officials say the net growth figure will be higher as generation data from renewable power projects come with a time lag, and therefore, does not reflect in the Central Electricity Authority's latest report The officials said the total generation this February showed marginal decline than the year-ago period due to the effect of 2016 being a leap year. A da y's extra generation in February 2016 affected the February 2017 figure by 3.57%. Had February 2017 also had one extra day , the increase in electricity generation from conventional sources would have been 3.52%, the officials said.
Market watchers see renewables continuing to carve a bigger space in the country's generation sphere on the back of the Narendra Modi government's funding push. After coming to power in 2014, the government revised the target for renewables from 20 gW to 175 gW, including 100 gW of grid-connected solar projects, by 2022.
Last month, the government announced an ambitious scheme to double solar power generation capacity under the solar parks scheme to 40,000 mega watts (mW) by 2020, with Rs 8,100 crore assistance to fund 30% of the initial project cost of developers.
India is expected to add new solar capacity of 5.1 gW this year, which is a growth of 137% over last year, a recent report by Bridge To India, a green energy-focused consultant, said. It expected an annual capacity addition of about 8-10 gW in 2017.
“India is expected to become the world's third biggest solar market from next year onwards after China and the US,“ it said.
Tamil Nadu has the highest installed solar energy capacity , followed by Rajasthan, Andhra Pradesh, Guj arat, Telangana, Madhya Pradesh and Punjab. These seven states collectively accounted for more than 80% of total installed capacity as of mid-November.
2019

From: February 25, 2021: The Times of India
See graphic:
Demand for electricity and coal in India, 2019
2012-22
Sudarshan Varadhan, Nov 1, 2023: www.reuters.com
CHENNAI, Nov 1 (Reuters) - India's electricity demand grew 4.1% in October from a year earlier, leading to a shortfall in supply of 1%, government data showed.
Energy demand has been boosted by increased economic activity after the second wave of coronavirus infections subsided and led to a shortage of coal that forced India's northern states to cut power last month for up to 14 hours a day.
The data showed that coal-fired power generation rose 1.8% in October from a year earlier, while solar energy output increased by 28.4%.
Surging demand and high global prices have left utilities scrambling for coal, India's dominant fuel for power generation, despite record supplies from state-run Coal India (COAL.NS), which has a near-monopoly of production.
Coal India said that it had supplied a record 364.4 million tonnes from April-October, 19% higher than the previous year.
"Against coal consumption of around 1.8 million tonnes per day by the power sector, the supply from Coal India and other sources has been around 2.2 MTs during the last week of October, with Coal India accounting for the major share," the miner said in a statement.
India's Coal Minister Pralhad Joshi on Monday urged Coal India to increase production to ensure power plants had 18 days of coal stock by the end of November, while reiterating a target to achieve an output of 1 billion tonnes by 2024.
India's power supply shortage of 1,201 million kilowatt hours (KWh) in October was the worst since January 2017, data from federal grid regulator POSOCO showed.
Coal's share in India's electricity generation jumped to 70.6% in October from an average of 66.5% in September, the data showed.
Over a third of India's coal-fired capacity now has inventories of three days or less, latest data from the power ministry shows. The average coal inventory held by power plants would last six days, half the average of 12 days over two months ago.
Distribution companies (DISCOMs)
2013-19

Aggregate transmission and distribution (AT&C) losses, and discoms’ losses, 2015-19
From: May 11, 2019: The Times of India
See graphic:
Discoms’ power purchase costs, 2013-18
Aggregate transmission and distribution (AT&C) losses, and discoms’ losses, 2015-19.
Arrears, 2018, ’19
SANJAY DUTTA, May 29, 2019: The Times of India
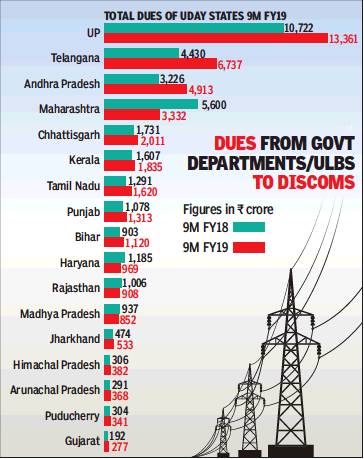
From: SANJAY DUTTA, May 29, 2019: The Times of India
A review document of UDAY (Ujjwal Discom Assurance Yojana), the Centre’s ambitious plan for resuscitating distribution utilities, by government think-tank Niti Aayog last month shows government departments and local bodies running up power dues of Rs 41,386 crore in the first nine months of 2018-19.
In contrast, discoms’ overdue payment to power stations during the same period stood at Rs 22,061 crore, or nearly half the unpaid amount from government departments and ULBs — government offices, police, fire, water and sewage departments as well as other civic bodies.
“This indicates a problem at the state government end and not with UDAY per se. Performance of discoms is as much about their own performance as of other entities in the power sector value chain. States have to realise in any case, they have to bear the cross of discom losses. We are impressing upon states to look at a system wherein governments directly pay discoms for power consumed by departments and ULBs,” a power ministry official said. Such large unpaid bills adversely impact cash flow and operational capability of discoms. The impact gets magnified by other issues such as inadequate tariff revision and delayed subsidy. Ultimately, independent power plants find it difficult to service loans on time and face increased threat of becoming stressed assets due to delayed payments from discoms.
According to the Niti Aayog review, government departments and ULBs of UP, Telangana, Andhra Pradesh, Maharashtra and Chhattisgarh account for Rs 30,354 crore, or over 73%, of the discoms’ arrears. UP, Telangana, Andhra Pradesh and Maharashtra are also with the bulk of overdue payments to generation companies.
Ease of getting power
2016: India's rank rises by 73
Sanjay Dutta, Ease of getting power: India's rank up by 73 , May 12, 2017: The Times of India

Govt Halved Rate At Which Prices Rise Every Year
The focused reforms unleashed by the Narendra Modi government in the last three years have halved the rate at which power prices rose every year, and improved India's position in the global `ease of getting electricity' ranking.
The compounded annual growth in power prices in the 2014-16 period stood at 3.27% against 5.94% through the last 10 years between 2004 and 2014.
Simultaneously during the last two years, India moved up to the 26th spot in global electricity accessibility ranking, moving up from 99th in 2014 aided largely by the Modi government's rural electrification programme in the last three years since it came to power.
Nowhere has the suc cess of the government's policies become more visible than the development where solar power tariff went below coal-fired power for a project at Bhadla solar park in Rajasthan.
Overall Energy shortage too has come down to 0.7% at present from 4.2% in 2014. No wonder power, coal renewable energy and mines minister Piyush Goyal spoke from a position of strength when he told the Vienna Energy Forum, “Many problems had earlier set India back for many years but now the mood has changed.“ “India is taking rapid strides in terms of commitment and target for promoting energy conservation and efficiency ,“ he told the gathering.
“Traditionally India's stand has been what the world was ready to do to help us go green. Finally , we are able to tell the world that we will do whatever it takes to improving our pollution levels to meet the challenges of climate change, irrespective of what the world does. We have finally been able to make solar tariff go below grid parity ... India's leadership position in green energy will new benefit the world,“ he said.
Generation and transmission
As in 2024
Sanjay Dutta, June 3, 2024: The Times of India

From: Sanjay Dutta, June 3, 2024: The Times of India
New Delhi: When India’s power demand spiked to 250 gigawatts (GW) — a level never seen before — on May 30 against a projection of 235 GW for the month, the cross-country transmission network did not heat up and there was no report of unscheduled outages.
Despatchers manning the national control centre directing the flow of electricity are now gearing up for a peak demand of 258 GW in the coming months. This is a far cry from July 30 and 31, 2012, when India suffered the world’s largest outage after the northern and eastern grids collapsed due to overload, plunging 620 million (62 crore) people, or 9% of the world’s population at the time, into darkness for over 13 hours. The peak demand recorded during that month was around 130 GW but additional power could not be imported from surplus re- gions as the work on integration with other grids was still under way and completed in December 2013, giving India ‘One Nation, One Grid’.
Fossil fuels vis-à-vis non- Fossil fuels
2025 Oct
Share in installed capacity (as of Oct 31, 2025):
Non-fossil fuel: 51.4% (250.643 MW)
Fossil fuel: 48.6% (245.006 MW)
Share in total generation:
Non-fossil fuel: 31.8%
Fossil fuel: 68.2%
(Source: Ministry of Power)
Rural electrification
1950-2017

How is village electrification different from that of a household?
A village is considered electrified if 10% of its households have electricity connec tion, and hence there is a considerable scope that many families may not have electricity despite being located in an electrified village. According to Deendayal Upadhyaya Gram Jyoti Yojana website, there are only 0.5% un-electrified villages in the country while 23% households are yet to get electricity. In some states, nearly all households have electricity, while there are others with significant village electrification but many house holds without power.
Does providing an electricity connection itself address power problem?
Despite access to electricity, a large part of India's population suffers from power shortage. As a result India's per capita consumption of electricity is far lower than similar economies. Per capita consumption of power indicates the degree of industrialisation as well as quality of life in a country .
Tariff
2016: E-bidding helps cut power tariff
The Times of India, May 24 2016
The power ministry's move to channel procurement of short-term power by states through reverse auction on its e-bidding platform appears to be paying off. The first round of bidding on the DEEP (Discovery of Efficient Electricity Price) portal has seen tariffs go down by more than a third from a year-ago period.
Uttarakhand, Kerala, Bihar and private discom Torrent Power kicked off the DEEP bidding process, with Kerala discovering a price of Rs 3.14 per unit, the lowest for May in the slot of the day , against Rs 4.70 per unit paid for roundthe-clock supplies in 2015.
Uttarakhand discovered a price of Rs 2.59 per unit, the lowest for July on round-theclock basis. The state discoms had procured short-term power at Rs 3.41 per unit last year in the same period. Bihar received the lowest rate for July at Rs 3.08 per unit, while Torrent Power received the lowest price of Rs 2.95 per unit for May-June in slot of the day . While the state did not procure power through bidding before this, Torrent did not procure short-term power in 2014-15 and 2015-16. Bidding for Uttarakhand and Kerala concluded on April 29, for Torrent Power Ltd on May 3 and for Bihar on May 9, the power ministry said on Sunday .
Lower prices are expected to reduce the overall cost of procurement of power for dis coms and ultimately benefit consumers. Power minister Piyush Goyal had inaugurated the portal, making it mandatory for discoms to procure short-term power through reverse e-bidding.
2018: tariff in the major cities
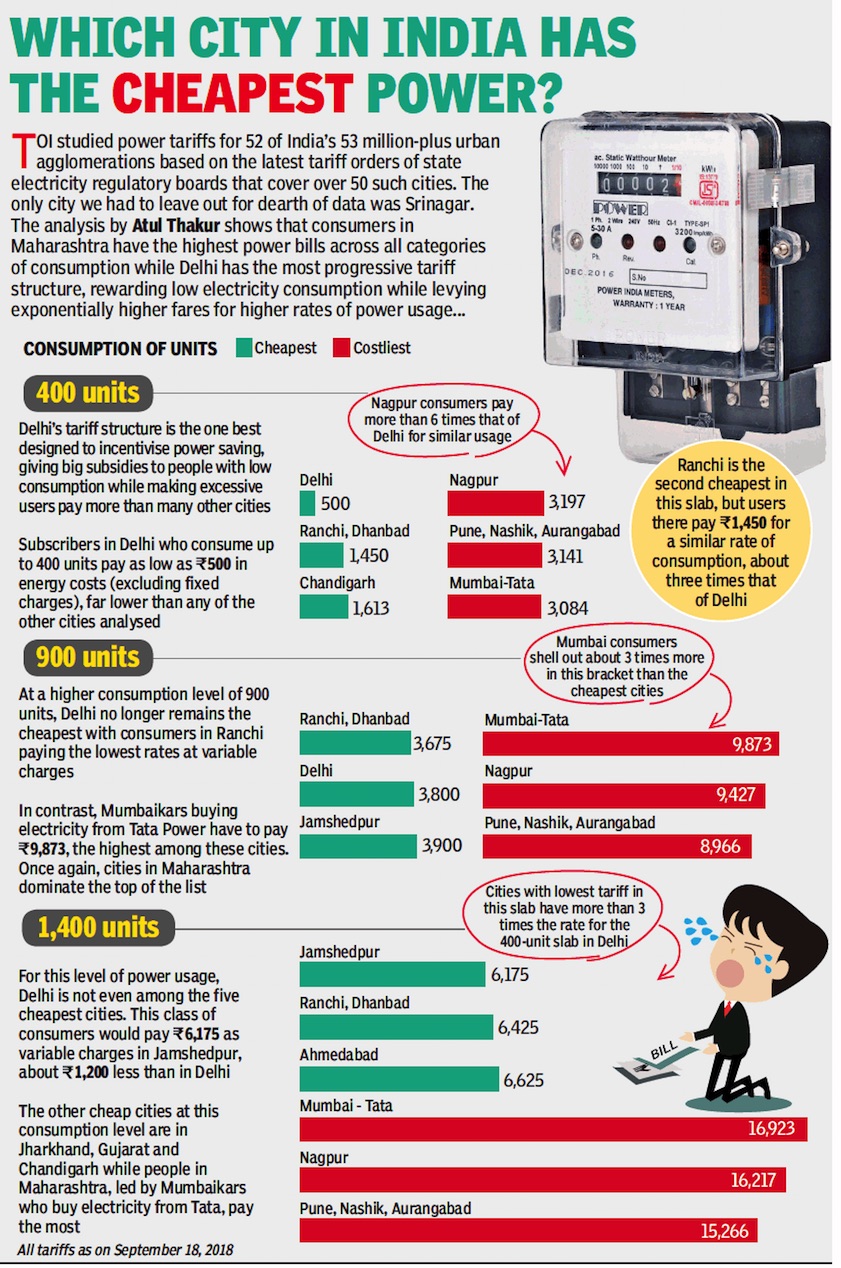
From: October 3, 2018: The Times of India
See graphic:
2018: the power tariff in India’s major cities
Trade (cross-border)
2017/ India becomes net exporter of power
India becomes net exporter of power for the first time: Government, Mar 29, 2017, The Times of India
HIGHLIGHTS
New transmission lines with Bangladesh and Myanmar helped India sell more.
India is set to sell more power to Nepal, Bangladesh and Myanmar.
NEW DELHI: India has become a net exporter of electricity for the first time, the power ministry said on Wednesday, adding that upcoming cross-border transmission lines with neighbouring countries such as Nepal, Bangladesh and Myanmar will only increase sales.
April-February power exports of around 5,798 million units were 4 percent higher than what India bought from Bhutan, which has been a steady supplier of hydro-electricity to the country since the eighties. New transmission lines with Bangladesh and Myanmar helped India sell more, the government said.
Known for its crippling power cuts, India has been investing heavily on generation infrastructure over the past few years. A massive surge in the local supply of raw materials like coal in the past two years has also helped power companies boost output. Some experts, however, say local power demand has grown slower than expected.
Why India exports power
See graphic.
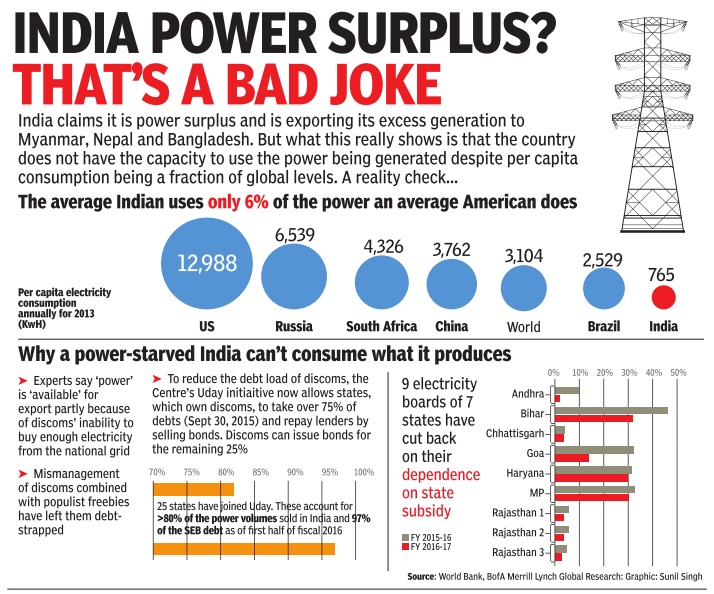
Spot market faces regulatory hurdles
The Times of India, Jul 23 2015
Sanjay Dutta

Neighbours still can't buy from spot market
Daily spark missing in India's int'l power trade
India has emerged as a hub of South Asian transmission network but the daily spark of dayahead trading is missing in its cross-border power trade due to regulatory hurdles.
Indian power exchanges have petitioned the Central Electricity Regulatory Commission to open the doors to spot buyers from neighbouring countries as millions of units go waste at home due to busy transmission lines or poor appetite of financially stressed state utilities.
Tata Power has petitioned the regulator for permission to import power from its 126 MW Dagachhu hydel project in Bhutan through the Indian exchanges for sale in India till bilateral contracts are signed. Industry sources say there are consumers in Nepal and Bangladesh, countries with large unmet demand, willing to buy power from the Indian spot market.
But for the regulator, it is a grey area as the existing policy does not reflect the chang ing reality of expanding interlinks with neighbouring countries and power projects coming up in Bhutan and Bangladesh with Indian private investments. The government is examining the new reality and at least Tata Power's case is awaiting the foreign ministry's approval. The Indian grid is connected with Bhutan, Bangladesh and Nepal. Plans for establishing interlinks with Pakistan and Sri Lanka have remained enmeshed in the complexities of bilateral politics. Trade through the existing interlinks is guided by bilateral arrangements between governments. There is no third-party transit through the Indian network. In dia imports power from hydel projects it has set up in Bhutan and supplies electricity from a central pool to Nepal and Bangladesh.
The Dagachhu hydel project is the first of several private projects being built on foreign soil for supplying to local market, India or a third country. Reliance Power and Adani group recently inked deals for large power plants in Bangladesh. The petitions by power exchanges point out that the ground is ready for cross-border trading because of financial and regulatory similarities in electricity markets of the interlinked countries.
Initially, the volumes are expected to be small due to limited interlink capacity.But, with plans for their expansion, a full-on regional power market is just round the corner, much in line with the scenario in Europe.
India, with a rapidly expanding generation capacity -estimated at 2.72 GW (giga watt) at last count -and surrounded by deficit countries, can be in the driver's seat only if it moves fast.
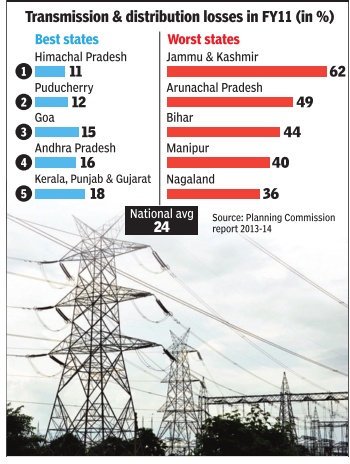
Transmission and distribution losses
2005-10
Costly leak: Power cos lose Rs 30,000cr every year
Plan Panel Puts Blame On Theft, Faulty Metering & Poor Billing Mahendra Kumar Singh
New Delhi: The average cost of electricity in India may be the highest in the world but distribution utilities are losing around Rs 30,000 crore annually because they cannot recover the cost due to theft and poor billing practices, an industry euphemism for ‘transmission and distribution losses’.
Indicating that outdated networks are adding to the losses of distribution companies, the Planning Commission sees the average cost of taking power to the consumer’s doorstep increasing from Rs 3.60 per unit in 2005-06 to Rs 4.16 per unit in 2009-10, or an increase of 15.5%.
Against this level of rise in the costs, average tariff has increased from Rs 2.87 per unit to Rs 3.37 in the same period, marking a 17.4% increase. ‘‘The gap has increased to around 89 paise per unit in 2009-10,’’ the panel says in its mid-term review of the 11th Plan. Another reason for the utilities losing money in their distribution operation, the panel notes, is their failure to recover the cost owing to unsustainable level of technical and commercial losses due to pilferages and inefficiencies in metering and billing.
According to the mid-term review (MTR), the financial performance of 20 major states barring Delhi and Orissa discloses that total expenditure in distribution was Rs 2,03,097 crore in 2008-09, which is likely to be Rs 2,25,282 crore this fiscal, while commercial losses without subsidy worked out to Rs 40,910 crore in 2008-09 and are likely to be Rs 38,420 crore this fiscal. The average tariff was Rs 328.57 crore (at Rs 14.22 paise/Kwh) in 2008-09, which is likely to go up to Rs 338.32 crore (at Rs 17.47 paise/Kwh). “The gap between average cost of supply and average tariff has been found to be around 104 paise in 2008-09 and is expected to be around 89 paise in 2009-10,” the document suggests.
Criticising the distribution utilities for their poor power procurement planning, the MTR suggested that the distribution sector required substantial improvements in business planning and forecasting to manage its finances and operations better.
“Much of the present cost problems are on account of poor power procurement planning and contract management,” the panel argued. It called for for improvement in customer service and management methods which would lead to greater customer satisfaction and overall reduction in service costs and also facilitate in implementing cost reflective tariffs and timely payments from consumers.
Losses from power theft, 2017>18

ii) 2018, May: the five states with the longest power cuts.
From: T.C.A. Sharad Raghavan, Discoms, not Centre, to guarantee power supply to all villages, says official, June 26, 2018: The Hindu
See graphic:
i) Losses from power theft, 2017>18;
ii) 2018, May: the five states with the longest power cuts.
Transmission lines and the law
SC: No need for landowner's nod to lay power line
Dhananjay Mahapatra, Dec 30, 2016: The Times of India
Removing roadblocks in reaching electricity to every village, the Supreme Court has ruled that no prior consent of landowners was required to lay overhead power transmission lines and erect towers to support these lines.
Through the judgment, the SC settled the issue which gave rise to conflicting judgments from various HCs. The SC's top priority was to enable the go vernment and its agencies to get electricity to the last household in the remotest areas.
A bench of Justices A K Sikri and R Banumathi said, “It is well known that India is an energy deficient country.There are many households where lighting even an electric bulb is a dream.“
The issue was filed by a cement manufacturer from Chhattisgarh and Power Grid Corporation. The cement manufacturer challenged Power Grid's decision to erect towers for transmission lines on its limestone mine lease area without its consent. The bench said, “As per the provisions of the Indian Telegraph Act, unobstructed access to lay down telegraph andor electricity transmission lines is an imperative in the larger public interest.“
Transmission issues
Inter-region transfer
The Times of India, Jul 05 2015
Sanjay Dutta
Supply from surplus to deficit regions blocked
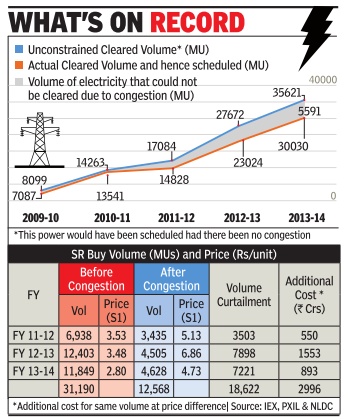
It is the height of paradox for a country where blackouts are more a norm than exception. Over 3 billion units of electricity , or a day's national consumption, were wasted in 2014-15 as congestion in the transmission highways blocked trading between surplus and deficit regions. Data from various power exchanges show a higher wastage in 2013-14 at 5.3 billion units, or Delhi's consumption for roughly 56-60 days.
Inter-region transfer through short-term open access stood at 78.38 billion units during this period. No doubt, such wastage both in terms of actual power fed into the grid but not used and generation capacity that was not `scheduled' due to grid bottlenecks comes at a cost to the economy in terms of lost opportunities and idling power stations.
But even consumers, especially in deficit southern region, end up paying more as transmission gridlock not only affects volumes traded but also the price of electricity .
Power is traded on bourses through a mechanism called `market splitting' in industry parlance. In this system, tariff on surplus and deficit regions are adjusted in a way that the power flow equals the network capacity available for trading.As a result, the price in surplus area declines and rises in deficit regions, which either go dark or have to look for costlier alternatives.
The southern region is one of the worst sufferers in this regard. Some industry estimates say network congestion cost the region at least Rs 5,000 crore in the last three years during which time 19 billion units could not flow to it due to congestion. The opportunity cost alone of the unserved power is estimated at Rs 1,862 crore, assuming utilities earn Re 1 per unit extra revenue after meeting operating expenditure. Besides, in the absence of access to surplus power, cost of supplies were higher than what it would have been if there was no congestion. Utilities had to buy tap costlier options or shed load. The price differential works out to Rs 2,996 crore. This came from consumers' pockets.
Industry watchers say the problem lies in the way capaci ty of transmission highways are planned with singular focus on wheeling power under long-term supply agreements.This leaves only marginal capacity for trading, considered an ingredient for real competition and ensuring the government's promise of 24X7 supply .
Reserving some transmission capacity transmission networks, thus, is cited as need of the hour for growth of a healthy power market. This is important since distribution utilities are unable to forecast demand until very close to the delivery day due to factors such as seasonal variations, unscheduled generation outages, social events, political factors and business cycle etc.
See also
Power: India, 1
Power: India, 2 (ministry data)
Green (renewable) energy: India, 1
Green (renewable) energy: India, 2 (ministry data)
Petroleum, diesel, natural gas, India: I

