Water Economy: India
(→Water distribution) |
|||
| Line 9: | Line 9: | ||
|} | |} | ||
| − | + | ||
| − | + | ||
| − | + | ||
| − | + | ||
| − | + | ||
| − | + | ||
=Water distribution= | =Water distribution= | ||
| Line 171: | Line 171: | ||
[[Groundwater: India]]/ | [[Groundwater: India]]/ | ||
[[Water Resources: India (ministry data)]]/ [[Water Economy: India]] | [[Water Resources: India (ministry data)]]/ [[Water Economy: India]] | ||
| + | |||
| + | [[Category:Bangladesh|WWATER ECONOMY: INDIAWATER ECONOMY: INDIAWATER ECONOMY: INDIA | ||
| + | WATER ECONOMY: INDIA]] | ||
| + | [[Category:Development|WWATER ECONOMY: INDIAWATER ECONOMY: INDIAWATER ECONOMY: INDIA | ||
| + | WATER ECONOMY: INDIA]] | ||
| + | [[Category:Economy-Industry-Resources|WWATER ECONOMY: INDIAWATER ECONOMY: INDIAWATER ECONOMY: INDIA | ||
| + | WATER ECONOMY: INDIA]] | ||
| + | [[Category:India|WWATER ECONOMY: INDIAWATER ECONOMY: INDIAWATER ECONOMY: INDIA | ||
| + | WATER ECONOMY: INDIA]] | ||
| + | [[Category:Nepal|WWATER ECONOMY: INDIAWATER ECONOMY: INDIAWATER ECONOMY: INDIA | ||
| + | WATER ECONOMY: INDIA]] | ||
| + | [[Category:Pakistan|WWATER ECONOMY: INDIAWATER ECONOMY: INDIAWATER ECONOMY: INDIA | ||
| + | WATER ECONOMY: INDIA]] | ||
Revision as of 14:45, 13 December 2020
This is a collection of articles archived for the excellence of their content. Readers will be able to edit existing articles and post new articles directly |
Contents |
Water distribution
Is inequitablein India
Times of India This article was published around 2010.
New Delhi: On the face of it, India looks like a country with plenty of water with the average use per person per day exceeding 140 litres. However, as the HDR 2006 points out, aggregate figures are often deceptive, because they conceal the disparity in the distribution of water over regions, groups of people, between rich and poor and between the rural and urban population.
Even in the UK, the average use of water per person per day is only 150 litres, not too far above the Indian level, and in neighbouring Bangladesh, the situation is much worse with less than 50 litres of water available for average use per person per day. Yet, specific examples from different parts show just how disparate the distribution of water is and how dismal the situation is for millions who do not get even the minimum requirement of 20 litres of clean water per person per day.
Official data for Mumbai says the city enjoys a safe water coverage of more than 90%. But, as the HDR points out, almost half the city’s population lives in slums and these residents do not even figure in municipal data.
Similarly, in Chennai, the average supply is 68 litres a day, but areas relying on tankers use as little as 8 litres. The HDR also talks about the ‘water lords’ of Gujarat, land owners who have constructed deep wells depriving neighbouring villages of water, only to sell it back at a high price to those whose wells they have emptied.
NOT ENOUGH LIFELINE
In India, spending on military is 3% of GDP and on water and sanitation it is less than 0.5%
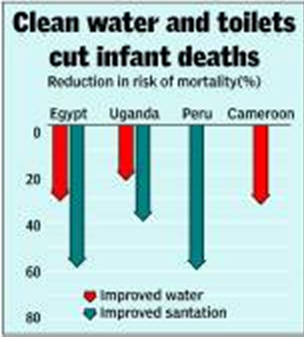
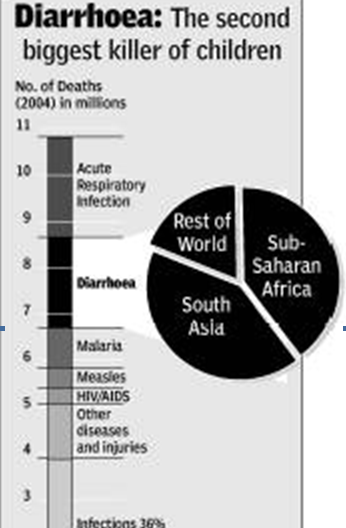
Diarrhoea kills 450,000 in India annually, more than in any other country
Research in India by Self Employed Women’s Association (SEWA) has shown that reducing water collection to one hour a day would enable women to earn upto an additional $100 (Rs 4,500 roughly) a year
In Delhi, Karachi and Kathmandu, fewer than 10% of households with piped water receive service 24 hours a day. Two or three hours of delivery is the norm
If the entire population of South Asia had access to basic low-cost water and sanitation technology, it would save the region $34 billion
Five aspects of India’s water crisis
June 21, 2018: The Times of India

From: June 21, 2018: The Times of India

From: June 21, 2018: The Times of India
From: June 21, 2018: The Times of India

From: June 21, 2018: The Times of India

From: June 21, 2018: The Times of India
5 Faces of India’s water crisis
The Niti Aayog in a report last week stated that India is suffering from 'the worst water crisis' in its history with about 60 crore people facing high to extreme water stress and about two lakh people dying every year due to inadequate access to safe water.
"By 2030, the country's water demand is projected to be twice the available supply, implying severe water scarcity for hundreds of millions of people and an eventual six per cent loss in the country's GDP," the report noted. This is not very different from a series of indicators in this year’s Economic Survey which show that India's water crisis is brewing below the ground and up in the sky. Here are 10 charts that explain the five different but interrelated aspects of the coming freshwater shortfall...
Water footprint, water stress
India, South Asia, the world: 2018

From: March 26, 2019: The Times of India
See graphic:
The Water footprint of and water stress in Bangladesh, India, South Asia, the world: 2018
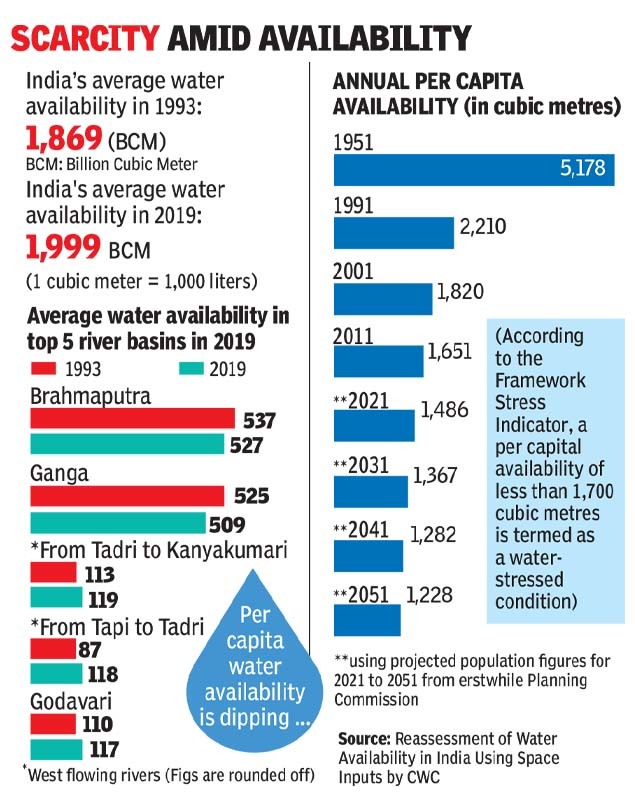
1951-2019: water availability
From: Vishwa Mohan, June 28, 2019: The Times of India
See graphic:
The per capita availability of water in India, 1951-2019.
Stress, 2001-19
June 20, 2019: The Times of India
From: June 20, 2019: The Times of India
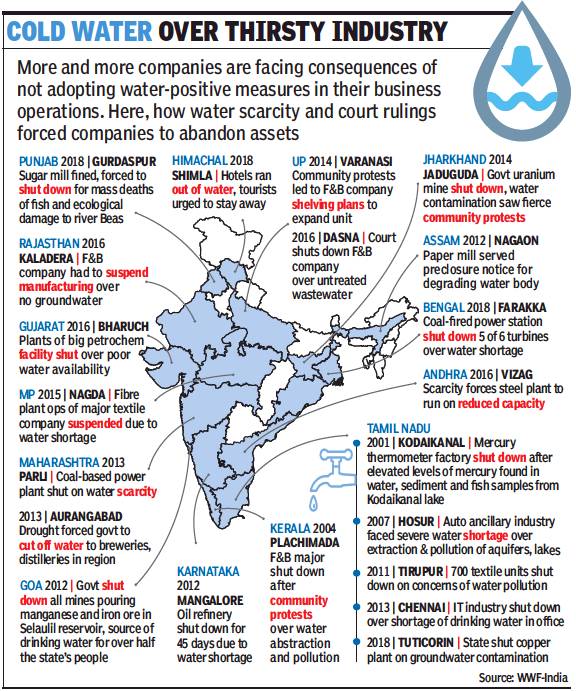
Ignore Water, Risk Your Biz
As Assets Dry Up, Companies Are Being Cautioned That Water Security Is Not Just A CSR Activity, But A Critical Business Function
Chennai’s IT sector asked employees a week ago to work out of home as a measure to tide over the water crisis that crippled the city. It was a near repeat of measures in 2013 for the very same reason. Clearly, no lessons had been learned.
Running out of water in office premises is perhaps the least of a business’ problems. Indian businesses, largely oblivious to the risk their businesses run in a watercrisis situation, mostly sideline critical water issues as corporate social responsibility (CSR) activity. But a 2019 study by WWF-India has recorded how water-related risks can limit production, disrupt supply chains and “result in asset write-downs, create conflict with other water users and harm corporate reputations.”
Titled ‘Hidden risks and untapped opportunities: Water and the Indian banking sector’, the report looks at the role water plays in business, how reckless business practices result in companies having to abandon large assets from dams to factories, while the liabilities pile up for banks, which have loaned to these companies. The report says more than 39% of the portfolio of Indian banks is exposed to sectors that face “high levels of operational water risk” — scarcity and pollution in the main.
Calling it ‘water-risk’ a business runs, the report also quotes a World Resources Institute study, which found that “water scarcity caused 14 of India’s 20 largest thermal utilities to shut down at least once between 2013 and 2016, costing those companies $1.4 billion.”
Global data from non-profit CDP in 2014 found that 53% of companies reported “significant financial impacts from water”, an increase of 40% from when this data was first reported in 2011. The risks are only increasing.
The risks include closure of factory sites for polluting rivers and water bodies. India has 600 million people coping with high to extreme water stress, and 70% of households receive contaminated water. Much of this has been fallout of business operations. The report says, “India is by far the country where the most people lack access to clean water close to home”. In addition, conflicts within communities are steadily increasing as competition over limited water sources grows.
By 2017, the Tamil Nadu pollution control board had shut down a large textile dyeing unit in Tirupur’s Arulpuram at least four times in a couple of years for discharging untreated industrial effluent into an unused borewell. Earlier this year, power supply to four units were cut off for polluting river Noyal. The Ganges Leather Buyers Platform was formed some years ago by several UK-based companies, sensitive and alert to practices by leather suppliers. Kanpur used to boast about 400 tanneries along the Ganga, the bulk of which would simply dump effluents straight into the river.
Chennai’s severe water crisis is a warning for all cities. For businesses, not making water could soon mean watching assets dry up.
2019, June: Water supply in 3 key river basins dips
Vishwa Mohan, June 28, 2019: The Times of India
Water supply in 3 key river basins dips
NEW DELHI: In the last 26 years, there has been a marginal increase in India’s average annual water resource from 1,869 billion cubic metres (BCM) in 1993 to 1,999 BCM in 2019, but there is a worrying decline in water availability in three key river basins of Indus, Ganga and Brahmaputra.
A new scientific study by the central water commission (CWC) concludes that India is not a water-deficit country but several regions face scarcity due to “severe neglect” of water resources and their storage and conservation. The small increase in annual water resources is more due to use of advanced methodology in slightly bigger catchment areas. While the three major river basins show a decline, the other 17 saw an increase. Unlike other river basins that depend on rainfall for annual water resources, the three big systems — located in north India — are fed by Himalayan glaciers as well, raising the concern that their decline may be linked to climate change-induced conditions in the Himalayas.
Figures in the study, ‘Reassessment of Water Availability in India Using Space Inputs’, show that the Indus river basin (the part lying in India) reported the highest fall. The average water potential of this northernmost basin fell almost 40% from 73 BCM in 1993 to 45 BCM.
The river basins that reported increase in water availability include Narmada, Godavari, Krishna, Cauvery, Mahanadi, Pennar, Sabarmati, Mahi and Subarnarekha among others. This is reassuring news for southern states that often face severe water scarcities but highlight the need for better conservation and use.
The study released by the government on Wednesday was conducted by CWC in collaboration with ISRO’s National Remote Sensing Centre (NRSC), Hyderabad. It used various input datasets like hydro-meteorological (rainfall) data for a 30-year period (1985-2015), soil texture and land use data from 2004-05 to 2014-15.
The study also shows how a rising population and mismanagement of water resources has reduced the annual per capita availability of water substantially from 5,178 cubic metre in 1951 to 1,651 cubic metre in 2011, pushing the country into a water-stressed situation despite increase in annual average water potential.
Though another study done by the National Commission for Integrated Water Resource Development also shows increase in average water availability (1,953 BCM in 1999), the latest research is considered the most reliable.
The CWC study in its conclusion warns that business as usual way of water utilisation would push the country towards a critical phase.
See also
Groundwater: India/ Water Resources: India (ministry data)/ Water Economy: India
