Nutrition: India
(Created page with "{| Class="wikitable" |- |colspan="0"|<div style="font-size:100%"> This is a collection of articles archived for the excellence of their content.<br/> </div> |} [[Category:Ind...") |
|||
| Line 6: | Line 6: | ||
|} | |} | ||
| − | [[Category:India | ]] | + | [[Category:India | N]] |
| − | [[Category:Health | ]] | + | [[Category:Health | N]] |
=1993-2011: Changes= | =1993-2011: Changes= | ||
| + | |||
[http://epaperbeta.timesofindia.com//Article.aspx?eid=31808&articlexml=Indias-eating-habits-may-have-changed-but-not-27122014001066 ''The Times of India''] | [http://epaperbeta.timesofindia.com//Article.aspx?eid=31808&articlexml=Indias-eating-habits-may-have-changed-but-not-27122014001066 ''The Times of India''] | ||
[[File: food.jpg|Average daily calorific intake|frame|500px]] | [[File: food.jpg|Average daily calorific intake|frame|500px]] | ||
Revision as of 12:59, 17 January 2015
This is a collection of articles archived for the excellence of their content. |
1993-2011: Changes
Dec 27 2014
India's eating habits may have changed, but not nutrition levels
Subodh Varma
In the past two decades, India's eating habits have changed but the nutritional level seems to be the same, a recent survey has found. Across the board, people are eating less cereals, replacing them with more fat and snacks, beverages and processed foods. Protein consumption has declined in rural areas and remained the same in urban areas. The average calorific val ue of food consumed was 2,099 kilocalories (Kcal) per person per day in rural areas and 2,058 Kcal in urban areas in 2011, according to the survey report released last week by the National Sample Survey Organisation (NSSO).This is less than the nutritional value in 1993-94, when a similar survey had found the levels at 2,153 in rural areas and 2,099 in urban areas.
The National Institute of Nutrition, ICMR, recommends 2,320 Kcal a day for a man aged 18-29 years, weighing 60kg and in a sedentary job. Kerala, Tamil Nadu and Gujarat have nutritional levels that are almost 10% lower than the national average for rural areas while UP, Punjab, Haryana and Rajasthan have levels 10 to 20% higher, according to a National Sample Survey Organisation (NSSO) survey .
Another shocking aspect is the huge difference in nutritional intake of the poor and the rich. In rural India, a person belonging to the poorest 10% of population has a daily calorie intake of less than 1,724 Kcal, which includes 45g of protein with protein consumption at about 45g and 24g of fat. At the other end, a person from the richest 10% segment consumes more than 2,531 Kcal every day , almost 47% more than the poor person. A similar chasm can be seen in protein and fat consumption too.
In urban areas, this gap is worse. The poorest people get less than 1,679 Kcal per day while the richest get over 2,518 Kcal each -a difference of nearly 50%.
80% in rural India don't get required nutrition The Times of India Almost 80% of rural people and 70% of urban people are not getting the government-recommended 2,400 Kcal per day worth of nutrition, a situation that has very harmful health implications, apart from its sheer in humanity .
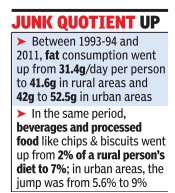
At the national level, daily protein consumption dipped from 60.2g for a person in 199394 to 56.5g in 2011-12 in rural areas and from 57.2g to 55.7g in urban areas. Oil and fat consumption increased from 31 to nearly 42g in rural areas and from 42 to 52.5g in urban areas.
The shares of items like fruits and vegetables, dairy products and egg, meat and fish was about 9% in 1993-94 which has marginally changed to about 9.6% in 2011-12.
The only food item that has seen a substantial jump in intake is classified as `other' in the survey and consists of various hot and cold beverages, processed food like chips, biscuits etc. and snacks. In 1993-94 these made up just 2% of a rural person's nutritional intake but rose to over 7% in 2011-12. In urban areas, this was 5.6% earlier and increased to about 9%.
The report also estimates that the survey would have counted food bought and prepared in a household but eaten by visitors or employees. If this is accounted for, calorific values get reduced by as much as 15-17% in rural areas and 5-6% in urban areas.

