Exports, imports (international trade): India
(→2012-13) |
(→2021-22) |
||
| (One intermediate revision by one user not shown) | |||
| Line 250: | Line 250: | ||
While several countries have reduced their dependence on Russia-refined oil products, India, which has seen a sharp spike in crude imported from Russia, is seen to be processing it and exporting to many countries, especially in Europe. | While several countries have reduced their dependence on Russia-refined oil products, India, which has seen a sharp spike in crude imported from Russia, is seen to be processing it and exporting to many countries, especially in Europe. | ||
| + | |||
| + | ==Indian services exports outstrip goods: 2024 Nov== | ||
| + | [https://epaper.indiatimes.com/article-share?article=17_12_2024_001_016_cap_TOI Dec 17, 2024: ''The Times of India''] | ||
| + | |||
| + | Marking a major shift in India’s trade, services exports are projected to overtake goods shipments in Nov, latest figures shared by the commerce department on Monday showed, reports Sidhartha. After months of sustained increase, last month’s services exports have been provisionally estimated at $35.7 billion, compared with $32.1 billion of merchandise or goods exports. | ||
| + | |||
| + |
“Services are doing well, and we expect exports to reach $1 trillion in the coming years,” said commerce secretary Sunil Barthwal. Typically, the commerce department puts out an estimate or a projection for services the previous month while releasing the goods trade numbers. | ||
| + | |||
| + | |||
| + | ''' Details ''' | ||
| + | |||
| + | [https://epaper.indiatimes.com/article-share?article=17_12_2024_019_003_cap_TOI Sidhartha, Dec 17, 2024: ''The Times of India''] | ||
| + | |||
| + | [[File: The export and import of goods and services from and to India 2023, 2024.jpg| The export and import of goods and services from and to India 2023, 2024 <br/> From: [https://epaper.indiatimes.com/article-share?article=17_12_2024_019_003_cap_TOI Sidhartha, Dec 17, 2024: ''The Times of India'']|frame|500px]] | ||
| + | |||
| + | |||
| + | New Delhi : Marking a major shift in India’s trade, services exports are projected to overtake goods shipments in Nov, latest figures shared by the commerce department showed. | ||
| + | |||
| + |
After months of sustained increase, last month’s services exports have been provisionally estimated at $35.7 billion, compared with $32.1 billion of merchandise or goods exports.
“Services are doing well, and we expect exports to reach $1 trillion in the coming years,” said commerce secretary Sunil Barthwal. Typically, the commerce department puts out an estimate or a projection for services the previous month while releasing the goods trade numbers. Then, RBI releases its estimates. For instance, RBI has estimated Oct services exports at $34.3 billion, compared with the commerce department’s projection of $34 billion when the goods trade data was released last month. | ||
| + | |||
| + |
Services have held steady as Global Capability Centres (GCCs) have more than made up for the muted rise in IT and IT-enabled exports, with management, legal and accounting services also seeing healthy growth. In contrast, goods trade has been hit by the slowdown in Europe and other parts of the world due to high inflation as well as conflict in west Asia and Ukraine.
| ||
| + | |||
| + | Currently, software is the big daddy of services, accounting for 47% of exports last year, with nearly 70% heading to the US. | ||
| + | |||
| + |
Going forward, govt is seeking to make it more balanced. The commerce department has identified six services — IT and IT-enabled services, business services, maritime services, tourism, audio visual, gaming and related services and digitally delivered health and education — for special focus. “We are preparing a strategy to push growth in these sectors, factoring in the demand as well as the skill and scale that we have in the country,” an official told TOI. | ||
| + | |||
| + |
For instance, govt is looking at how GCCs can be given further impetus, or how mari- time can help Indian companies not just service global clients but also help in delivering Indian goods across the seas, especially when it has been identified as a strategic sector. Tourism is seen as a big opportunity, given that there are a plethora of destinations to showcase and can create a large number of jobs. | ||
| + | |||
| + |
“This number (Nov) should not surprise anyone. Higher services growth has been a consistent trend and is now resulting into higher export values,” said Ajay Srivastava, who leads research body GTRI, while identifying other business services as the rising star. | ||
| + | |||
| + |
While goods exports can once again overtake services in the coming months, GTRI has projected that going by the current growth trends from 2018-19 to 2023-24, by 2029-30 services exports will reach $618.2 billion, edging past merchandise exports, which are projected at $613 billion.
| ||
| + | |||
| + | Over the last 11 years, services trade has grown faster than goods, not just for India but globally. And, India has outpaced global growth on both fronts. In its latest update, UNCTAD said that global trade is projected to reach a record $33 trillion, rising 3.3% this year, with services notching up 7% growth. | ||
[[Category:Economy-Industry-Resources|T EXPORTS, IMPORTS (INTERNATIONAL TRADE): INDIAEXPORTS, IMPORTS (INTERNATIONAL TRADE): INDIAEXTERNAL/ INTERNATIONAL TRADE (EXPORTS, IMPORTS): INDIA | [[Category:Economy-Industry-Resources|T EXPORTS, IMPORTS (INTERNATIONAL TRADE): INDIAEXPORTS, IMPORTS (INTERNATIONAL TRADE): INDIAEXTERNAL/ INTERNATIONAL TRADE (EXPORTS, IMPORTS): INDIA | ||
| Line 375: | Line 408: | ||
'' India's top 5 import partners, 2010-20 '' | '' India's top 5 import partners, 2010-20 '' | ||
| − | [[ | + | =India’s rank among importing markets= |
| − | + | ==2023== | |
| − | + | [[File: India’s rank among the world’s Top 15 importing markets, presumably as in 2023.jpg|India’s rank among the world’s Top 15 importing markets, presumably as in 2023 <br/> From: [https://epaper.indiatimes.com/article-share?article=27_09_2024_012_014_cap_TOI Sep 27, 2024: ''The Times of India'']|frame|500px]] | |
| − | + | ||
| − | + | '''See graphic''': | |
| − | + | ||
| + | '' India’s rank among the world’s Top 15 importing markets, presumably as in 2023 '' | ||
[[Category:Economy-Industry-Resources|T EXPORTS, IMPORTS (INTERNATIONAL TRADE): INDIAEXPORTS, IMPORTS (INTERNATIONAL TRADE): INDIAEXTERNAL/ INTERNATIONAL TRADE (EXPORTS, IMPORTS): INDIA | [[Category:Economy-Industry-Resources|T EXPORTS, IMPORTS (INTERNATIONAL TRADE): INDIAEXPORTS, IMPORTS (INTERNATIONAL TRADE): INDIAEXTERNAL/ INTERNATIONAL TRADE (EXPORTS, IMPORTS): INDIA | ||
Latest revision as of 20:17, 6 January 2025
This is a collection of articles archived for the excellence of their content. |
[edit] Benefits of exports
[edit] Benefits to states
January 30, 2018: The Times of India
See graphic:
1. States that export more internationally, and trade more with other states, tend to be richer
2. Top 1% of Indian firms account for 38% of exports-in other countries, they account for a substatially greater share
3. The relief from embedded state taxes (ROSL) announced in 2016 boosted exports of ready-made garments (but not others) by about 16%
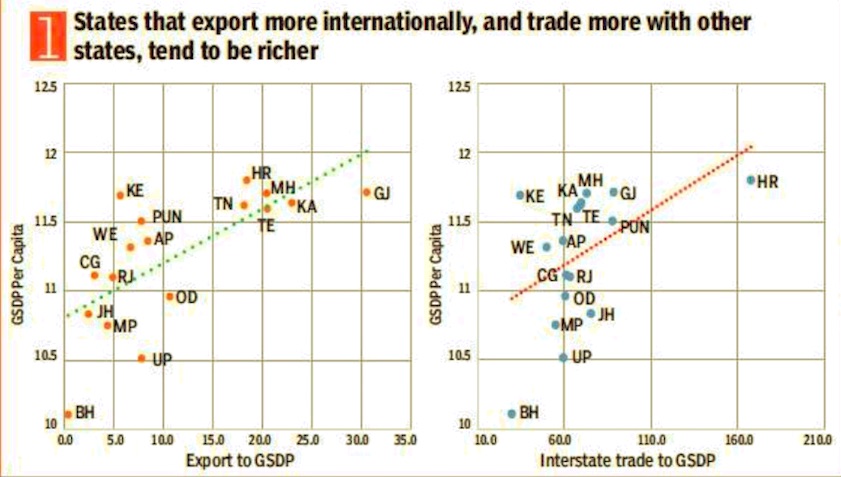
From: January 30, 2018: The Times of India
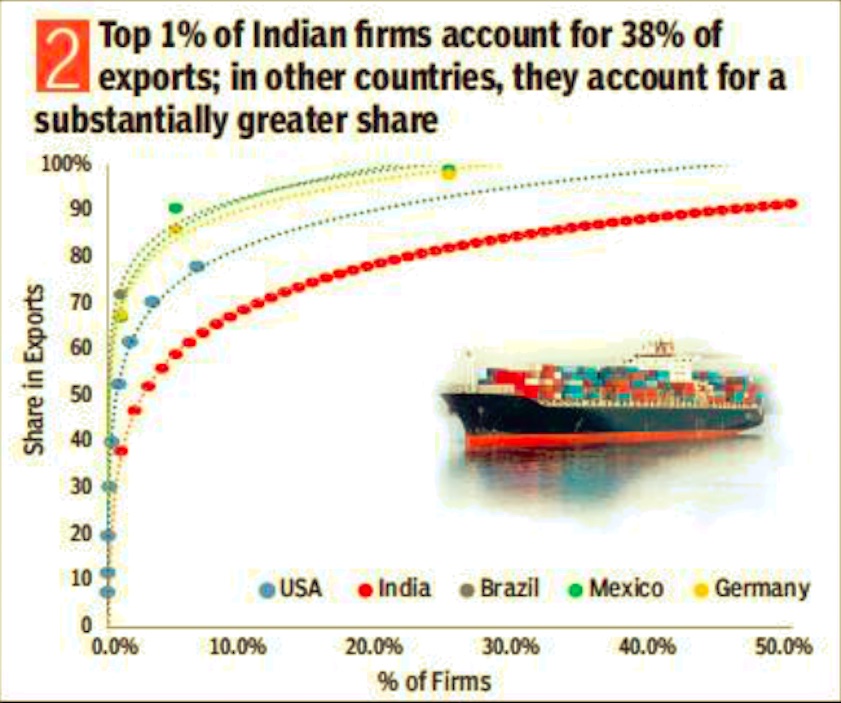
From: January 30, 2018: The Times of India
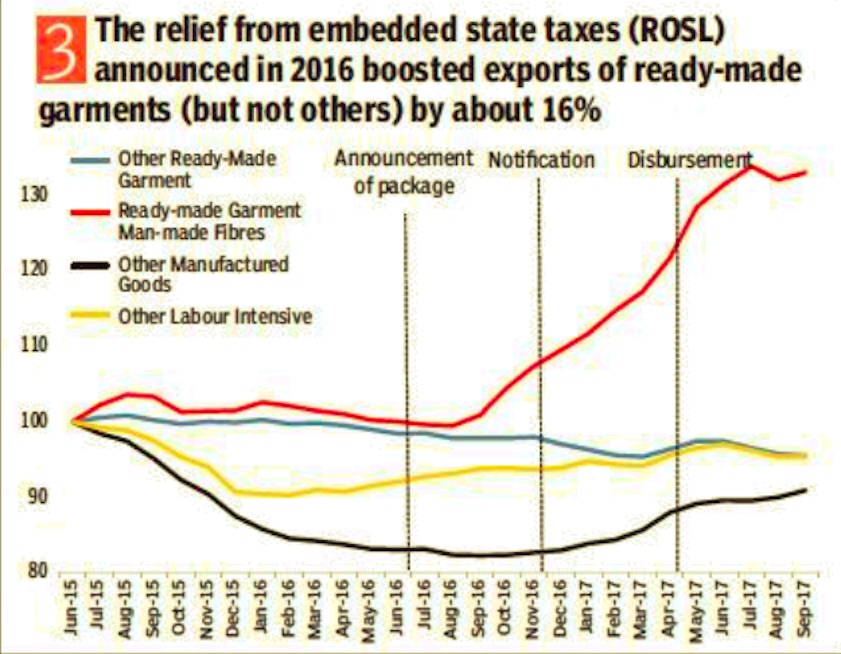
From: January 30, 2018: The Times of India
Global trade is seen as a crucial element in the strategy to propel growth, given its link to the overall development. The Economic Survey cites the experience of garments where incentives helped push shipments
[edit] Export complexity
[edit] India vis-à-vis the world
[edit] 2000> 2019

From: August 12, 2021: The Times of India
See graphic:
The complexity of India’s exports, vis-à-vis the world, 2000> 2019
[edit] Exports from India
[edit] 1991-2015, the Top 5

See graphic:
Top 5 exports from India, 1991-2015
[edit] 2016> 2021
From: Sep 20, 2021: The Times of India
From: Sep 20, 2021: The Times of India
From: Sep 20, 2021: The Times of India

From: Sep 20, 2021: The Times of India

From: Sep 20, 2021: The Times of India
From: Sep 20, 2021: The Times of India
See graphics:
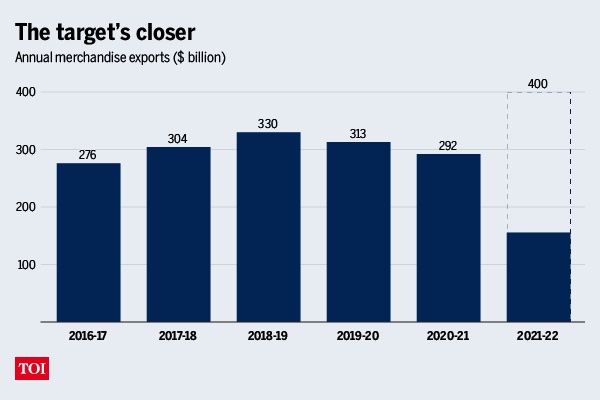
Annual merchandise exports, 2016- 22
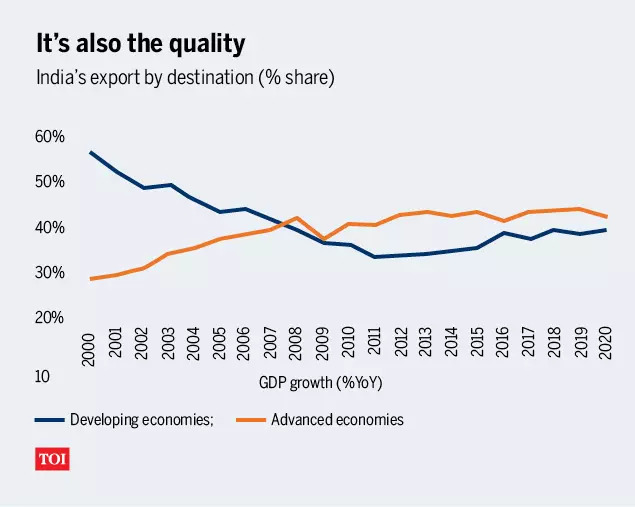
India's export by destination, 2000-20
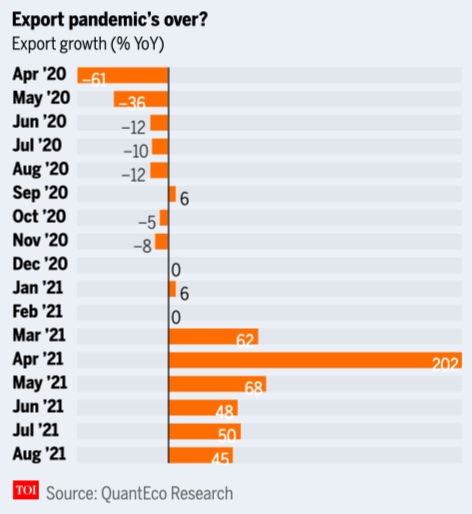
Exports growth, April 2020- August 2021
India's top exports, 2021.
Quarterly export data, 2017- 21; April- August cumulative exports, 2017- 22, year-wise
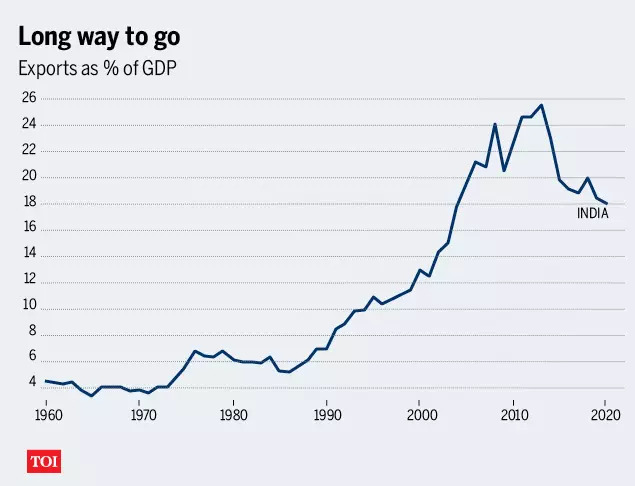
Exports as % of GDP, 1960- 20
[edit] Petroleum products, 2005-15

See graphic:
India’s export of petroleum products, 2005-15
[edit] 2005-15: The main sectors that exported goods/ services
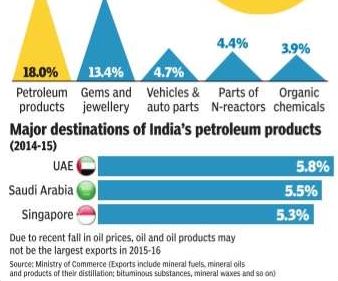
See graphic:
The sectors that contributed to Indian exports in 2005-15
[edit] 2013-19

India’s imports and trade deficit: 2017-19
From: April 16, 2019: The Times of India
See graphic:
India’s exports: 2013-19
India’s imports and trade deficit: 2017-19
[edit] 2014> 2019: exports
Exports in 2018-19 set to finally scale 2013-14 level, March 16, 2019: The Times of India
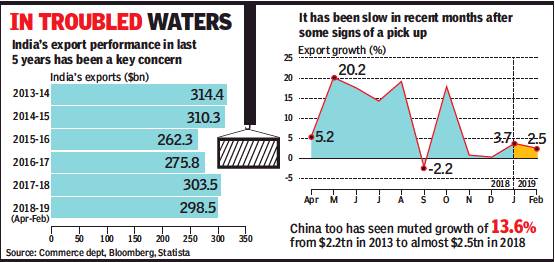
From: Exports in 2018-19 set to finally scale 2013-14 level, March 16, 2019: The Times of India
Officials Blame Global Slowdown For Recent Sluggishness
Exports appear on course to finally cross the 2013-14 level during the current financial year despite the sluggishness seen in recent months.
Data released by the commerce department showed that exports inched up by 2.5% to $26.7 billion in February as several key sectors, such as engineering goods, chemicals, rice and cotton yarn and fabrics reported tepid growth, while oil product exports fell by 7.7%. And, with gold, electronics and crude imports shrinking in February, the overall import bill fell by over 5.4% to $36.3 billion, narrowing the trade deficit to $9.6 billion, compared to $12.3 billion in February last year. In fact, during February, 12 of the 30 closely watched segments showed a decline in the value of shipments.
During April-February, India’s exports are estimated to be 8.8% higher at $298.5 billion, while imports are up a shade under 10% at $464 billion.
Policymakers and trade experts are keeping close tabs on the export numbers, as the Modi government has so far fallen short of scaling the level of exports that it had inherited. Government officials blame it on the global export slowdown as well as growing protectionism across the world, especially in the US, which had been an advocate of free trade.
With March expected to see a year-end rush of shipments, the Modi administration expects to close the year with exports of around $330 billion, helping it scale the record $314 billion reached during UPA’s last year in office.
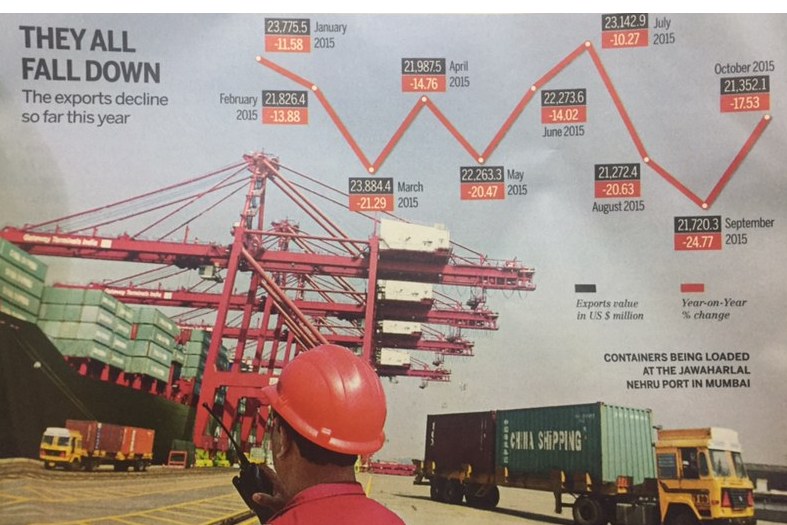
[edit] 2015: exports decline
See graphic:
Exports value in US $ million; Year-on-year % change, 2015
[edit] 2018: 9% increase
Exports rise 9% to touch record $331bn, April 16, 2019: The Times of India
Exports rose 9% to touch a record high of $331billion during 2018-19 as sectors such as petroleum and electronics drove the growth. But with imports too rising at nearly the same pace, the trade deficit widened to $176 billion, compared with $162 billion a year ago.
It was, however, the export numbers that were being cited as a major achievement in the wake of a global trade slowdown that has been attributed to protectionist policies, especially in the United States.
It will also come as a shot in the arm for policymakers as the NDA government’s track record on the export front had been poor. In fact, in the first two years, it had seen a contraction. A pickup in exports is seen to be crucial to revive the manufacturing sector, where growth has slowed down in recent months.
[edit] 2016> 2021

From: Sep 20, 2021: The Times of India

From: Sep 20, 2021: The Times of India

From: Sep 20, 2021: The Times of India

From: Sep 20, 2021: The Times of India

From: Sep 20, 2021: The Times of India

From: Sep 20, 2021: The Times of India
See graphics:
Annual merchandise exports, 2016- 22
India's export by destination, 2000-20
Exports growth, April 2020- August 2021
Quarterly export data, 2017- 21; April- August cumulative exports, 2017- 22, year-wise
Exports as % of GDP, 1960- 20
[edit] 2019, H1: 'India gained $755m due to US-China trade war
Nov 6, 2019: The Times of India
Key Highlights
A study, conducted by the UN trade and investment body, puts the trade diversion effects of the US-China tariff war for the first half of 2019 at about $21 billion
The US tariffs on China have made other players more competitive in the US market and led to a trade diversion effect
UNITED NATIONS: India gained about $755 million in additional exports, mainly of chemicals, metals and ore, to the US in the first half of 2019 due to the trade diversion effects of Washington's tariff war with China, a study by the UN trade and investment body has said.
The study — Trade and trade diversion effects of United States tariffs on China — shows that the ongoing US-China trade war has resulted in a sharp decline in bilateral trade, higher prices for consumers and trade diversion effects - increased imports from countries not directly involved in the trade war.
The study puts the trade diversion effects of the US-China tariff war for the first half of 2019 at about $21 billion, implying that the amount of net trade losses corresponds to about $14 billion.
The US tariffs on China have made other players more competitive in the US market and led to a trade diversion effect. These trade diversion effects have brought substantial benefits for Taiwan (province of China), Mexico, and the European Union.
"Trade diversion benefits to Korea, Canada and India were smaller but still substantial, ranging from $0.9 billion to $1.5 billion," it said. The remainder of the benefits were largely to the advantage of other South East Asian countries.
The US tariffs on China resulted in India gaining $755 million in additional exports to the US in the first half of 2019 by selling more chemicals ($243 million), metals and ore ($181 million), electrical machinery ($83 million) and various machinery ($68 million) as well as increased exports in areas such as agri-food, furniture, office machinery, precision instruments, textiles and apparel and transport equipment, UNCTAD said.
While it does not consider the impact of Chinese tariffs on US imports, the study indicates that qualitative results are most likely to be analogous: higher prices for Chinese consumers, losses for US exporters and trade gains for other countries.
Of the $35 billion Chinese export losses in the US market, about $21 billion (or 62 per cent) was diverted to other countries, while the remainder of $14 billion was either lost or captured by the US producers.
The study found that tariffs imposed by the United States on China are economically hurting both countries and that consumers in the US are bearing the heaviest brunt of Washington's tariffs on Beijing, as their associated costs have largely been passed down to them and importing firms in the form of higher prices.
However, the study also finds that Chinese firms have recently started absorbing part of the costs of the tariffs by reducing the prices of their exports.
"The results of the study serve as a global warning. A lose-lose trade war is not only harming the main contenders, it also compromises the stability of the global economy and future growth," UNCTAD's director of international trade and commodities Pamela Coke Hamilton said. "We hope a potential trade agreement between the US and China can de-escalate trade tensions."
The analysis shows that US tariffs caused a 25 per cent export loss, inflicting a $35 billion blow to Chinese exports in the US market for tariffed goods in the first half of 2019. This figure also shows the competitiveness of Chinese firms which, despite the substantial tariffs, maintained 75 per cent of their exports to the US.
The office machinery and communication equipment sectors were hit the hardest, suffering a $15 billion reduction of US imports from China as trade in tariffed goods in those sectors fell by an average of 55 per cent.
Though the study does not examine the impact of the most recent phase of the trade war, it warns that the escalation in summer of 2019 is likely to have added to the existing losses, UNCTAD said.
"US consumers are paying for the tariffs … in terms of higher prices," said Alessandro Nicita, an economist at UNCTAD. "Not only final consumers like us, but importers of intermediate products – firms which import parts and components from China."
Since mid-2018, the US and China have been locked in a trade confrontation that has resulted in several rounds of retaliatory tariffs. Over the course of 2018, the US administration started implementing a series of trade measures to curtail imports, first targeting specific products (steel, aluminum, solar panels and washing machines) and then specifically targeting imports from China.
In the early summer 2018, US and China raised tariffs on about $50 billion worth of each other's goods. This escalated further in September 2018 when the US introduced an additional 10 per cent to cover $200 billion worth of Chinese imports, to which China retaliated by imposing tariffs on imports from the US worth an additional $60 billion.
In June 2019, the US increased the tariffs further, to 25 per cent. China responded by raising the tariffs on a subset of products that were already subject to tariffs. In September 2019, the US imposed 15 per cent tariffs on a large subset of the remaining $300 billion worth of imports from China not yet subject to tariffs.
[edit] 2021-22
Sidhartha, Dec 19, 2022: The Times of India

From: Sidhartha, Dec 19, 2022: The Times of India
NEW DELHI: Netherlands has emerged as India's third largest export destination, trailing the US and UAE, during April-October this year, rising from the eighth spot a year ago. Brazil, which was India's 20th biggest export destination between April and October 2021, is currently placed eight, according to the latest disaggregated data available with the commerce department.
And, Tanzania has seen imports from India soar three times to $2.4 billion during the first seven months of the current financial year.
While the three countries may be spread across different continents, there is a common thread - oil exports. In the case of Tanzania, over 80% or $1.3 billion of the $1.6 billion in exports from India is on account of more petrol and diesel shipped to the African nation.
While an increase in prices have certainly played a role, the increase in oil exports comes at a time when the Russia-Ukraine conflict has upset the oil economics around the globe.
During April-October, India's total exports went up 12.5% to over $263 billion, while oil product exports soared nearly 70%. In the case of the Netherlands, Brazil, Tanzania, Togo, Israel and Oman, oil shipments have soared at a much higher pace (see graphic).
While several countries have reduced their dependence on Russia-refined oil products, India, which has seen a sharp spike in crude imported from Russia, is seen to be processing it and exporting to many countries, especially in Europe.
[edit] Indian services exports outstrip goods: 2024 Nov
Dec 17, 2024: The Times of India
Marking a major shift in India’s trade, services exports are projected to overtake goods shipments in Nov, latest figures shared by the commerce department on Monday showed, reports Sidhartha. After months of sustained increase, last month’s services exports have been provisionally estimated at $35.7 billion, compared with $32.1 billion of merchandise or goods exports.
“Services are doing well, and we expect exports to reach $1 trillion in the coming years,” said commerce secretary Sunil Barthwal. Typically, the commerce department puts out an estimate or a projection for services the previous month while releasing the goods trade numbers.
Details
Sidhartha, Dec 17, 2024: The Times of India

From: Sidhartha, Dec 17, 2024: The Times of India
New Delhi : Marking a major shift in India’s trade, services exports are projected to overtake goods shipments in Nov, latest figures shared by the commerce department showed.
After months of sustained increase, last month’s services exports have been provisionally estimated at $35.7 billion, compared with $32.1 billion of merchandise or goods exports. “Services are doing well, and we expect exports to reach $1 trillion in the coming years,” said commerce secretary Sunil Barthwal. Typically, the commerce department puts out an estimate or a projection for services the previous month while releasing the goods trade numbers. Then, RBI releases its estimates. For instance, RBI has estimated Oct services exports at $34.3 billion, compared with the commerce department’s projection of $34 billion when the goods trade data was released last month.
Services have held steady as Global Capability Centres (GCCs) have more than made up for the muted rise in IT and IT-enabled exports, with management, legal and accounting services also seeing healthy growth. In contrast, goods trade has been hit by the slowdown in Europe and other parts of the world due to high inflation as well as conflict in west Asia and Ukraine.
Currently, software is the big daddy of services, accounting for 47% of exports last year, with nearly 70% heading to the US.
Going forward, govt is seeking to make it more balanced. The commerce department has identified six services — IT and IT-enabled services, business services, maritime services, tourism, audio visual, gaming and related services and digitally delivered health and education — for special focus. “We are preparing a strategy to push growth in these sectors, factoring in the demand as well as the skill and scale that we have in the country,” an official told TOI.
For instance, govt is looking at how GCCs can be given further impetus, or how mari- time can help Indian companies not just service global clients but also help in delivering Indian goods across the seas, especially when it has been identified as a strategic sector. Tourism is seen as a big opportunity, given that there are a plethora of destinations to showcase and can create a large number of jobs.
“This number (Nov) should not surprise anyone. Higher services growth has been a consistent trend and is now resulting into higher export values,” said Ajay Srivastava, who leads research body GTRI, while identifying other business services as the rising star.
While goods exports can once again overtake services in the coming months, GTRI has projected that going by the current growth trends from 2018-19 to 2023-24, by 2029-30 services exports will reach $618.2 billion, edging past merchandise exports, which are projected at $613 billion.
Over the last 11 years, services trade has grown faster than goods, not just for India but globally. And, India has outpaced global growth on both fronts. In its latest update, UNCTAD said that global trade is projected to reach a record $33 trillion, rising 3.3% this year, with services notching up 7% growth.
[edit] Export of creative goods and services
[edit] 2012-13
The Times of India, September 25, 2015
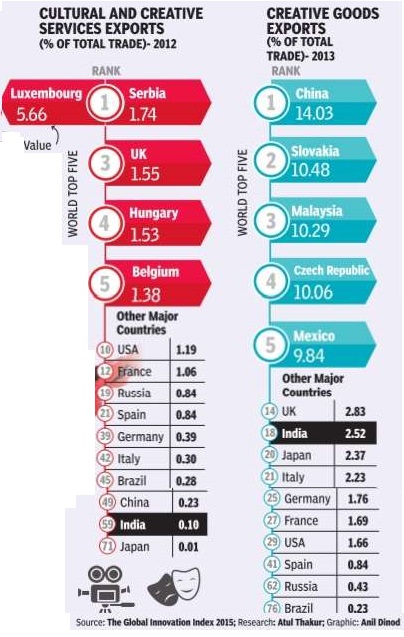
India's soft power through the export of entertainment movies, music, television sitcoms and cricket -is indisputable. Data on the export of creative goods and services as a proportion of total exports, however, suggests it is a bit overrated. According to the recently released global innovation index, India was 59th in the world in the export of cultural and creative services (audio visual and other recreational services). In exports of creative goods (merchandise, processing and repairs of goods categorised as creative), India is ranked 18th.Interestingly, China is ranked above India in both these categories.
[edit] 2021, 2022
Swaminathan Anklesaria Aiyar, April 19, 2023: The Times of India
Services exports are soaring without subsidies or tariff protection. Despite aatmanirbhar and the production-linked incentive (PLI) scheme, India accounts for just 1.5% of world merchandise exports, but over 4% of world service exports.
In 2022-23, India’s merchandise exports grew by just 6% to $447bn, while service exports soared by 27% to $323bn. Service exports will soon overtake merchandise exports. The most remarkable growth is of ‘other business services’ (OBS). These appear to come substantially from global capability centres (GCCs) of multinational companies (MNCs) in India.
A National Association of Software and Service Companies (Nasscom)-Deloitte report estimated that by 2021, over 1,400 MNCs had GCCs in India, initially for low-tech back-office work, but increasingly for high-value activities including engineering services and research and development (R&D).
In labour-intensive sectors like manufacturing, India cannot compete with Bangladesh or Vietnam In 2021, their turnover was $36bn. Their employment was 1.38mn, of whom a whopping 42% were in engineering R&D. Over 40% of GCCs globally are in India.
The business media ignore GCCs since these lack independent balance sheets. But they demonstrate a remarkable facet of globalisation: The internal trade of MNCs has become the international trade of nations. MNCs are shifting a wide range of white-collar work, from low-end to high-end, to India to meet their global needs. These show up in export data as OBSes.
Comparing exports over 10 years, economist Ajay Shah calculates that merchandise exports have risen at an annual rate of 1.2%, service exports at 5.8% and OBSes at 8.7%. In Q3 2022-23, the share of OBSes in total service exports was $21bn out of $83bn.
Pranjul Bhandari has studied services exports over three years starting September 2019. Professional and management service exports soared 27%, computer software exports rose 16%, and R&D exports 13%. In the last five years, services exports have risen from a bit over 6% of gross domestic product to almost 10%.
India now produces 600,000 engineers a year and MNCs are harnessing these engineers for their global workforce.
Amazingly, GCCs have soared to dizzy heights without publicity, subsidies or ministerial speeches. They flow from the logic of a global marketplace, with MNCs seeking to harness comparative advantage wherever it lies. They have been reluctant to use India as a base for labour-intensive manufactures, since India lacks a comparative advantage here, and cannot compete with Bangladesh or Vietnam.
But India has a huge comparative advantage in skilled labour, especially engineering skills. India now produces 600,000 engineers a year and MNCs are harnessing this flow of inexpensive skills. Accenture has 300,000 of its global workforce of 700,000 in India. IBM and Capgemini have over 100,000 employees each here. In 2005, I visited Pune to meet Rahul Bajaj of Bajaj Auto and Baba Kalyani of Bharat Forge. Bajaj told me that unionised blue-collar workers at his Akurdi factory were not highly productive.
So, at his new Chakan factory, 80% of staff consisted of diploma engineers who cost only slightly more than blue-collar workers but were far more productive.
Kalyani said that Bharat Forge earlier tried to become internationally competitive using cheap blue-collar workers, but found they were not productive enough.
Then he shifted to a revolutionary approach of ‘zero blue-collar workers’, employing only engineers. (Some menial tasks were done by contract labour.) This strategy enabled Bharat Forge to become a global champion in auto components.
Both companies demonstrated that India’s comparative advantage lay in skilled labour, not blue-collar labour. That same comparative advantage is now demonstrated in IT and GCC exports. Politicians and economists bemoan India’s failure in labour-intensive exports. Historically, economic development lay in shifting workers from agriculture to low-end manufacturing and then to services. India fared poorly in the first transition because obstructive labour laws and a huge number of holidays and leave entitlements made unionised labour uncompetitive.
India leapfrogged into high-end software exports. But analysts complained that people moving out of agriculture could do low-end jobs intextiles and footwear, but not high-end jobs.
However, Nasscom says that for every engineer, the software industry employs one low-level worker for transport, canteens and general maintenance. Software companies run entire special economic zones (SEZs) and training campuses. These provide jobs to those moving out of agriculture.
[edit] Export promotion programmes
[edit] 2018-19: revenue loss; status
Sep 10, 2019: The Times of India
From: Sep 10, 2019: The Times of India
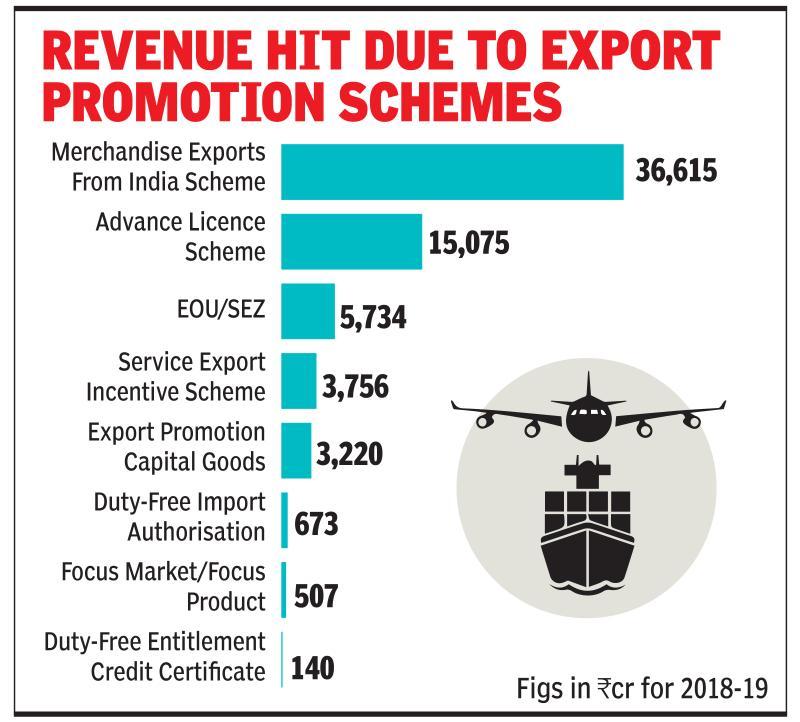
NEW DELHI: As the government works on an “export package”, the finance ministry has said that it may not be possible for the government to shift all exports to the Rebate of State and Central Taxes and Levies (RoSCTL) scheme, given the Budget constraints. Instead, it wants the commerce department to identify priority sectors which need more support. RoSCTL is a replacement for the existing Merchandise Exports from India Scheme (MEIS). The commerce department put together the new scheme after the US dragged India’s export promotion programmes to the World Trade Organization and is expected to be taken up by the Union Cabinet shortly. On an average, the government has estimated that the incidence of central and state levies added up to 4-5%, which needed to be refunded. With merchandise exports estimated at over $330 billion, refund of levies would add up to over $16 billion or more than Rs 1.1 lakh crore, sources said.
For the current fiscal year, the Centre has budgeted for a revenue impact of Rs 65,720 crore on account of all export-promotion schemes. Of this, MEIS is estimated to have an impact of Rs 36,615 crore. Already, some of the GST is refunded to exporters. The government recently released Rs 6,000 crore for the textiles industry, while insisting that some of the other sops for exporters should be dropped. While the rebate scheme for all exporters is being finalised, the government is also working on ways to improve access to loans for which commerce and industry minister Piyush Goyal has held several round of deliberations. Sources said that the scheme is almost ready and is expected to be announced shortly. In an interview last week, finance secretary Rajiv Kumar too had underlined the need to offer incentives to exporters. This, he said, will help use up idle capacity in the manufacturing sector and also result in import substitution.
[edit] Garments
[edit] Second-hand clothes: import, export of
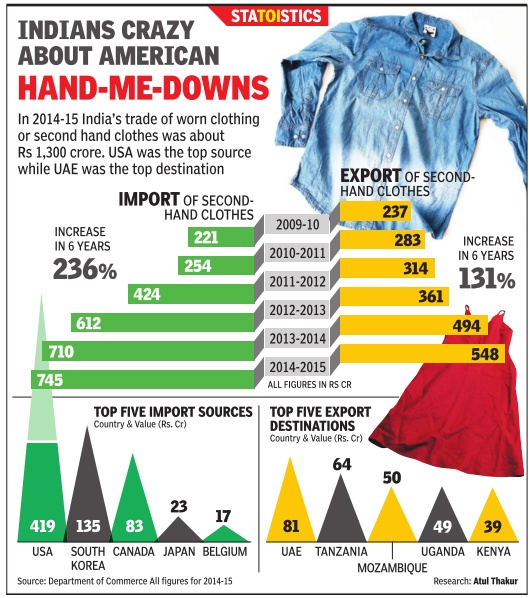
See graphic:
2014-15: The import and export of second-hand clothes
[edit] Import duties
[edit] 2017-21
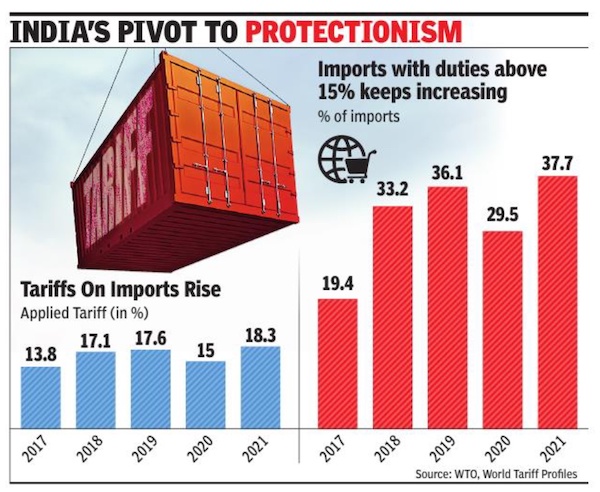
From: Arvind Panagariya,August 11, 2022: The Times of India
See graphic:
India’s Import duties, 2017-21, and their impact
[edit] Imports into India
[edit] 1991-2015, the Top 5
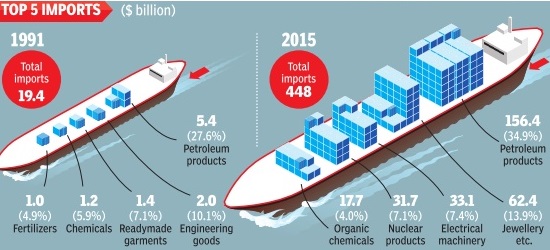
See graphic, ' Top 5 imports into India, 1991-2015 '
[edit] 2011-18: the three main imports
October 9, 2018: The Times of India
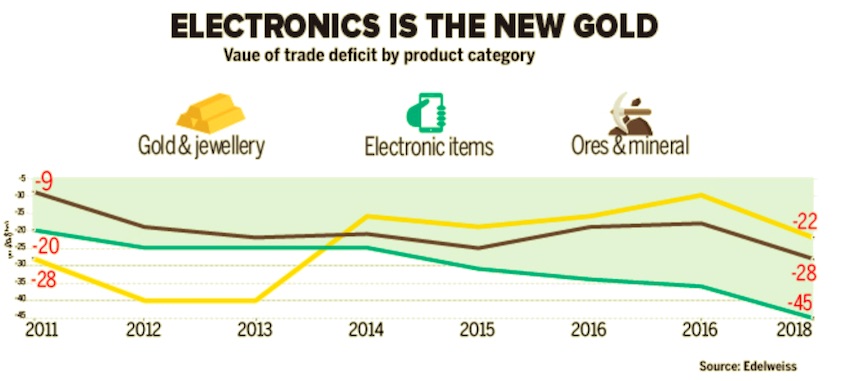
From: October 9, 2018: The Times of India
See graphic:
2011-18: India’s three main imports
One of the triggers for the rupee’s weakness — both in 2013 and 2018 — has been the rising current account deficit (CAD). Imports of gold, which was one of the main reasons of the currency’s depreciation in 2013, have almost halved in five years. But electronic imports are the new gold, with the net deficit in electronics trade nearly doubling to $45 billion in 2018 from $25 billion in 2013.
[edit] 2017-19: the Top 10 countries India imports from

From: June 15, 2019: The Times of India
See graphic, '2017-19: the Top 10 countries that India imports from '
[edit] 2020: the top 5 sources of imports
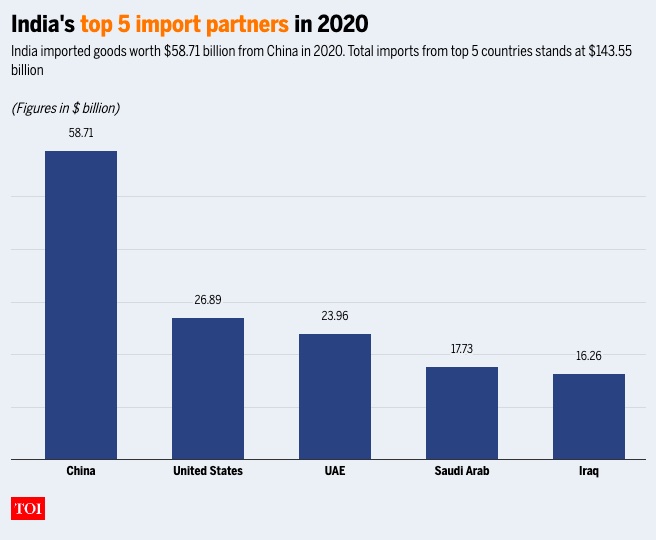
From: March 18, 2021: The Times of India
See graphic:
India's top 5 import partners, 2010-20
[edit] India’s rank among importing markets
[edit] 2023

From: Sep 27, 2024: The Times of India
See graphic:
India’s rank among the world’s Top 15 importing markets, presumably as in 2023
[edit] Perception of quality of Indian products
[edit] 2018: Countries in which goods made in India are perceived positively, and negatively
March 22, 2018: The Times of India

From: March 22, 2018: The Times of India
HIGHLIGHTS
Are 'Made in India' products making the kind of wave across the globe that the Narendra Modi-government had envisaged? TOI brings to you data that shows which parts of the world think our products are 'slightly or very positive'
The Narendra Modi-government's flagship 'Make in India' project launched in 2014, has, so far, received mixed responses. While few doubt the government's intent behind pushing the manufacturing sector's agenda, experts have raised concerns on the implementation of the project.
A data set by Statista.com -- a statistics, market research and business intelligence portal-- shows that products manufactured under the 'Make in India' initiative are particularly valued in the middle-east. Respondents from United Arab Emirates (UAE), Bahrain and Saudi Arabia top the chart in opining that products made in India are 'slightly or very positive.'
38 per cent of Chinese and a quarter of respondents from the US and UK also believe the same.
The ranking displays the results of the worldwide Made-In-Country Index 2017, a survey conducted to show how positively products "made in..." are perceived in various countries all over the world. 43,034 respondents answered the question "On a lot of products you can find a label stating where the product was made. How do you feel about products labeled with…?" on a 5-level scale. The sample represents 90 per cent of the global population, according to Statista.
"Never was the volume of international goods transport higher than during this decade. Today, the meaning of the "made in" label is more important than ever," the research firm said. In the Economic Survey for the financial year 2017-18 released earlier this year, the government earmarked 10 sectors, including capital goods, auto, defence, pharma and renewable energy to push growth in manufacturing and generate job opportunities.
The other sectors are biotechnology, chemicals, electronic system design and manufacturing, leather, textiles, food processing, gems & jewellery, construction, shipping and railways.
Christening the initiative as 'Make in India 2.0', government identified these sectors as the ones which have potential to become global champions and drive double-digit growth in manufacturing.
[edit] Preparedness for exports
[edit] 2023
July 18, 2023: The Times of India
New Delhi: Tamil Nadu has topped Niti Aayog’s export preparedness index, moving ahead of Maharashtra and Gujarat. Gujarat had topped the rankings in the previous two years of the index.
Export preparedness index is a data-driven study aimed to serve as a tool for states to evaluate their export performance across 56 indicators, and identify the underlying causes of their challenges.
Karnataka emerged third in the overall rankings, followed by Gujarat which was pushed to the fourth spot. Haryana, Telangana, Uttar Pradesh, Andhra Pradesh, Uttarakhand and Punjab were among the top ten states.
The report presents a comprehensive analysis of India’s export performance in FY22, along with its sector-specific and district-level merchandise export trends. It evaluates the performance of the states across four pillars — policy, business ecosystem, export ecosystem and export performance.
The report released by Niti Aayog vice chairman Suman Bery Monday showed that most ‘coastal states’ have performed well, with TN, Maharashtra, Karnataka and Gujarat being the top-performers in the export preparedness index across the country in all categories of states. “As we look towards 2047 and becoming the third largest economy, we need to focus on fostering competitiveness in service and agriculture exports along with manufacturing. To achieve it, comparative advantages of states should be leveraged,” he said.
“Consistent investment in research and development can foster innovation, which in turn can facilitate higher efficiency in exports, and diversification of India’s export basket. Further efforts in identification of new markets and exporting diversified products according to the state’s competitive advantage can help India in improving its global footprint,” said the report.
[edit] Regional Comprehensive Economic Partnership (RCEP)
[edit] Why India did not join
Payal Bhattacharya, November 15, 2020: The Times of India
From: Payal Bhattacharya, November 15, 2020: The Times of India
From: Payal Bhattacharya, November 15, 2020: The Times of India
From: Payal Bhattacharya, November 15, 2020: The Times of India
Why India opted out of world's biggest trade deal signed today
NEW DELHI: Fifteen Asia-Pacific countries — with a combined gross domestic product (GDP) of over $26 trillion and comprising nearly one-third of the world's population — signed the world's biggest trade deal at the 37th Association of Southeast Asian Nations (Asean) Summit on November 15.
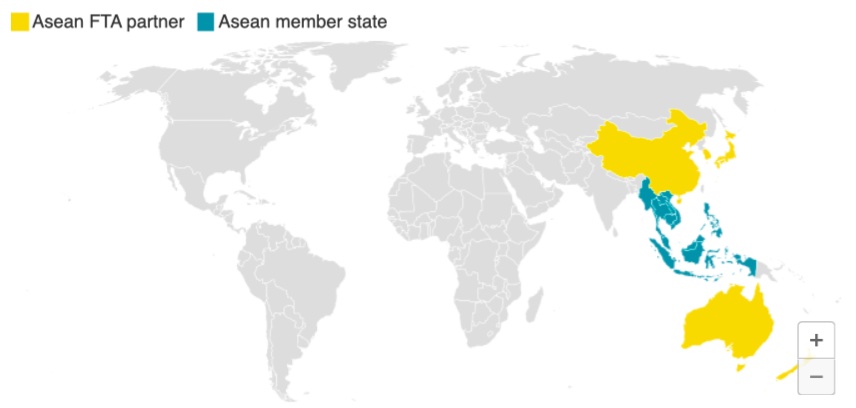
The Regional Comprehensive Economic Partnership (RCEP) aims to achieve a modern, comprehensive, high-quality and mutually beneficial economic partnership agreement among the Asean member states and its FTA (free trade agreement) partners.
However, as negotiations to finalise the long-overdue agreement entered its final stages, in November 2019, Prime Minister Narendra Modi surprised fellow member nations by choosing to opt out of it.
Following India's withdrawal, the remaining 15 nations signed the RCEP on Sunday on the sidelines of the annual summit of the 10-nation Association of Southeast Asian Nations, which Vietnam was hosting virtually. However, many participating nations are also becoming too economically dependent on China with the pact seen as a coup for it in extending its influence across the region.
What is RCEP
The RCEP negotiations were launched by leaders from 10 Asean member states (Brunei Darussalam, Cambodia, Indonesia, Loas, Malaysia, Myanmar, the Philippines, Singapore, Thailand and Vietnam) and six Asean FTA partners (Australia, China, India, Japan, Korea and New Zealand) during the 21st Asean summit in Phnom Penh in Cambodia in November 2012.
The agreement allows for common one set of rules of origin to qualify for tariffs reduction with other RCEP members. This means less procedures and easier movement of goods. That should encourage multinational firms to invest more in the region, including building supply chains and distribution hubs.
Since China is the key source of imports and is also the main export destination for most member nations, the deal is likely to it in a better position to shape the region's trade rules. The new tariff regime will kick in from 2022 and will see duties go back to 2014 levels.
India's exit from RCEP
India pulled out of the China-backed trade agreement as negotiations failed to address its core concerns. These were threat of circumvention of rules of origin due to tariff differential, inclusion of fair agreement to address the issues of trade deficits and opening of services.
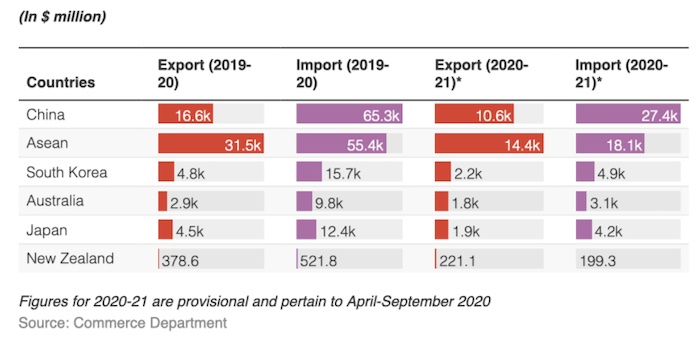
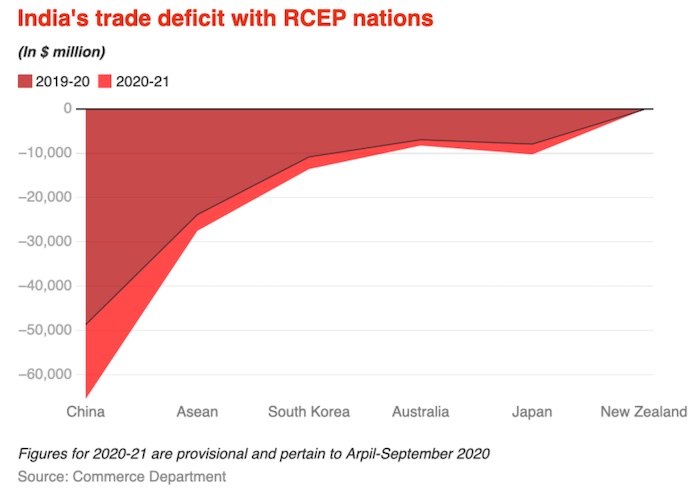
The deal would have brought down import duties on 80% to 90% of the goods, along with easier service and investment rules. Some in Indian industry feared that reduced customs duty would result in a flood of imports, especially from China with which it has a massive trade deficit. India’s trade deficit with other RCEP countries were also rising.
In its negotiations, the government had also raised the issue of unavailability of MFN (Most Favoured Nation) obligations, where it would be forced to give similar benefits to RCEP countries that it gave to others. It had raised a red flag over the move to use 2014 as the base year for tariff reduction.
Prime Minister Narendra Modi said India's decision was guided by the impact it would have on the lives and livelihoods of all Indians, especially vulnerable sections of society. Despite its withdrawal, officials have said India could rejoin talks if it chooses to do so at a later date.
What it means for India
India would have the third biggest economy in the RCEP. Analysts believe that India might lose investments while its consumers may end up paying more than they should, especially when global trade, investment and supply chains face unprecedented challenges due to the Covid-19 pandemic.
Countries in the RCEP agreement would also lose out on an opportunity to access the Indian market that is notoriously hard to get into especially during the current global economic situation.
For India, it will be an opportunity to strengthen its domestic industries and move towards its dream of becoming self-reliant. A large number of sectors including dairy, agriculture, steel, plastics, copper, aluminium, machine tools, paper, automobiles, chemicals and others had expressed serious apprehensions on RCEP citing dominance of cheap foreign goods would dampen its businesses.
India-Asean relations and impact on RCEP
India's relationship with Asean is a key pillar of its foreign policy and the foundation of the Act East Policy. Its focus on a strengthened and multi-faceted relationship with Asean is an outcome of the significant changes in the world’s political and economic scenario since the early 1990s and India’s own march towards economic liberalisation.
In 2012, Asean and India had commemorated 20 years of dialogue partnership and 10 years of Summit level partnership with a Commemorative Summit held in New Delhi under the theme 'ASEAN-India Partnership for Peace and Shared Prosperity' on 20-21 December 2012.
India-Asean trade and investment relations have been growing steadily, with Asean being India's fourth largest trading partner. Its trade with Asean stands at $81.33 billion, which is approximately 10.6 per cent of India's overall trade. While, India's exports to Asean stand at 11.28 per cent of our total exports.
Investment flows are also substantial both ways, with Asean accounting for approximately 18.28 per cent of investment flows into India since 2000. FDI inflows into India from Asean between April 2000 to March 2018 was about $68.91 billion, while FDI outflows from India to Asean countries, from April 2007 to March 2015, as per data maintained by department of economic affairs (DEA), was about $38.672 billion.
Under the UPA government, India had opened 74 per cent of its market to Asean countries but richer countries like Indonesia opened only 50 per cent of their markets for India. It also agreed to explore an India-China FTA in 2007 and join RCEP negotiations with China in 2011-12. However, the impact of these decisions resulted in increased trade deficit with RCEP nations - from $7 billion in 2004 to $78 billion in 2014.
[edit] Release time
[edit] 2021-23
June 17, 2023: The Times of India

From: June 17, 2023: The Times of India
New Delhi: The average import release time has continued to improve, achieving 20% reduction for inland container depots (ICDs), 11% for air cargo complexes (ACCs) and 9% for seaports in 2023 compared to last year, according to the latest National Time Release Study (NTRS), which assesses the turnaround time for imports and exports. This is part of the government’s plan to improve overall logistics for trade facilitation and shore up the ease of doing business in the country.
The study covers four seaports, six air cargo complexes, three inland container depots and two integrated check posts. These cumulatively account for approximately 80% of the bills of entry and 70% of the shipping bills filed in the country. The study is aimed at assessing the progress made towards the National Trade Facilitation Action Plan (NTFAP) targets, identifying the impact of various trade facilitative initiatives, such as ‘Path to Promptness’ and the challenges to faster reduction in release time.
The distance travelled towards NTFAP, a ready performance indicator for inter-tem- poral comparison, has improved 14 percentage points in the case of ICDs, and 5 percentage points for ACCs as well as seaports, according to the study.
The study highlighted that higher levels of facilitation and more efficient interventions translate into lower release time. This continues to be validated by NTRS 2023, which reports that the average release time for facilitated bills of entry was 55% lower than average release time for non-facilitated bills of entry, in respect of all the port categories.
The export release time at seaports has improved by 8% from 191:41 hours in 2022 to 175:55 hours in 2023, albeit with only marginal improvement in time taken post grant of LEO (Let Export order). The focus on assessment of export facilitation, which is aimed at simplification, modernisation, and harmonisation of export processes, through measurement of export release time, is consistent with the high priority by the government on export promotion, according to the study. “CBIC is looking at reducing average release time to one hour by 2047,” Vivek Johri, chairman, CBIC ( Central Board of Indirect Taxes and Customs) , said at an event on Friday.
[edit] Special Economic Zones (SEZs)
[edit] 2015-19: exports from India, from SEZs
See graphic:
2015-19:
Total exports from India
Exports from SEZs
[edit] State-wise performance
[edit] 2017

From: March 2, 2018: The Times of India

From: March 2, 2018: The Times of India
See graphics:
The share of India’s Top 8 exporting states in India’s exports, 2017- I
The share of India’s 9th-15th (rank-wise) exporting states in India’s exports, 2017- II
[edit] Top trading partners
[edit] 2018, 19
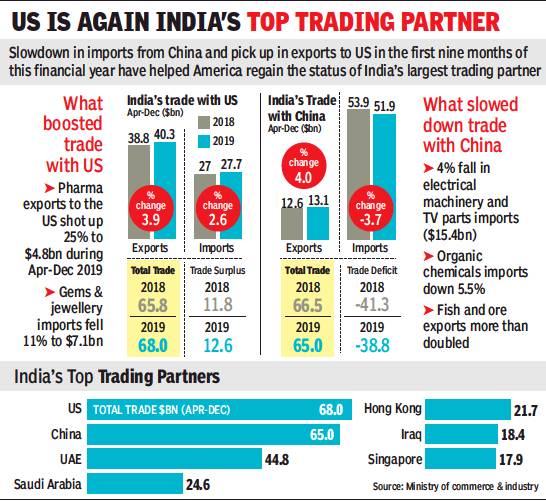
From: Surojit Gupta, February 24, 2020: The Times of India
See graphic:
India’s Top trading partners: 2018, 19
[edit] Trade agreements
[edit] As in 2019, Nov
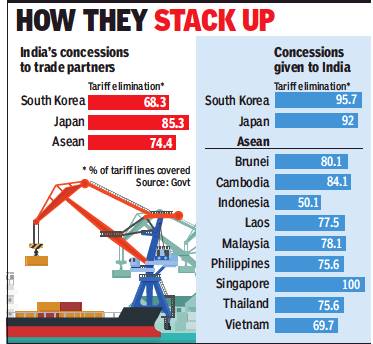
From: Nov 6, 2019: The Times of India
See graphic:
India vis-à-vis countries included in the RCEP, concessions made by either side.
[edit] Trade deficit
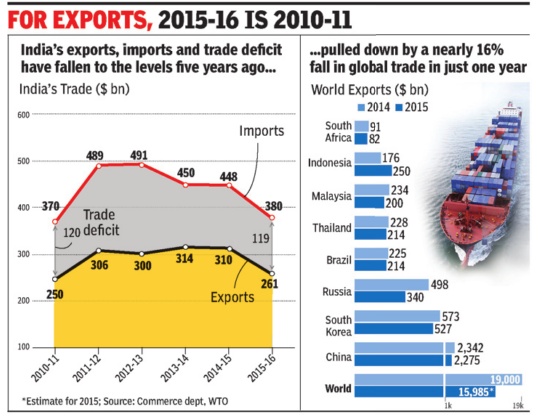
[edit] 2005-16
See graphic 'India's exports, imports and trade deficit levels in 2015-16...'
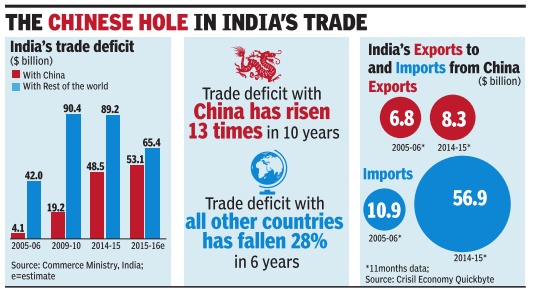
[edit] 2013-16
The Times of India, May 10 2016
India has trade deficit with 27 countries
India has a trade deficit with as many as 27 major countries, in cluding China, Australia, Iraq and Iran, during the last three years. With these countries, India has trade deficit continuously during the last three years, commerce and industry minister Nirmala Sitharaman said in a written reply to the Lok Sabha.
She said India generally runs a deficit with those countries from which highdemand commodities are sourced. These include items like crude oil, gold, diamond and fertiliser.
In 2015-16, India's trade deficit fell 14% to $118.4 billion. Other countries with which India has a trade gap include Indonesia, Korea, Germany , Canada, Taiwan, Russia and Ukraine.
In a separate reply , she said India's exports have been adversely affected by recessionary trends across the globe, including in the EU and the US. India's agriculture exports during April-February 2016 worked out at $18.8 billion as against $18.7 billion in 2014-15, the minister said.
[edit] 2014-17
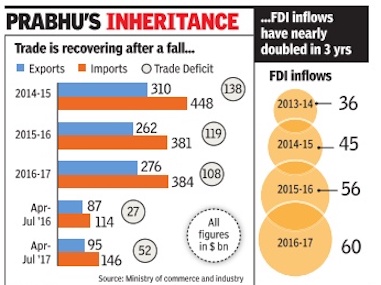
ii) FDI inflows, 2013-17
From The Times of India, September 4, 2017
See graphic, ' India’s external trade, 2014-17'
[edit] 2015-19: Apr-Oct months

Oil imports and the trade balance.
From: Dec 16, 2019 Times of India
See graphic:
2015-19: India’s exports and imports in the Apr-Oct months
Oil imports and the trade balance.
[edit] Nov 2016-April 2017
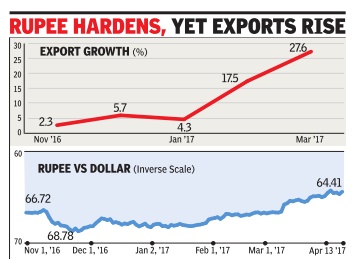
See graphic:
Nov 2016-April 2017: Indian exports rise despite the rupee appreciating in value
[edit] 2017-18: Exports expand 9.8%, fastest in six years
Exports expand 9.8% in FY18, fastest in six years, April 14, 2018: The Times of India
From: Exports expand 9.8% in FY18, fastest in six years, April 14, 2018: The Times of India
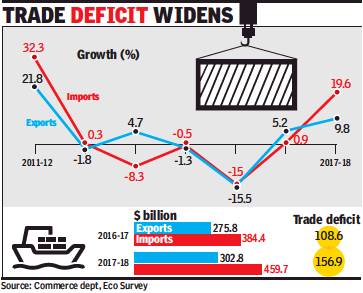
India’s exports rose 9.8% during 2017-18, the highest growth rate in six years, while imports went up nearly 20% as commodity prices pushed up the value of shipments in and out of the country along with a pick-up in global trade.
But, exports dipped 0.7% in March to $29.1 billion, led by a decline in shipments of gems and jewellery and petroleum products from the country, latest data released by the commerce department on Friday showed. This was the first decline in four months as oil exports dropped 13%, while gems and jewellery exports fell nearly 17%. During March, import growth too slowed down, rising 7% to $42.8 billion, leaving a trade deficit of $13.7 billion.
In 2017-18, trade deficit was estimated to have widened to $157 billion, compared to $109 billion in 2016-17. “With the expansion in imports nearly twice as high as export growth in FY2018, the merchandise trade deficit widened by 44% in the just-concluded fiscal. ICRA expects the current account deficit to more than triple to $47-50 billion (around 1.9% of GDP) in FY2018 from $15 billion in FY2017,” said Aditi Nayar, principal economist at the ratings agency. While exporters’ lobby group Fieo said that the overall number was positive, it warned about the adverse impact of protectionism and geo-political uncertainty.
[edit] 2018: August
From: September 17, 2018: The Times of India
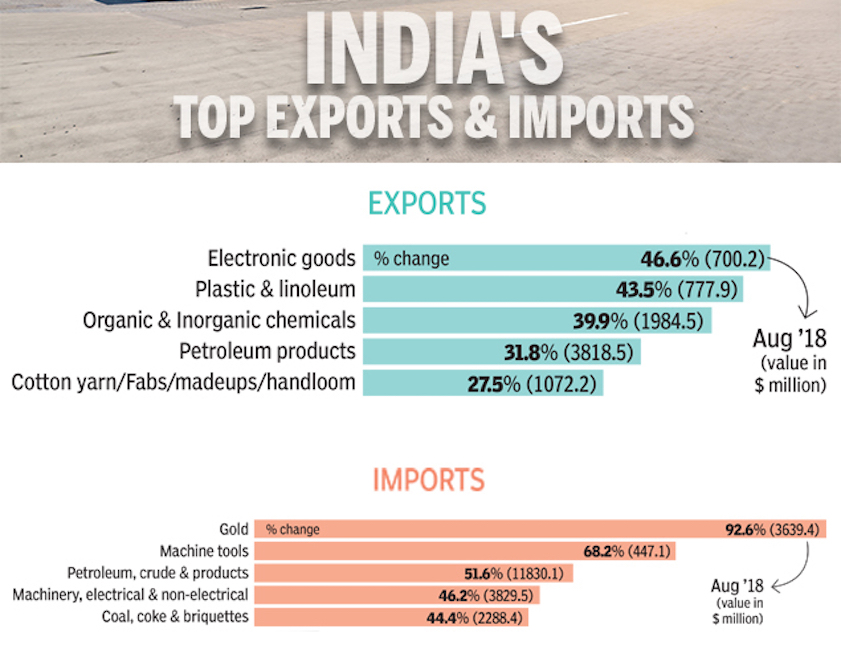
See graphic:
India's top exports and imports- August 2018
[edit] Sep: exports dip 2% despite ₹ depreciation/ Imports up
Exports dip 2% despite sharp Re depreciation, October 16, 2018: The Times of India
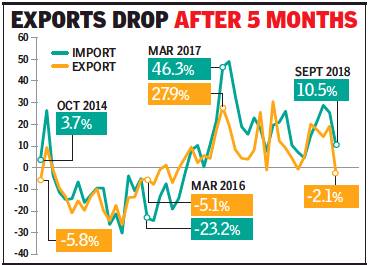
2018, Sep: exports dipped 2% despite ₹ depreciation; imports rose
From: Exports dip 2% despite sharp Re depreciation, October 16, 2018: The Times of India
India’s exports declined over 2% in September, despite a steep depreciation of the rupee, but the government dismissed it as a blip and blamed high base for the first fall in value of shipments in five months.
A late evening statement showed a decline across sectors — from gems and jewellery (down 22%) to readymade garments (-33.6%). On the other hand, gainers included oil products (26.8%) due to higher global prices, along with plastics and linoleum (28%) and chemicals (17%).
Typically, exports become more attractive due to a weakening currency. The rupee has depreciated over 15% since January, making it the worst performing Asian currency so far this year. But, exporters said they have gained little so far since the orders were booked before rupee’s free fall began. Besides, buyers are now demanding lower prices citing a weaker rupee.
In September 2018, exports were estimated at close to $28 billion, compared to $28.6 billion a year ago. Imports, however, rose 10.4% to $41.9 billion, resulting in a trade deficit of nearly $14 billion. Oil imports surged 33.6% to $10.9 billion, while gold shipments were 51% higher at $2.6 billion, mounting pressure on trade deficit.
[edit] 2022- 23
Sidhartha, April 14, 2023: The Times of India

From: Sidhartha, April 14, 2023: The Times of India
Rome : Buoyed by the services sector, India’s exports rose 14% to a record $770 billion during the last financial year, while imports jumped to a new high of $892 billion, amid aslowdown demand in goods due to global headwinds.
Latest data showed that goods exports went up just under 6% to $447 billion, which is a new high but lower than what was expected at the start of the last financial year. Goods imports rose 16. 5% to $714 billion, resulting in a record trade deficit. In March, however, exports fell 13. 9% to $38. 4 billion, the second straight month of decline, while imports were almost 8% lower at $58. 1 billion, marking the fourth continuous month of fall. Trade deficit was estimated at $19. 7 billion, the first increase in four months.
China’s share in India’s imports basket declines
Commerce and industry minister Piyush Goyal said that imports fell due to a fall in oil prices, and added that the tough global conditions were putting pressure on goods exports. He, however, drew comfort from the numbers saying that they were in line with the 2022-23 projection of $772 billion with the full services numbers awaited.
“GST collections are at a high, exports are at a record high, inflation has come within RBI’s comfort band, foreign exchange reserves are strong, and India is the fastest growing large economy. It reflects the mood of the nation,” he said, adding record remittances of $100 billion and investment flows will keep current account deficit under check.
Overall, 17 of the 30 major sectors grew during the last financial year and exporters remain upbeat on a good performance during the current financial year as well. Electronics goods, including mobile phones were a highlight, rising over 50% to $23.6 billion.
Among services, there is a healthy growth in areasincluding IT, accounting and business processing, Goyal added. On the imports front, the commerce ministry said that China's share in India's imports basket has declined to 13.% in 2022-23, from 15.4% ayear ago.
[edit] Trade-GDP ratio
[edit] Vulnerable India's trade-GDP ratio higher than US, China's
The Times of India, Aug 30 2015
Atul Thakur
India's trade-GDP ratio higher than US, China's Country
More vulnerable to global crises
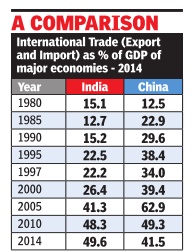
Historically, India has been viewed as being far less vulnerable to global financial crises than other large economies because it was much less integrated with the global economy than countries like, say , the US or China. Today , however, at least as far as trade goes, the opposite is true. World Bank data shows that in 2014 India's total trade (exports plus imports) was equivalent to about 50% of its GDP. This was higher than the trade to GDP ratio of the US, Japan or China. Dur ing the 1997 Asian financial crisis, which India escaped relatively unscathed, total foreign trade was equivalent to only 22.2% of the country's GDP.
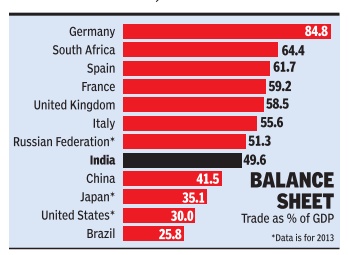
One way to measure the extent to which an economy is globally linked is by comparing its international trade with its GDP. By this yardstick, India's aggregate exports and imports of goods and services was 49.6% of the country's GDP in 2014, compared to China's trade to GDP ratio of 41.5% for the same year. In 2013, the year till when Bank data is available for the US and Japan, international trade was about 30% of GDP for America and 35.5% for the Japanese economy . Of course, the US, China and Japan are far larger economies than India at the nominal exchange rate and hence a lower trade ratio doesn't mean their trade volumes are lower than India's.
The data shows that among major economies, countries of Western Europe have the highest degree of integration with the global economy . For instance, the ratio was 84.8% for Germany , Europe's largest economy . For the UK, Italy , Spain and France, trade was about 60% of GDP .
Three decades ago, in 1984, China and India had a similar degree of globalization with the trade to GDP ratio 16.6% for China and 13.8% for India. The Chinese economy experienced exponential growth thereafter and it was reflected in the growth of its international trade as well.The trade to GDP ratio steadily increased to a peak of 64.8% in 2006. Since then it has been decreasing as China's domestic market has expanded with increased per capita incomes.
India, on the other hand, continues to be in a phase where its global trade expands at a faster pace than its economy , resulting in a steadily climbing trade to GDP ratio.
[edit] India and the world
[edit] 2019
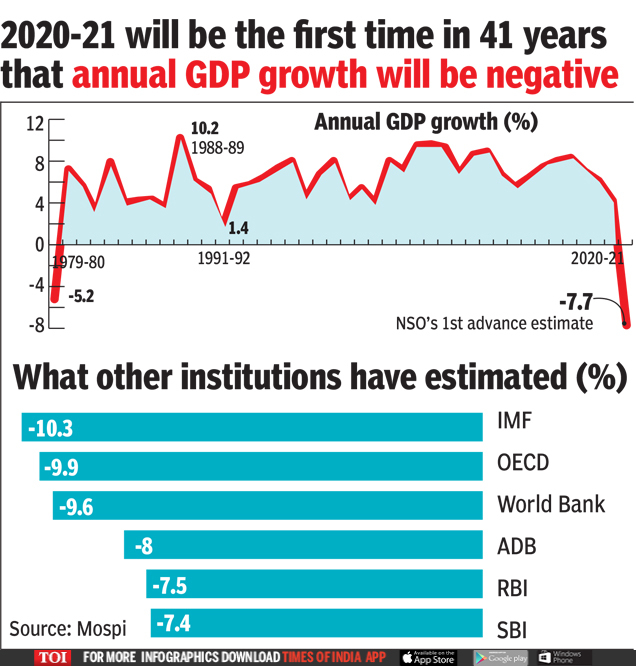
What other institutions have estimated (%)
From: GDP may contract by 7.7% in FY21: NSO data, January 8, 2021: The Times of India
See graphic:
Annual GDP growth, 1979-80- 2020-21;
What other institutions have estimated (%)
[edit] 2011- 2021
February 2, 2023: The Times of India

From: February 2, 2023: The Times of India
See graphic:
2011- 2021: The trade to GDP ratio India vis-à-vis Australia, Brazil, Canada, China, France, Germany, Indonesia, South Africa. and the USA
India’s trade-to-GDP ratio was more than 45% in FY22, higher than both the US and China. In the preliberalisation era, India was less integrated with the world economy, which made it less sensitive to global financial crises. However, that has changed in recent years though the degree of globalisation is lower than large European economies like Germany and France — mainly because of the EU’s unified trade regime. Despite being the largest trade partners for most economies, China and the US also have huge domestic markets that reduce exposure to global tremors.
[edit] Trade, merchandise
[edit]
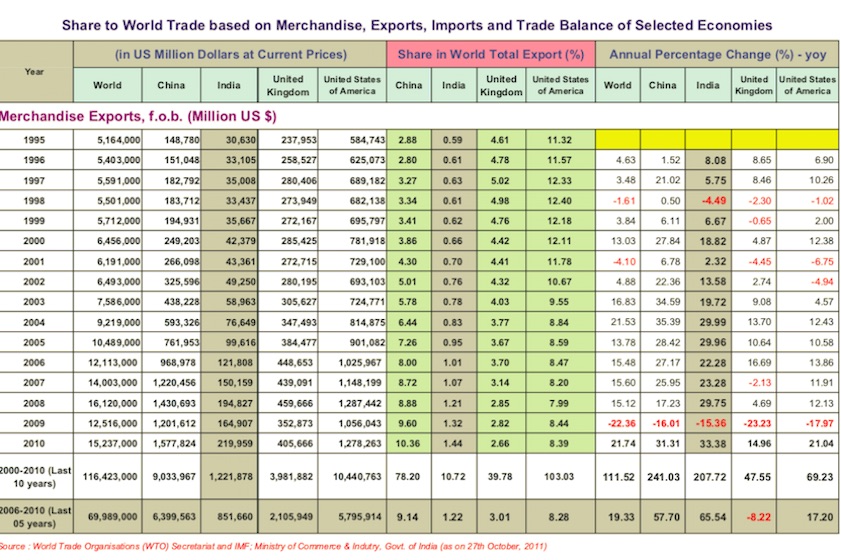
From: December 22, 2014: The Planning Commission
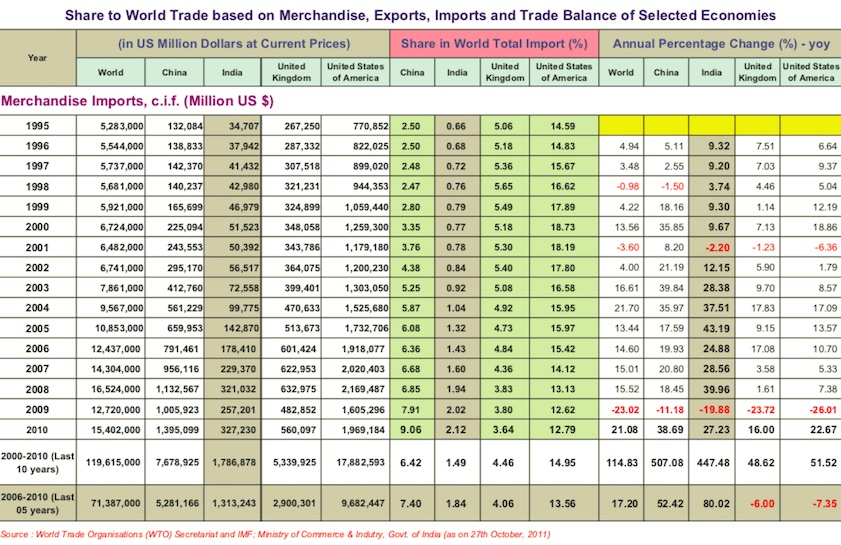
From: December 22, 2014: The Planning Commission
See graphics:
1. Share to World Trade based on Merchandise, Exports, Imports & Trade Balance of Selected Economies - (1995-2010)- MERCHANDISE EXPORTS
2. Share to World Trade based on Merchandise, Exports, Imports & Trade Balance of Selected Economies - (1995-2010)- MERCHANDISE IMPORTS
[edit] Summary of monthly merchandise trade developments
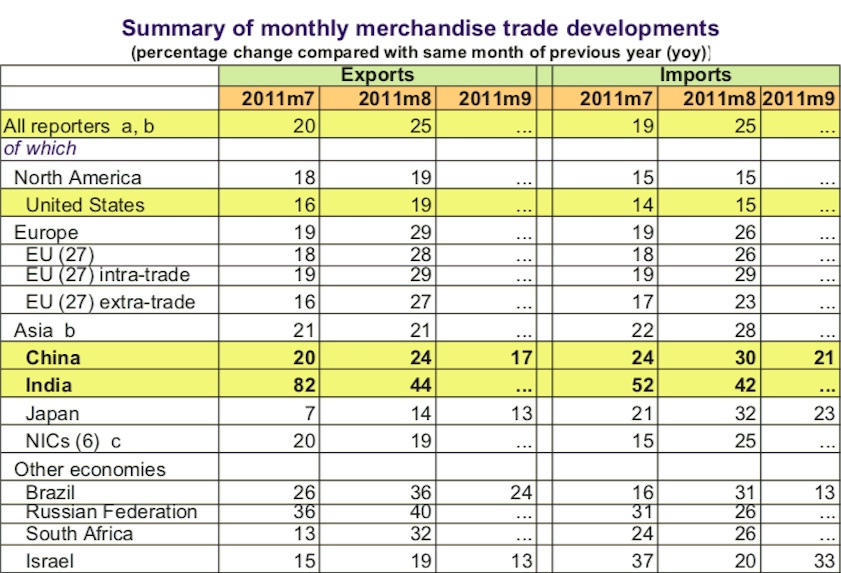
From: December 22, 2014: The Planning Commission
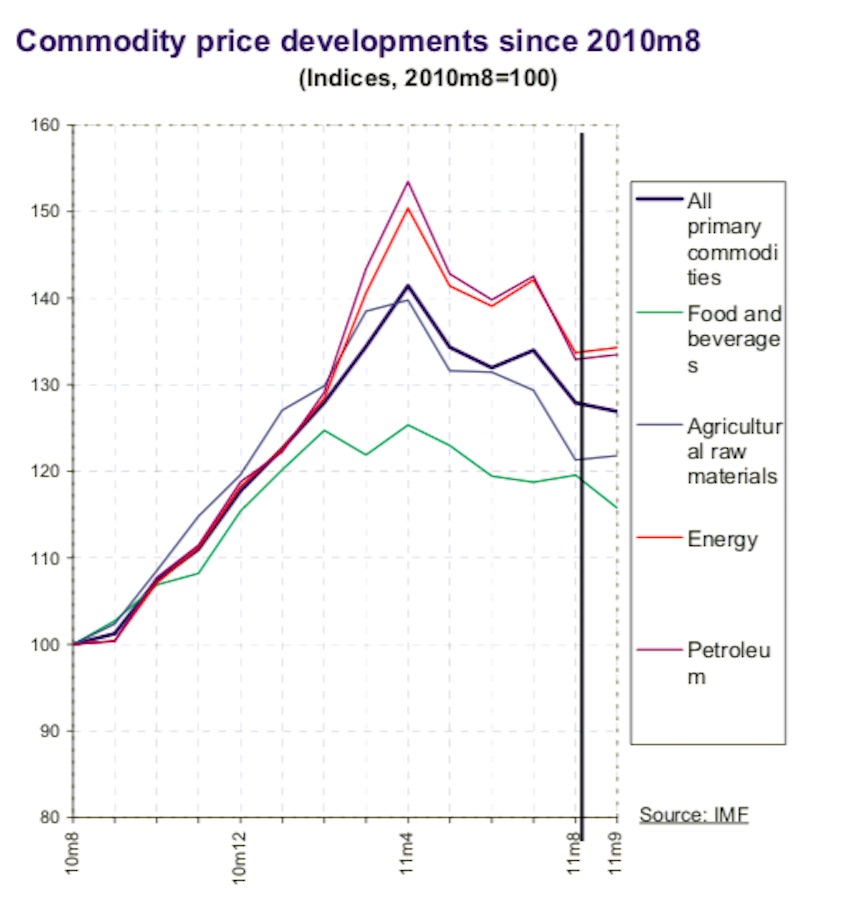
From: December 22, 2014: The Planning Commission
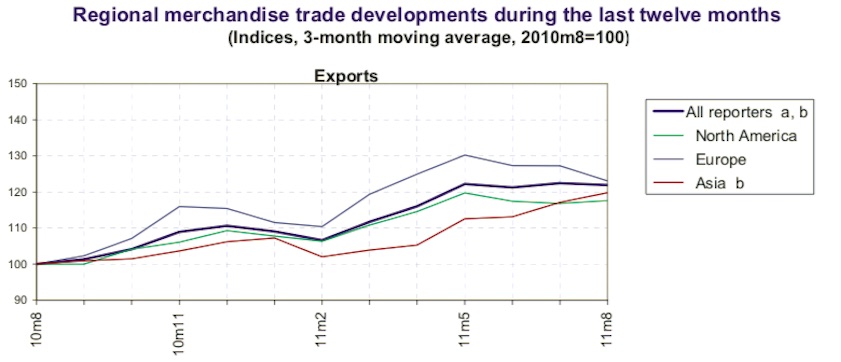
From: December 22, 2014: The Planning Commission
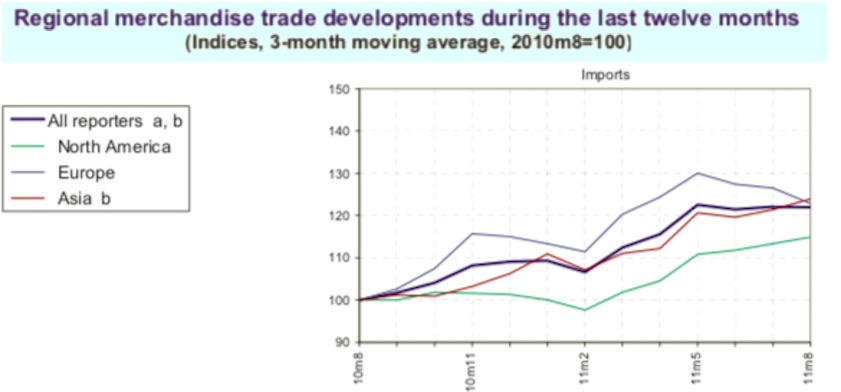
From: December 22, 2014: The Planning Commission
See graphics:
1. Summary of monthly merchandise trade developments- (percentage change compared with same month of previous year (yoy))
2. Commodity price developments since 2010m8
3. Regional merchandise trade developments during the last twelve months- (Indices, 3-month moving average, 2010m8=100)- EXPORTS
4. Regional merchandise trade developments during the last twelve months- (Indices, 3-month moving average, 2010m8=100)- IMPORTS
[edit] Trading partners, India’s main
[edit] 2017-18
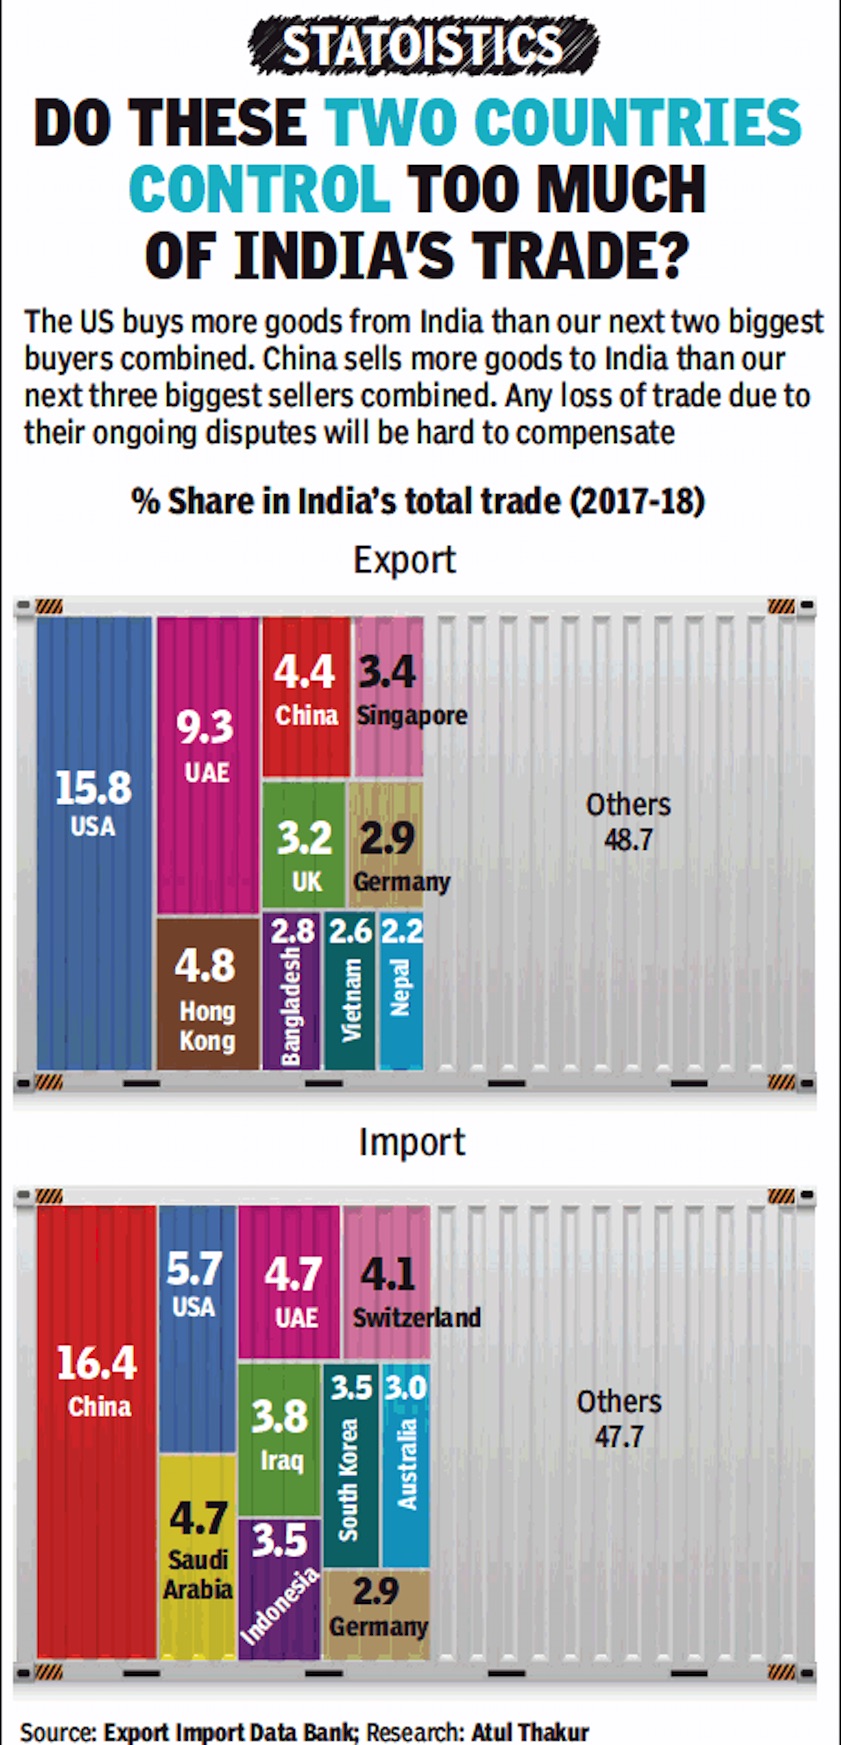
ii) The main countries from which India imported their goods,
in 2017-18.
From: July 5, 2018: The Times of India
See graphic:
i) The main countries to which India exported its goods, and
ii) The main countries from which India imported their goods
[edit] 2019-20: vis-à-vis the USA, China
July 12, 2020: The Times of India
NEW DELHI: The US remained India's top trading partner for the second consecutive fiscal in 2019-20, which shows increasing economic ties between the
two countries.
According to the data of the commerce ministry, in 2019-20, the bilateral trade between the US and India stood at $ 88.75 billion as against $87.96 billion in 2018-19.
The US is one of the few countries with which India has a trade surplus. The trade gap between the countries has increased to $17.42 billion in 2019-20 from $ 16.86 billion in 2018-19, the data showed.
In 2018-19, the US first surpassed China to become India's top trading partner.
The bilateral trade between India and China has dipped to $81.87 billion in 2019-20 from $87.08 billion in 2018-19. Trade deficit between the two neighbours have declined to $48.66 billion in 2019-20 from $53.57 billion in the previous fiscal.
The data also showed that China was India's top trading partner since 2013-14 till 2017-18. Before China, UAE was the country's largest trading nation. Presence of Indian diaspora in the US is one of the main reasons for increasing bilateral trade, Biswajit Dhar, professor of economics at Jawaharlal Nehru University, said.
"Presence of Indian diaspora is creating demand for Indian goods such as consumer items and we are supplying that," Dhar said.
[edit] 2020: vis-à-vis the USA, China
Bloomberg, February 23, 2021: The Times of India

From: February 23, 2021: Bloomberg
China returns as top India trade partner even as relations sour
NEW DELHI: China regained its position as India’s top trade partner in 2020, as New Delhi’s reliance on imported machines outweighed its efforts to curb commerce with Beijing after a bloody border conflict.
Two-way trade between the longstanding economic and strategic rivals stood at $77.7 billion last year, according to provisional data from the ministry of commerce.
Although that was lower than the previous year’s $85.5 billion total, it was enough to make China the largest commercial partner displacing the US -- bilateral trade with whom came in at $75.9 billion amid muted demand for goods in the middle of a pandemic.
While Prime Minister Narendra Modi banned hundreds of Chinese apps, slowed approvals for investments from the neighbor and called for self-reliance after a deadly clash along their disputed Himalayan border, India continues to rely heavily on Chinese-made heavy machinery, telecom equipment and home appliances.
As a result, the bilateral trade gap with China was at almost $40 billion in 2020, making it India’s largest.
Total imports from China at $58.7 billion were more than India’s combined purchases from the US and the UAE, which are its second- and third-largest trade partners, respectively.
That said, India did manage to lower imports from its Asian neighbor amid demand disruptions caused by the coronavirus pandemic.
The South Asian nation also managed to increase its exports to China by about 11% from a year ago to $19 billion last year, which makes any further worsening of ties with Beijing a threat to New Delhi’s export revenue.
The tense relations are already weighing on India’s ambitions to bolster its manufacturing capabilities. New Delhi has been slow to issue visas to Chinese engineers needed to help Taiwanese companies set up factories under a so-called production-linked incentive program, or PLI, to promote local manufacturing.
“Still a very long way to go” is how Amitendu Palit, an economist specializing in international trade and investment at the National University of Singapore, described New Delhi’s efforts to wean itself away from Beijing.
“The PLI schemes will take at least four-five years to create fresh capacities in specific sectors. Till then reliance on China would continue.”
[edit] See also
Agricultural produce marketing, sales, exports: India
Commerce: Indian government data
Exports, imports (international trade): India
