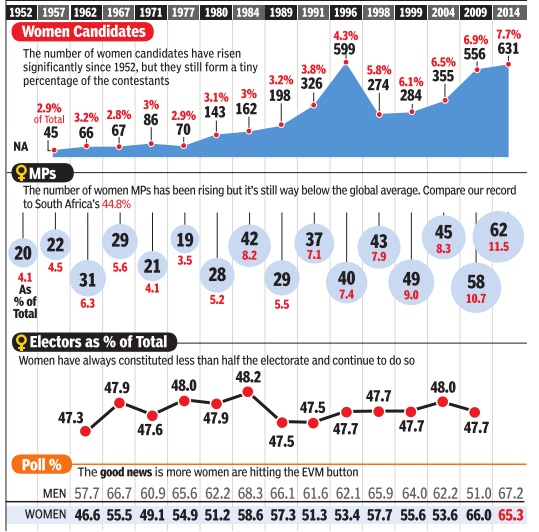
Elections in India: behaviour and trends (historical)
(→1951: ballot boxes by Godrej & Boyce) |
(→General Elections to the Lok Sabha, 1951- onw) |
||
| Line 25: | Line 25: | ||
the third from 19 to 25 February 1962; | the third from 19 to 25 February 1962; | ||
| − | + | the fourth from 17 to 21 February 1967; | |
the fifth from 1 to 10 March 1971; | the fifth from 1 to 10 March 1971; | ||
| Line 49: | Line 49: | ||
the fifteenth from 16 April to 13 May 2009; | the fifteenth from 16 April to 13 May 2009; | ||
| − | the sixteenth General Elections from 7 April 2014 to 12 May 2014 | + | the sixteenth General Elections from 7 April 2014 to 12 May 2014, |
| + | |||
| + | the seventeenth General Elections from April 2019 to May 2019, | ||
==1951: ballot boxes by Godrej & Boyce == | ==1951: ballot boxes by Godrej & Boyce == | ||
Revision as of 20:54, 7 April 2019
This is a collection of articles archived for the excellence of their content. Readers will be able to edit existing articles and post new articles directly |
History
General Elections to the Lok Sabha, 1951- onw
The first General Elections were held from 25 October 1951 to 21 February 1952;
the second from 24 February to 14 March 1957;
the third from 19 to 25 February 1962;
the fourth from 17 to 21 February 1967;
the fifth from 1 to 10 March 1971;
the sixth from 16 to 20 March 1977;
the seventh from 3 to 6 January 1980;
the eighth from 24 to 28 December 1984;
the ninth from 22 to 26 November 1989;
the tenth from 20 May to 15 June 1991;
the eleventh from 27 April to 30 May 1996;
the twelfth from 16 to 23 February 1998;
the thirteenth from 5 September to 6 October 1999;
the fourteenth from 20 April to 10 May 2004;
the fifteenth from 16 April to 13 May 2009;
the sixteenth General Elections from 7 April 2014 to 12 May 2014,
the seventeenth General Elections from April 2019 to May 2019,
1951: ballot boxes by Godrej & Boyce
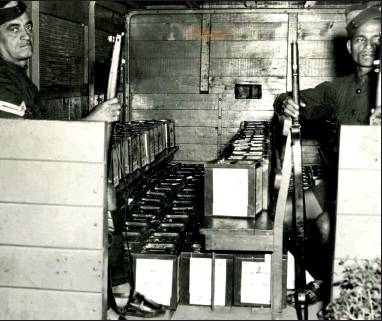
From: Bhavika Jain1, This Bombay factory made ballot boxes for India’s first poll, March 17, 2019: The Times of India
Independent India was gearing up to hold its first elections in 1952 and inside a factory in the marshy suburbs of Mumbai’s Vikhroli, the workers were making history, literally.
It was the latter half of 1951 and from the outside, it was business as usual at Plant 1 of the Godrej & Boyce Mfg. Co. Ltd. But unbeknownst to many, the workers were part of a nationbuilding project, assigned the task of speedily manufacturing the first ever ballot boxes to be used in general elections in India.
Archives of the company indicate that a total of 12.83 lakh ballot boxes were produced in the Vikhroli factory in barely four months. “A newspaper, Bombay Chronicle, had printed an article on December 15, 1951, saying the factory was manufacturing 15,000 ballot boxes a day.
This, without affecting the production of any of their other products like safes, cupboards, cabinets and locks, proves that the workers at the factory were putting in extra hours every day to ensure that the ballot boxes were readied in time,” said Vrunda Pathare, chief archivist at Godrej.
An official from the archives division said an ad in The Times of India published by Godrej shows that the original order was for 12.24 lakh ballot boxes but they ended up making 12.83 lakh. “It’s probably because orders were given to other companies as well and those who did not finish them in time passed the order on to Godrej in the end,” said the official.
The production cost of one ‘olive green’ box came to Rs 5 and the model was finalised after testing 50 designs. The internal locking system in the ballot box was designed by a factory hand, Nathalal Panchal, after it was found that an external lock would inflate the making cost.
“We have anecdotal evidence that Panchal played a key role in suggesting the design for the internal locking mechanism,” said Pathare. That story is now part of an oral history project of 2006 when company officials interviewed KR Thanewala, the plant manager of Plant 1 in 1951, who is now no more. Thanewala had recalled during the interview that Plant 1 had just started in May 1951.
“Pirojsha Godrej (the owner) would come to the factory at 3 o’clock every afternoon asking us how it was going. And he got orders from other companies who had not somehow or the other managed to make them (ballot boxes). The mechanism was tested. Every box had to be checked. Click when it closes and click it should open. Once it was closed, without putting your finger inside and pulling the string, you cannot unlock it,” he said.
By February 1952, all the ballot boxes were manufactured, loaded onto railway wagons and sent to the 22 states in preparation for the holding of the polls. Thanewala, in his interview, describes how the boxes were moved: “...We had to walk to the station and back. And...I did a lot of night shifts. At night we (used to) light mashaals (torches) and with the mashaal, I used to walk from the railway tracks up to Vikhroli station. It was great fun.”
1951: many did not know how to vote

From: March 15, 2019: The Times of India
See graphic:
In 1951 many did not know how to vote
The major political parties
1952-2014: The two biggest parties
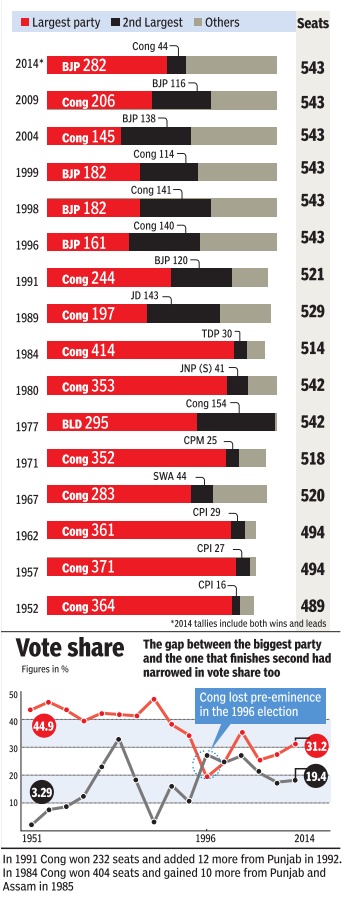
MIND THE GAP
The Times of India May 17 2014
It was a Congres show in the initial elections. By the late 1980s, the picture began to change. With a fragmented polity, coalition governments became the norm. After 25 years, BJP has changed the script winning a decisive majority
The biggest electoral clashes
1952-2009
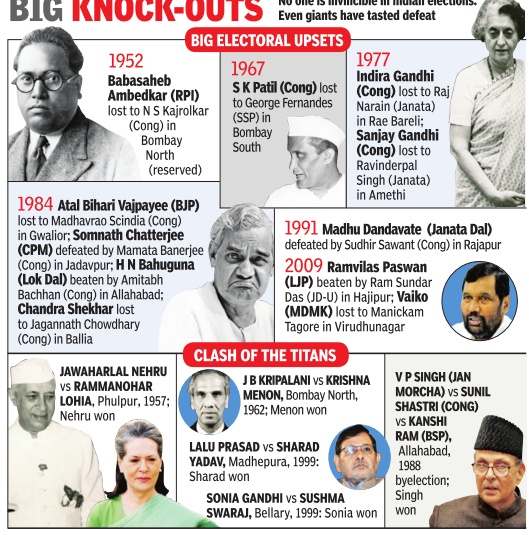
Courtesy: The Times of India
See graphic:
Goliaths felled, 1952-2009
Bribing voters
2014, 2017

From: March 20, 2019: The Times of India
See graphic:
Seizures of alcohol, cash and drugs during elections in 2014, 2017
Candidates
1998-2014: no. per constituency; non-serious candidates
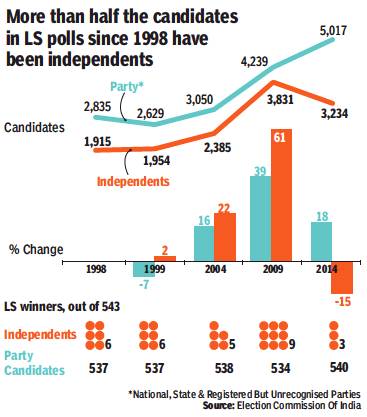
From: Chethan Kumar, Why the outcome doesn’t matter for these poll candidates, March 21, 2019: The Times of India
Talk about participating being more important than winning and there is the case of independent contestants and those from smaller outfits in Indian elections, who make little impact cumulatively as an electoral group but continue to jump into the fray in numbers.
A total of 31,154 candidates (party-affiliated and others) contested in the past five Lok Sabha elections. About eight in 10 of these, or 25,478 candidates, forfeited their deposits with independents and members of smaller parties making up the bulk of their numbers.
Elections are getting more expensive to fight and the electorate rarely chooses a contestant from unrecognised parties or an independent as their member of Parliament. Despite this ground reality, the average number of candidates per constituency has jumped by 70% in 2014 compared to 1998.
In 1998, the average number of candidates per constituency was 8.7, rising to 15.2 in 2014. The maximum number of candidates in one constituency was 34 and 42 in these years, respectively. The average has increased every election since 1998 (see graphic).
“For many, it is a way to gain popularity locally. They know they won’t win, but they want to make themselves known and gain influence in whatever way possible. In some cases, such candidates are later seen associated with major parties,” said political scientist Suhas Palshikar.
Since India follows a firstpast-the-post system, where a candidate with the maximum votes among all contestants wins — even if she or he doesn’t recieve a majority of the votes — many contestants are in it on a gamble.
While some are proxies of major parties looking to divide votes or plain political rebels, some are contesting to make a point.
Take the example of Sumalatha in Karnataka. The wife of late actor-politician MH Ambareesh, she announced on Monday that she would contest as an independent from Mandya, where state CM HD Kumaraswamy’s son Nikhil is making his LS poll debut. Ambareesh was a Congress member and Sumalatha had been looking to get a ticket from her late husband’s party. But Congress ceded the seat to JD(S) as part of its seatsharing pact with the regional party, prompting Sumalatha to declare she would nonetheless join the fray in Mandya.
But many of the new parties cropping up before elections — the number of parties registered with the Election Commission has increased from 1,709 in 2014 to 2,354 as of March 10, 2019 — are seen as proxies by experts. Analysts say the number of “serious candidates” in every constituency is only three or four.
Among 10 major states — Andhra Pradesh, Tamil Nadu, Karnataka, West Bengal, Bihar, Uttar Pradesh, Madhya Pradesh, Rajasthan, Gujarat and Delhi — Tamil Nadu and Delhi, at 21, had the highest average of candidates per constituency in 2014.
“There are multiple reasons for a large number of people contesting elections, but key among those is the return on investment that politics offers in developing countries like India,” said political analyst Harish Ramaswamy. “Whether it is in the decentralised institutions or at the national level, people’s economic condition strengthens very quickly and their lifestyle changes.”
Elections are getting more expensive to fight and the voters rarely elect an MP from unrecognised parties or an independent. Despite this ground reality, the average number of candidates per constituency has jumped by 70% between 1998 and 2014
1996: Nalgonda

From: April 1, 2019: The Times of India
See graphic:
1996: Nalgonda holds the record for the highest number of candidates per constituency
Non-serious candidates
1988-2018: Padmarajan lost 170 elections
March 29, 2019: The Times of India
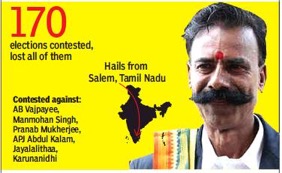
From: March 29, 2019: The Times of India
Some never tire of trying. Like, Dr K Padmarajan. Starting 1988, the man from Salem, Tamil Nadu, has contested 170 elections. And the 60-year-old has lost all of them. The Limca Book of Records names him as 'India's Most Unsuccessful Candidate'
Dr Padmarajan, a homoeopathic doctor-turned-businessman, has labelled himself as ‘All India Election King’. He has contested not just local and parliamentary but also Presidential elections. Forfeiting his deposit is obviously not a matter of serious concern for him (From The Times of India)
Kashyap: every election makes him poorer
With no cash and zero balance in his bank account and his wife’s, a 51-year-old advocate from Muzaffarnagar constituency is perhaps the poorest candidate in the fray in this Lok Sabha election.
At first glance, there is little to differentiate Mange Ram Kashyap from several other advocates clad in black robes that crowd the Muzaffarnagar court on a daily basis. But ask anybody in the premises and they would tell you that Mange Ram is also a neta who has fought all of the general elections since 2000. Mange Ram contests elections from a party named Mazdoor Kisan Union Party which he founded in 2000. The party has 1,000-odd members, most of them labourers, according to Mange Ram.
In his election affidavit submitted recently, Mange Ram has declared that he has no jewellery, no cash and zero money in his bank account. His wife, Babita Chauhan, also has no cash, no jewellery and no money in her bank account. He does own a 100sq yard plot now valued at Rs 5 lakh and a house built on 60sq yard with an estimated current value of Rs 15 lakh. The house is a gift from Mange Ram’s in-laws. He also owns a bike worth Rs 36,000.
While his political dreams may be taking a long time to materialize, it has done little to deter Mange Ram from campaigning on foot in the city. “I have a bike but I cannot afford petrol for it every day. My wife is a homemaker and we have two kids to take care of. I have tried to find other jobs but there are hardly any,” he told TOI.
“In the last elections too I went on foot to appeal to people to vote for me. I wonder why big politicians spend so much on campaigns when that money could be used for welfare of people,” he said.
But has his door-to-door campaign worked its charm on the voters in the past? The candidate has had to forfeit his deposit every single time as he was unable to secure the minimum number of votes.
Mange Ram is, however, convinced that things will change for the better this year for him. He is also unfazed that he is pitted against heavyweights like BJP’s Sanjeev Balyan, Ajit Singh fielded by SP-BSP-RLD’s alliance and Congress’ Narendra Kumar.
“Voters know that politicians have not looked out for them. I will help the poor. I will propose a voter pension scheme so no man is in want of money,” he said.
Cash and election funds
Parties got 60% of '09 Maha, Haryana poll funds in cash Sep 23 2014
New Delhi:
TIMES NEWS NETWORK
Political funding continues to be largely through cash transactions, indicating a high presence of black money in the process.A study by Association for Democratic Reforms (ADR) said while over 60% of funds collected for the 2009 Assembly polls in Maharashtra and Haryana were in cash, spending by the political parties was to a large extent in cheque or demand draft.
In Maharashtra the total fund collected by political parties was Rs 81.07 crore, of which 61.7% or Rs 50.02 crore was collected in cash and 34.85% or Rs 28.25 crore was collected by cheque or DD.While Congress declared the maximum amount of Rs 36.12 crore, CPM declared the least amount of Rs 0.13 crore and BSP declared that it did not collect any fund. Out of the total expenditure of Rs 69.79 crore declared by national and regional parties, Rs 59.33 crore (85%) was paid in cheque, while Rs 8.9 crore (13%) was spent in cash.
For publicity, parties spent parties spent the lion's share or Rs 40.19 crore (65%) on advertisement, Rs 15.53 crore (or 25%) on electronic media and Rs 4.58 crore (or 7%) on cutouts, hoardings. Travel expenses too took up some amount (Rs 7.72 crore) of which they spent Rs 6.85 crore on aircrafts and helicopters.
In comparison the amount collected by parties in Haryana was Rs 15.74 crore of which Rs 11.77 crores (or 74.78%) was collected in cash and Rs 2.31 crores (or 14.67%) was by cheque or DD.
The total spending amounted to Rs 15.87 crore, which included Rs 6.56 crore (41.34%) in cash, while Rs 9.09 crore (57.25%) was through cheque or DD. Of this, 77% of the expenditure was on publicity, 20% on candidates, 2% on travel expenses and 1% on miscellaneous expenses.Congress, INLD and HJC (BL) declared the maximum spend on publicity
2014: world’s most expensive election

From: March 16, 2019: The Times of India
See graphic:
Election spend in 2014 Indian elections vis-à-vis 2016 US elections.
Submission of donor list by electoral trusts
Feb 06 2015
Only one out of 7 electoral trusts submits donor list
Himanshi Dhawan
In yet another indication of opacity in political funding, only one of the seven electoral trusts formed after January 2013 has submitted details of its donors to the Election Commission, despite government guidelines requiring them to do so. Electoral trusts are set up for the sole purpose of funding registered political parties and according to the June 2014 guidelines they are expected to submit an annual report to the EC.
Only the Bharti Airtel group-backed Satya Electoral Trust has submitted its annual report for the year 20132014. Among those who have not submitted any information include Pratinidhi Electoral Trust, People's Electoral Trust, Progressive Electoral Trust, Janhit Electoral Trust, Bajaj Electoral Trust and Janpragati Electoral Trust. According to data analysed by the Association for Democratic Reforms (ADR), the Satya Trust received Rs 85.40 crore and distributed Rs 85.37 crore to various parties.The largest corporate contributors to the trust are Bharti Enterprises which gave Rs 36 crore, DLF (Rs 20 crore), Hero Motocorp (Rs 11 crore), Jubliant Bharti Group (Rs 6 crore), Interglobe Aviation Limited and K K Birla Group which donated Rs 4 crore and Rs 2 crore, respectively.
These donations were channeled to BJP, Congress and NCP, with the saffron party being the largest recipient.BJP received Rs 41.37 crore (48.44%) of the total donations made to the trust followed by Congress with Rs 36.50 crore and NCP with Rs 4 crore. Regional parties like SAD, RJD and J&K's National Conference also received donations from the Satya trust.
About 15 corporates have established electoral trusts.
While some information is available about these, there are nine trusts about which no information is available with the authorities.
Directives issued by EC in Bihar assembly polls: June 2015
The Times of India, Jul 13 2015
Pradeep Thakur
Candidates can't take over Rs 20k in cash: EC
New directives issued ahead of Bihar polls
Ahead of assembly elections in Bihar, the Election Commission has issued fresh directives which include prohibiting candidates from accepting any donation or loan in excess of Rs 20,000 in cash. Also, all permissions taken for hiring and deployment of vehicles during campaigning will be added to a candidate's poll expenditure and will not be treated as the party's poll spend.
Starting with the Bihar polls, a candidate will have to maintain a separate account for all donations and loans he she receives during campaigning for amounts in excess of Rs 20,000. All such donations have to be received only through a crossed account payee cheque or bank draft, like in the case of political parties.
The guidelines have been issued in view of large cash seizures during recent assembly elections in several states. During the 2014 parliamentary elections, the EC and income tax teams had seized more than Rs 275 crore in cash from associates of candidates.
When the huge cash seizures were tracked to some candidates, many claimed the money belonged to the party and was meant for campaigning.
The fresh guidelines, issued on June 9, directs all chief electoral officers in states to inform candidates and political parties that candidates shall open a separate bank account for election campaign purposes. Parties have also been directed to make all payments to candidates by account transfer and not in cash. In a number of complaints reaching the EC, it was found that several candidates hired a large number of vehicles for campaigning but didn't declare this as part of their expenditure returns.
Candidates often under-report their poll expenditure due to a ceiling imposed on them.While the EC has imposed a cap on expenditure by candidates, there is no such limit in case of parties. This often results in candidates showing expenditure in the name of parties when caught by EC observers.
According to the fresh guidelines, if a candidate does not intend to use the campaign vehicles for more than two days after obtaining permission from a returning officer, he shall intimate the returning officer to withdraw the permission.
Caste
The ‘upper’ castes: voting behaviour
What Johnny won’t see? Upper caste votebank
Why is the support of upper castes for the BJP secular, but that of Muslims for any party communal?
Ajaz Ashraf The Times of India
The 2009 National Election Study, which the Centre for the Study of Developing Studies (CSDS) carried out. It shows 44% of upper castes voted the NDA, down by 9 % from 2004, but the BJP’s decline was just 4%. The UPA bagged 33% of their votes, the Left 10%, the BSP 3%, and Others, a category comprising parties neither in the UPA nor the NDA, 12%. In the 1999 elections, the BJP alone bagged nearly 50% of upper caste votes. [This indicates] an upper caste consolidation
But the incidence of consolidation is far more among other groups, [detractors argue]. The same CSDS study shows 31% of upper OBCs voted the UPA, 27% the NDA, 3% the BSP, 2% the Left, and 37% Others. Take the Dalits, of whom 34% voted the UPA, 15% the NDA, 11% the Left, 21% the BSP, and 20% Others. As for the Muslims, some 47% voted the UPA, of which the Congres bagged 38%, 6% the NDA, 12 % the Left, 6% the BSP, and 29% Others.
This statistical evidence tells a few things. One, other social groups boast as diverse a voting pattern, if not more, as existing among upper castes. Two, voting patterns among all social groups fluctuate over elections. Three, every social group is strongly inclined towards one or two parties which it believes represents its interests.
The tendency to search for Muslim consolidation dates back to the Mandir-Mandal politics, which saw upper castes in significant numbers desert the Congrss for the BJP. But their heft was diminished because Muslims and Dalits, who had sustained Cogress domination for decades, didn’t follow them into the BJP. The myth of Muslim consolidation helps spawn mobilisation of Hindus to offset the numerical disadvantage of upper castes, among whom the BJP is most favoured.
True, Muslims vote tactically in every constituency to vanquish the BJP.
The author is a Delhi-based journalist
Scheduled caste (‘reserved’) seats in UP: the trend
Sub-caste challenge awaits BSP in reserved seats
TIMES NEWS NETWORK The Times of India
Lucknow: BSP may be rushing in to campaign for candidates in reserved constituencies in UP, but past experience shows that the party has performed poorly in these seats.
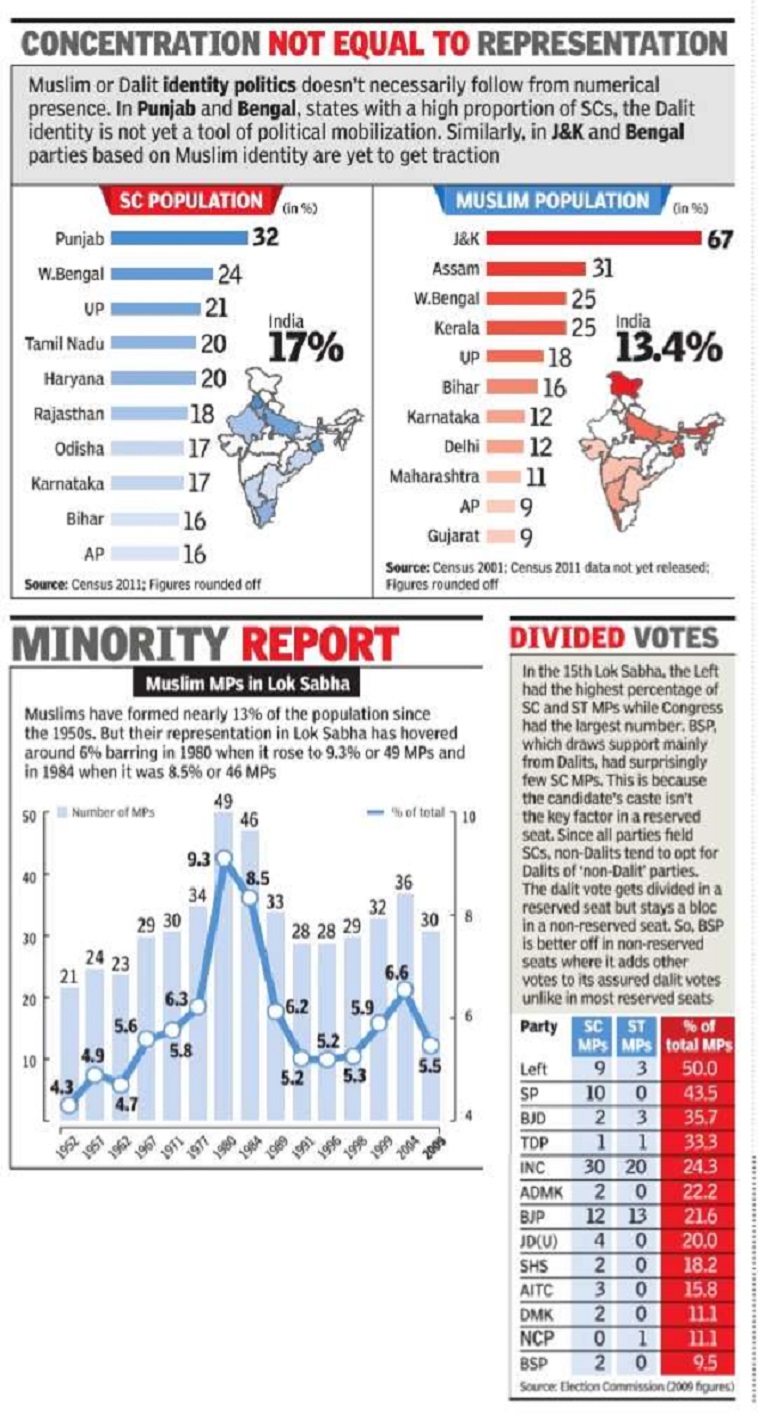
In 2009, BSP, which claims to be a party of dalits, was able to register a win in only two of the 17 reserved constituencies. Experts say the stumbling block is not only the uncertain transfer of Brahmin votes to dalit candidates but also that sub-castes within the scheduled castes (SCs) make it tough for the party to sail through.
While the BSP won Lalganj and Misrikh seats, its arch-rival, the Samajwadi Party (SP), won nine reserved seats, the Congres three and the BJP two. And the BSP has never won from reserved seats such as Nagina, Shahjahanpur, Hardoi, Basgaon, Mohanlalganj and Bulandshahr.
“Even this time, the Brahmin votes are unlikely to be transferred to the party,” said a district coordinator in a reserved constituency. “Since all parties put up SC candidates on these seats, the question of sub-castes in the SC category comes into play.”
C S Verma, a senior fellow at the Giri Institute of Development Studies in Lucknow, says that local-level politics come into effect in the reserved constituencies. “There’s a clear-cut fragmentation within the dalits.”
On the other hand, the BJP has the support of upper castes and some backward classes. Hence, the SP and the BJP score over the BSP in reserved constituencies.
Studies show out of 66 SCs, Chamars have the highest number, constituting 56.3% of the total SC population. Pasis happen to be the second largest group, forming 15.9% of the SC population. These two sub-castes combined with Dhobis, Koris and Valmikis constitute 87.5% of the total SC population.
While Chamars are concentrated in Azamgarh, Jaunpur, Agra, Bijnor, Saharanpur, Gorakhpur and Ghazipur districts, Pasis are is in Sitapur, followed by Rae Bareli, Hardoi and Allahabad. The other three major groups — Dhobi, Kori and Valmiki — have the maximum population in Bareilly, Sultanpur and Ghaziabad districts.
Conduct during elections: Model?

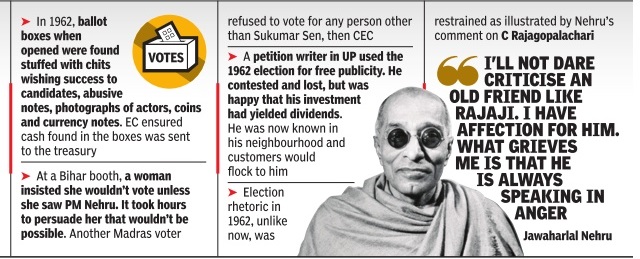
Legality of election-eve promises
The Times of India, Jul 20 2015
Dhananjay Mahapatra
Can parties be forced to fulfil promises made on eve of elections?
Political parties too issue manifestos prior to elections, promising many things. Politicians seek votes from citizens by telling them that if they are elected to power, their party will fulfill the election promises.
Tamil Nadu presents a good case study where arch-rivals DMK and AIADMK try to outdo each other with election-eve promises, which include free distribution of household items. For the 2006 assembly elec tions, the DMK's manifesto promised free distribution of colour TV sets to each household which did not possess the same, if it was elected to power.
DMK justified distribution of free colour TVs saying it provided commoners with recreation and general knowledge to housewives, especially those living in rural areas.DMK and its allies emerged victorious in the elections. To fulfill the poll promise, a policy decision was taken to provide one 14-inch CTV to all eligible families. To implement it in a phased manner, budgetary provision of Rs 750 crore was made.
For the 2011 assembly elections, the DMK again promised a raft of freebies if it returned to power. More than matching the DMK's promises, AIADMK too announced free gifts. It promised mixergrinders, electric fans, laptop computers, 4 grams of gold `thalis', Rs 50,000 cash for a girl's marriage, green houses, 20 kg of rice to all ration card holders, even to those above the poverty line, and free cattle and sheep.
The AIADMK and its allies swept the elections in 2011.Like DMK, it took steps to ful fill the promises.
S Subramaniam Balaji challenged the distribution of freebies by both parties, term ing it a corrupt practice to lure voters and also against right to equality as the free gifts were not meant for all voters.
The Supreme Court on July 5, 2013 decided Balaji's petition and ruled, “Promises in the election manifesto do not constitute corrupt practices under the prevailing law.“
However, it directed the Election Commission to frame guidelines for election manifestos and decide whether it could be included in the model code of conduct for the guidance of political parties and candidates.
“We are mindful of the fact that generally , political parties release their election manifesto before the announcement of election date, in that scenario, strictly speaking, the Election Commission will not have the authority to regulate any act which is done before the announcement of the date. Nevertheless, an exception can be made in this regard as the purpose of election manifesto is directly associated with the election process,“ the SC had said.
In the 2014 general elections, the Congress-led UPA was trounced by the BJP-led NDA after Narendra Modi succeeded in driving home the hope of “acche din aayenge“ (good days will come). The UPA regime was perceived so bad by the citizens that they lapped up the promise of “acche din“.
How can one quantify “acche din“? It is no colour TV or grinder-mixer that one can examine its quality . Good days for whom? And how will it come? If it comes, how long should the voter wait? And how long will it last? Election promises are a tricky affair. Citizens express their verdict on whether the promises were met only after five years. Is defeat at the elections just punishment for not meeting the promises? Lord Denning, sitting in the House of Lords, had in Bromley London Borough Council vs Greater London Council [1982 (1) All England Law Reports] elaborated on election promises.
“A manifesto issued by a political party -in order to get votes -is not to be taken as gospel. It is not to be regarded as a bond, signed, sealed and delivered. It may contain -and often does contain -promises or proposals that are quite unworkable or impossible of attainment. Very few of the electorate read the manifesto in full. A goodly number only know of it from what they read in the newspapers or hear on television. Many know nothing whatever of what it contains.
“When they come to the polling booth, none of them vote for the manifesto. Certainly not for every promise or proposal in it. Some may by influenced by one proposal. Others by another. Many are not influenced by it at all. They vote for a party and not for a manifesto,“ he had said.
As an advice to political parties successful in elections, Lord Denning had said, “When the party gets into power, it should consider any proposal or promise afresh -on its merits -without any feeling of being obliged to honour it or being committed to it. It should then consider what is best to do in the circumstances of the case and to do it if it is practicable and fair.“
Constituencies: how many voters do they represent?
As in 2019
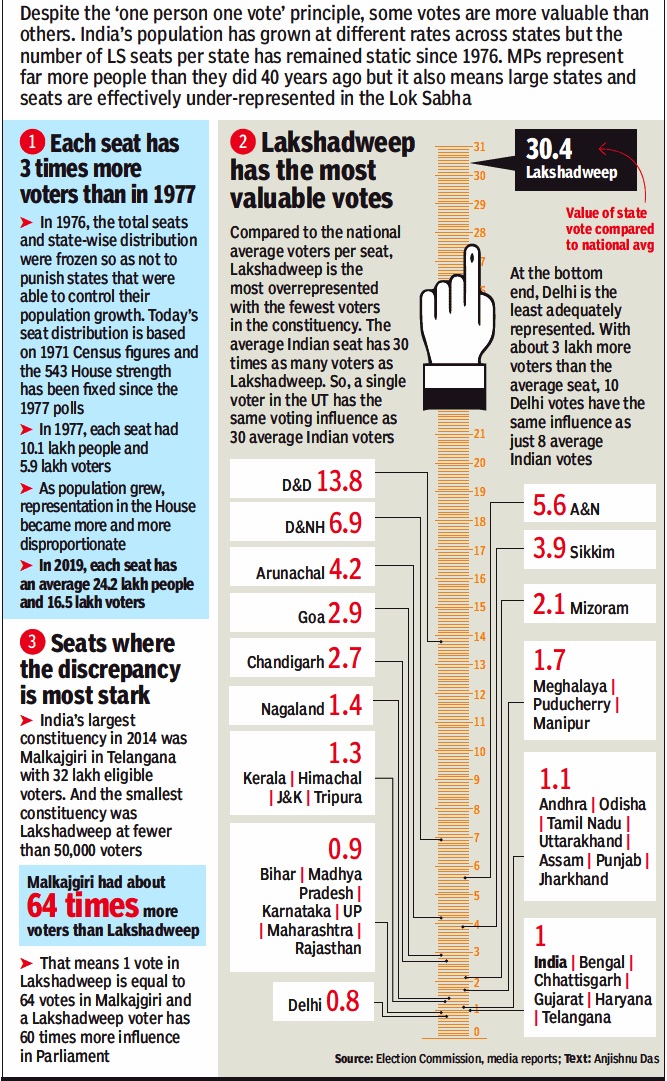
From: March 19, 2019: The Times of India
See graphic:
How many voters India’s parliamentary constituencies represent
Corruption, corrupt candidates
Corruption does not bother the voter
Is graft really a big election issue? Stats say otherwise
Deeptiman Tiwary TNN
New Delhi: Is corruption really an issue in elections? Some surveys claim people worry more about the economy than corruption. Data for 2004 and 2009 general elections show that not only do parties continue to repeatedly field candidates facing graft charges, people even vote for them.
Analysis of affidavits filed by Lok Sabha candidates shows that in 2004, parties fielded a total of 12 candidates facing cases under Prevention of Corruption Act (PCA). Of them, nine won. In 2009, 15 candidates with PCA cases were in the fray with four emerging victorious. Both elections combined, 27 such candidates contested and 16 of them won — a success rate of almost 60%.
Data also shows only one of 2004’s winners (SP’s Rashid Masood) with graft cases lost in 2009. Of the nine winners in 2004, only three (including SAD’s Rattan Singh and RJD chief Lalu Prasad) contested in 2009. Among other winners of 2004, BSP chief Mayawati was UP CM at the time of the 2009 polls and SAD’s Sukhbir Singh Badal was Punjab deputy CM. One candidate died while others did not contest.
A recent survey by Lok Foundation and University of Pennsylvania’s Centre for Advanced Study of India says corruption has found some traction with voters this election, but is still at second position compared to economic growth.
Social and political theorist and Centre for the Study of Developing Societies professor Aditya Nigam says though people seemed to have accepted graft as a part of life until recently, this election could be different. “Giving bribes at every step for decades had made people accept corruption as their destiny. But the Anna Hazare-led anti-corruption movement and Arvind Kejriwal’s AAP have changed that feeling. Economic growth is too abstract an idea to attract masses unless someone breaks it down for them.”
Indeed, the perception is corrupt leaders can move things
April 28, 2018: The Times of India
‘The perception is corrupt netas can move things’
Set aside the grandstanding on cleaning up politics, the return of the Reddy brothers, to BJP in Karnataka has turned back the focus on the ‘winnability’ of corrupt netas. Political scientist and senior fellow at Carnegie Endowment for International Peace Milan Vaishnav talks to Jayanth Kodnani about the “perplexing cohabitation” of criminality and democratic politics as discussed in his recent book on why parties field the corrupt and why voters elect them, When Crime Pays. Extracts from the interview
Your study shows the tribe of corrupt netas in the poll arena is growing. What explains this
• The reason is two-fold. First, parties are desperate to identify wealthy, selffinancing candidates. Those involved in criminal activity have both the ability and incentives to deploy resources to winning electoral office. From the voters’ perspective, candidates often use their criminality to signal their credibility... There is the perception that tainted politicians “know how to get things done”.
Do voters elect them in spite of knowing their criminal bona fides?
• Research demonstrates that voters are wellaware of the details of candidates they support. Perversely, they vote such candidates because of, not despite, their criminality. A politician with criminal background manages to create an aura of a “godfather”.
Does the seriousness of criminal charge make a difference in choice of candidates — say, between a white collar crime and one of murder?
• The dominant strain in the data is ‘blue collar’ crime, for lack of a better word. These are politicians associated with physical acts of abuse and/or throwing their weight around. While it is true that a large number of politicians are suspected of white -collar offences, politicians exclusively linked with white-collar crimes do not enjoy the same level of popular support, in my view. People ask: what’s in it for me?
Do tainted politicians use additional identity groupings (caste, region or sect) for ‘dabangg’ influence?
• Caste and identity are inextricably tied to the dabangg image. Almost all strongmen mobilise their social identity (caste or religion). This allows them to slice and dice the electorate in their favour, at the same time establishing their bona fides with supporters with whom they share fundamental affinity. The politician’s criminality is then cast in terms of protecting the status of his or her community as a defensive. It reinforces the idea of a Robin Hood narrative.
Is abusive trolling online muscle flexing?
• It’s a way of asserting presence, much like advertising. The difference is the degree of individual and group targeting, which can be very sophisticated. It is a way for politicians to assert their viability and demonstrate their credibility.
‘Deposits’ (Election deposits)
Forfeitures in 2014-16
Sivakumar B, EC bags Rs 36cr in lost deposits since 2014 polls, Oct 20 2016 : The Times of India
Election Commission of India has collected Rs 36.17 crore since 2014 from more than 27,000 candidates who didn't poll the required minimum number of votes in state and Lok Sabha elections and forfeited their deposits. In the past two years, EC has conducted one Lok Sabha poll and 14 assembly elections.
In assembly elections, Maharashtra has the maximum number of candidates who have lost their deposit followed by Tamil Nadu. In Maharashtra, candidates lost deposits worth Rs 3.12 crore and worth Rs 2.97 crore in Tamil Nadu.
In 2014 Lok Sabha poll, 7,000 candidates lost their deposits, which comes to Rs 16.07 crore.Candidates need to get at least 16th of the total valid votes polled in the constituency to secure their deposit, but many independents and candidates from smaller parties fail to do so.
Expenses of candidates
2014

From: March 19, 2019: The Times of India
See graphic:
What candidates in the 2014 elections claim they had spent on electioneering
‘Inauspicious’ periods
Holashtak days of March
Two days after nominations for the first phase of the 2019 Lok Sabha polls began, not a single candidate from any of the main political parties has filed his papers here. The chief reason: Holashtak, or a period of eight days preceding Holi that is considered to be highly inauspicious. In 2019, Holashtak began on March 14 and will end on March 21, when the Holika fire is lit.
It is believed that during the period of Holashtak, a host of heavenly bodies, along with the feared astrological quantity called Rahu, undergo transformations that make it inadvisable to hold auspicious ceremonies during this time.
Said BJP’s former state president Laxmikant Bajpai, “A Hindu contestant will not file his nomination before the culmination of Holashtak as any work done during this period becomes counter-productive.”
Somesh Kumar, additional district election officer in Meerut, said, “Nomination forms start coming in from the second day, but no form was filed here on Tuesday. Some of them are delaying it for religious reasons.”
According to astrologer Ashwini Tripathi, “During the Holashtak period, cosmic changes take place that minimise the intensity of rays of the Sun, which is the main provider of energy to Earth. Because of this, the period is considered inauspicious.”
Indira Bhati, the Congress candidate from Bijnor, cited Holashtak for delaying the filing of her nomination. “I will file my papers after Holi when the time is auspicious.”
Independent candidates
More Independents win in Karnataka than other big states
Chethan Kumar, April 28, 2018: The Times of India
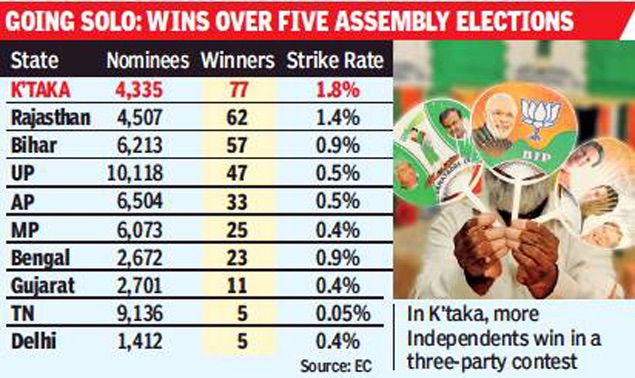
The years when the five elections counted took place have not been mentioned, but the time span could be assumed as roughly 1990- 2015
From: Chethan Kumar, April 28, 2018: The Times of India
HIGHLIGHTS
Results of 50 elections show that nearly 2% of Independents in Karnataka stand a good chance of winning.
Barring Rajasthan, no other state has offered more than 1% chance of winning.
One factor that ups their winnability is the fact they are rebel candidates, says analyst Harish Ramaswamy.
Disgruntled individuals across parties have sworn to defeat their parties’ official candidates after being denied tickets ahead of the May 12 assembly election in Karnataka.
While some have already joined rivals, others are likely to contest as Independents, with potential to cause upsets across the state. Over the past five elections, Independent nominees in the state have had a better chance at winning than similar candidates in 10 major states.
Results of 50 elections — five each in Karnataka, Andhra, Tamil Nadu, UP, Gujarat, New Delhi, Bihar, Rajasthan, Bengal and MP — show that nearly 2% of Independents in Karnataka stand a good chance of winning. Barring Rajasthan, no other state has offered more than 1% chance of winning.
One factor that ups their winnability is the fact they are rebel candidates, says analyst Harish Ramaswamy. For example, Belur Gopalakrishna, denied a ticket by BJP in Sagar, has said not only would he not back Hartal Halappa (who got the ticket), but would doubly ensure BJP is routed.
“Independents who make a difference are confident people who believe they have nurtured the constituencies. When they rebel and contest, they also take away a good portion of the party’s machinery,” Ramaswamy said.
The trend of Independents winning here started in 1983 when 22 such candidates won, says analyst S Mahadevprakash. Strong local leaders, especially at zilla panchayat levels, with about 30,000 to 40,000 votes under their influence can trigger upsets. “This happens every time there is a three-party fight. Local leaders snatch votes when the mandate is already fractured,” he says. UP’s seen the highest number of Independents contesting in the past five elections.
Landslides: Major electoral landslides
1951-2015
The Times of India Feb 12 2015
AAP's tally of 67 out of 70 seats in Delhi means it won about 96% of the total seats in the state assembly. An analysis of over 300 assembly elections held since Independence shows that the battle for Delhi was among one of the most one-sided ever. In terms of the proportion of total seats won by the largest party, AAP's sweep is the fourth largest so far. The previous three have all been in Sikkim. The Sikkim Sangram Parishad led by Nar Bahadur Bhandari won all 32 seats in 1989, the first instance of a 100% sweep. In 2009, the Sikkim Democratic Front led by Pawan Kumar Chamling repeated the feat. The SDF had in 2004 come close, winning 31 of the 32 seats
Length of polling process
1951-52

From: March 11, 2019: The Times of India
See graphic:
The length of the polling process in 1951-52
Why Indian elections have stretch for weeks since the 1990s
SA Aiyar, In Digital India, why do elections stretch for weeks?, March 10, 2019: The Times of India
In most democracies, polling occurs on a single day, and the counting of votes begins soon after polling ends. In the US, counting of votes in East Coast states can start before polling ends in West Coast states, which are in a time zone three hours behind the east. Typically, counting begins and election results are declared the same evening or next day.
But India takes ages to hold a poll, and the time between the first and last rounds of polling keeps rising. In the 2004 general election, polling in four phases took 21 days. In 2009, polling over five phases took 28 days. Polling in the 2014 election required no less than nine phases over 37 days.
Is India too large to organise elections in a day or two? No, even elections in a single state take weeks. The 2015 Bihar election was held in five phases over 24 days. The 2017 election in Uttar Pradesh required seven rounds of polling over 26 days.
Moreover, we have long gaps between the last day of polling and counting of votes. In the 2014 election, counting started three days after polling ended. A task taking a few hours in other democracies takes three days in India. This is not because of manual counting, as was the case in earlier decades. In recent times, all votes are recorded on electronic voting machines. But these are not digitally interlinked, and after polling, are kept in secure storage, with all political parties keeping guard, to check against hanky-panky. They are eventually all moved to counting centres.
Why does holding elections and counting votes take so long? In the early decades after Independence, polling was held mostly on a single day, with no violence. The main exception was in snow-bound areas like Kashmir and Himachal Pradesh, where elections took place later. By the 1960s, violent political clashes at election time caused many deaths. By the 1980s, the capture of polling booths and stuffing of ballot boxes by gangsters of sundry parties became a menace. The police and para-military forces were supposed to check this. But often the ruling party facilitated booth capture by its own goons, who were aided by manipulating deployment of security forces. Democracy was in jeopardy.
Chief election commissioner T N Seshan finally checked this in the early 1990s. He berated chief ministers and other politicians for booth capturing. He decided that the Election Commission and not chief ministers would control the deployment of security forces to ensure fair elections. He phased polling over several days so that security forces could be shifted from one polling zone to another. In time, this mostly ended booth capture by gangs. When officials or rival parties reported a capture, repolling would be ordered, making booth capture a failure.
1952-2014: votes received by the winning party
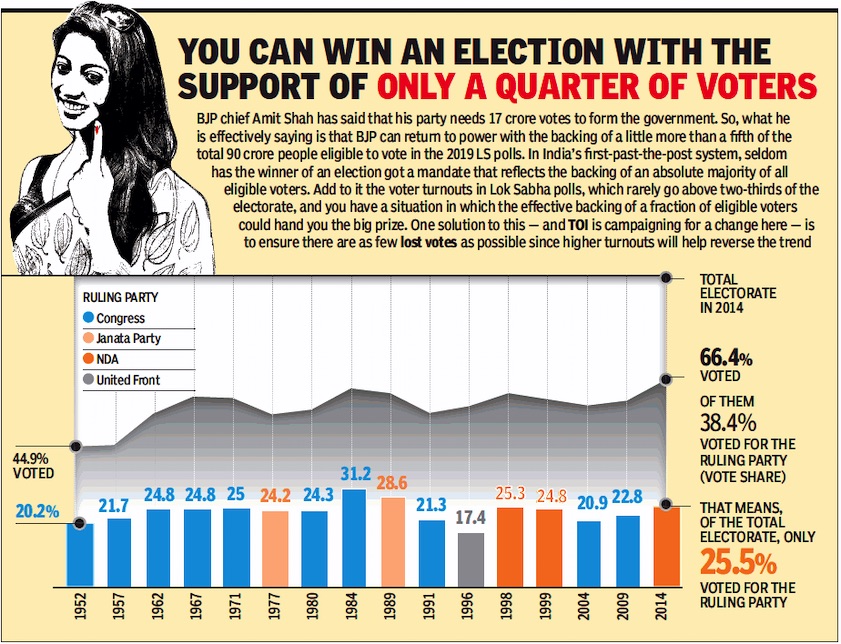
From: March 14, 2019: The Times of India
See graphic:
1952-2014: votes received by the winning party
Mandate: the representativeness of political parties
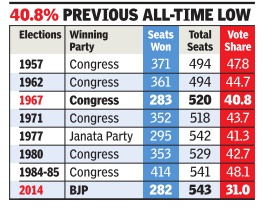
BJP's 31% lowest vote share of any party to secure majority
The Times of India May 19 2014
TIMES INSIGHT GROUP
The fact that BJP has won a majority on its own in the 16th Lok Sabha has, inevitably, drawn comparisons with previous polls in which parties won a majority on their own. (Chart1: The vote share of the winning party; Chart 2: Strike rate)
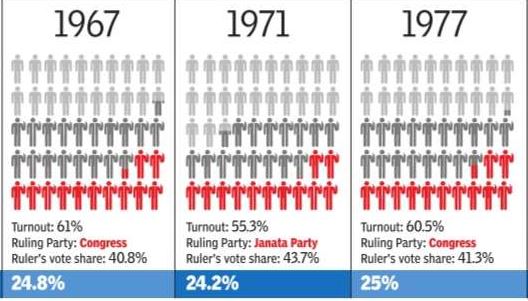
What has not quite figured in most of these comparisons is the fact that no party has ever before won more than half the seats with a vote share of just 31%. Indeed, the previous lowest vote share for a single-party majority was in 1967, when Congres won 283 out of 520 seats with 40.8% of total valid votes polled.
Far from spelling the end of a fractured polity, the 2014 Lok Sabha poll results show just how fragmented the vote is. It is precisely because the vote is so fragmented that the BJP was able to win 282 seats with just 31% of the votes. Simply put, less than four out of every 10 voters opted for NDA candidates and not even one in three chose somebody from the BJP to represent them.
Those who picked Congres or its allies were even fewer, less than one in five for Congres with a 19.3% vote share (which incidentally is higher than BJP's 18.5% in 2009) and less than one in every four for the UPA. Unfortunately for Congres, its 19.3% votes only translated into 44 seats while BJP's 18.5% had fetched it 116 seats.
With the combined vote share of the BJP and Congres -the two major national parties -adding up to just over 50%, almost half of all those who voted in these elections voted for some other party . Even if we add up the vote tallies of the allies of these two parties, it still leav es a very large chunk out.
The NDA's combined vote share was 38.5% and the UPA's was just under 23%. That leaves out nearly 39% -or a chunk roughly equal to the NDA's -for all others.
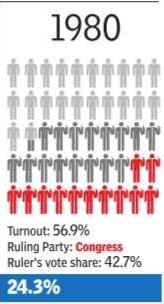
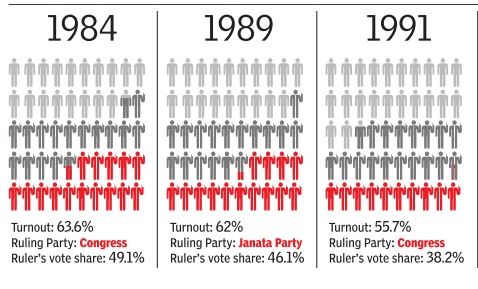
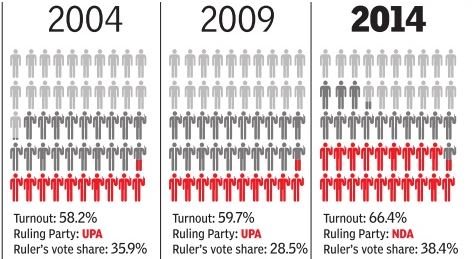
Is the 38.5% vote share for the NDA the lowest any ruling coalition has ever obtained? Not quite. The parties that constituted UPA-1 had just 35.9% of votes polled and the Congres won just 38.2% of the votes in 1991, when it ran a minority government under P V Narasimha Rao. But, except in 1991, they had to depend on outside support to keep the government afloat, which meant that the total vote share of those in the government or supporting it was higher.
In 1989, the National Front, consisting of the Janata Dal, DMK, TDP and Congres (S) won 146 seats and a vote share of 23.8%. To this were added the 85 seats and 11.4% of BJP and the 52 seats and 10.2% of the Left, taking the total, including those parties supporting from outside, to 283 seats and 45.3% of the votes.
In 2004, parties in the prepoll alliance stitched up by Congres had 220 seats and just under 36% of the votes. But the UPA then got outside support from the Left, SP and PDP, which between them had 100 seats and about 11.2% vote share. Thus, UPA-1 was formed with the support of 320 MPs and about 47% of votes.
The NDA does not need any outside support to form the government. Indeed, BJP can form it even on its own. But unless it ropes in others, the party will become the government with the lowest popular support in terms of vote share after the Rao government.
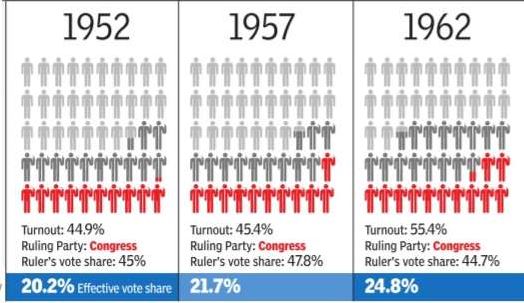
The mandate for the ruling party/ coalition: Its size 1952-2014
VOTE A MANDATE
The Times of India May 17 2014
When many choose not to vote and only a fraction of those who do opt for the ruling party, those in power could have a `mandate' that involves a really small proportion of all those eligible to vote. As the polity has fragmented, the `effective vote share' for the ruling party or coalition has shrunk.
One MP for 16,00,000 voters
Mind the gap: 1 MP for 16L voters
Keeping In Touch With Electors Tough
Subodh Varma | TIG The Times of India
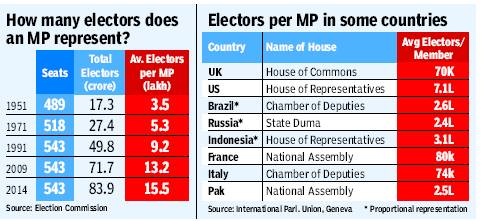
For the 2014 general elections, over 84 crore/ 840 million people are registered as voters as per the latest Election Commission figures. They will elect 543 MPs. That means on average, each MP represents over 15.5 lakh voters. That’s almost four and a half times the number of voters per MP in the first general elections held in 1951-52.
Voters have been increasing because population is increasing. But the number of seats in Lok Sabha has not increased since 1977. As a result, an MP has to represent more and more people with each passing election.
This anomaly gets stranger if you look at statewise averages of voters per MP. For the coming election, a Rajasthan MP will represent nearly 18 lakh voters on average, while one from Kerala will represent just 12 lakh voters. This is among the bigger states, not counting the smaller states and UTs where MPs can get elected with as low an electorate as 50,000 as in Lakshadweep or four to eight lakh in the Northeast.
In the 2008 delimitation, standardization of constituencies did not take place as it would have meant creating more constituencies in states like Rajasthan or Bihar with higher population growth rates, and cutting down in states like Tamil Nadu or Kerala with lower population growth, says election expert Sanjay Kumar, director of New Delhi-based think tank Centre for Studies of Developing Societies.
“It would have meant penalizing states that have successfully restricted their population. This was not fair,” he explained.
So, constituency numbers were kept the same within states, leading to the present anomalous ratio of voters per MP. Nowhere in the world is there such a high ratio of voters per elected representative. The closest would be the US where the average number of voters per House of Representatives member is about 7 lakh.
All this leads to an increasing disconnect between people and elected representatives, turning serious as elections approach. In two weeks candidates have to somehow contact 15 lakh people. With increasing restrictions on overt spending – on posters, vehicles or public meetings – the dynamic of contesting elections is fast changing. And so is covert spending. Increasing use of electronic media or Web-based platforms is also driven by this compulsion.
Once the MP is elected, the responsibility of staying in touch with the voters also is more difficult.
Although the MP is not supposed to be looking after day-to-day issues like roads or drinking water or whether doctors are there in health centres, in India’s topsy turvy democracy it doesn’t work like that.
“People expect their elected representatives to solve everything. They don’t make a distinction between what an MP is responsible for and what a local councillor is supposed to do,” says Kumar.
In reality, the elected representatives too don’t follow these distinctions when it comes to promises, so the people can’t be blamed.
So, what is the solution? In the future, there is no option but to increase the number of seats in the Parliament opines Kumar. But for now, the unwieldy electoral system will have to bumble along.
Are candidates elected by at least 50% of the voters?
Only 120 winning candidates in ’09 got over 50% votes
TIMES NEWS NETWORK
New Delhi: Is our democracy truly representative? Election Commission (EC) data on percentage of votes secured by winning candidates shows it may not be so. In the 2009 general elections, only 120 winning candidates out of the 543 could secure 50% or more votes polled in their respective constituencies.
This meant that on remaining 423 seats (nearly 78% of seats), the winning candidates had the approval of less than half of the electorate. Elections to the Lok Sabha are carried out using the first-past-the-post electoral system, in which the candidate securing the maximum votes of the total votes polled is declared elected, irrespective of the percentage of votes polled or the total number of eligible voters.
The EC data has a silver lining though. Delhi, Rajasthan, West Bengal, Kerala, Gujarat and Maharashtra are some of the better states in terms of consolidation of votes in the favour of winning candidates. While Delhi had six out of seven candidates winning more than 50% votes, Rajasthan was second best with 15 of the 25 winning candidates in that category.
Half of the 42 winning candidates in West Bengal secured the approval of more than 50% of the electorate. Among the worst performing states is Andhra Pradesh where only one out of 42 candidates could get more than 50% votes polled.
DELHI TOPS
Delhi first in vote consolidation, Rajasthan second
Half of the 42 winning candidates in Bengal got over 50% votes
Andhra the worst with only one out of 42 getting over 50% votes
Margins of victory: some records
1962-2014
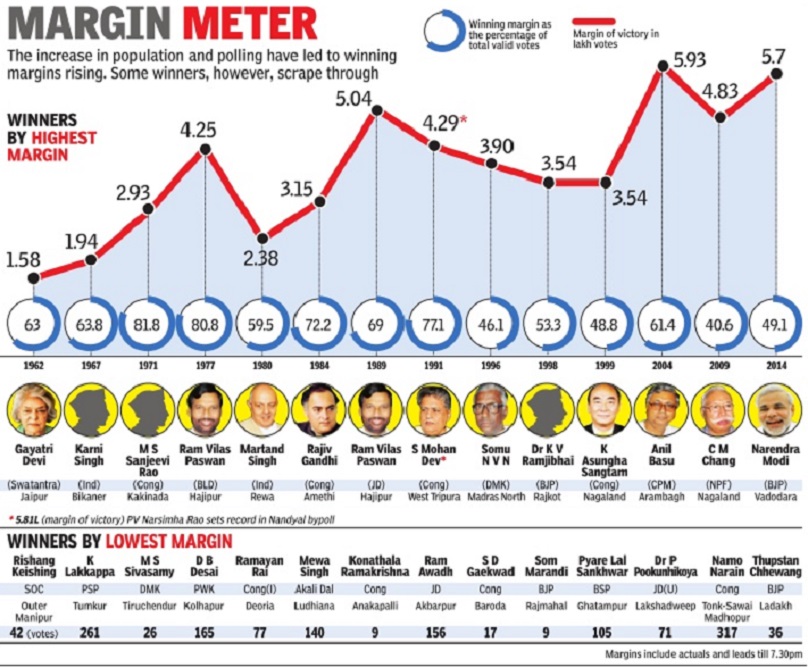
Source: The Times of India
See graphic:
MPs who got elected by the highest and lowest margins.
Pritam Munde, 2014

From: March 21, 2019: The Times of India
See graphic:
Pritam Munde’s record margin of victory, 2014
1989, 1998

From: March 25, 2019: The Times of India
See graphic:
The lowest margins of victory were recorded in 1989 and 1998
As a %age: Jardosh, 2014

From: March 31, 2019: The Times of India
See graphic:
Margins of victory as a %age: Jardosh, 2014
Muslim (and SC/ ST) representation in Lok Sabha
While this section is mainly about the Muslims, it also has statistics about SC and ST representation. The main difference is that there are no Lok Sabha seats reserved for the Muslims.
1952, 2014
Lowest no. of Muslim MPs since 1952
The Times of India May 17 2014
The representation of Muslims in the 16th Lok Sabha is the lowest since the first general election of 1952. The 16th Lok Sabha will have just 24 Muslim MPs, down from 30 in the 15th. That translates to just 4.4% of the strength of the House.
Muslims constituted 4.3% of the first LS, but their proportion has hovered between 5 and 6% for the last quarter of a century after dropping from a high of 9.3% or 49 members in the LS elected in the 1980 polls.
Reverse polarization is why Muslim votes did not count in UP and Bihar
The Times of India May 17 2014
No Muslim MP In UP For First Time Since Independence
Despite a concerted effort by “secular“ parties to get Muslims to vote en bloc against BJP , the saffron challenger prevailed largely because of what is being called “reverse polarization“.
In both UP and Bihar, which have a significant population of Muslims, the BJP pulled off big wins. Talking to TOI after the results were declared, BJP general-secre tary Amit Shah said his party succeeded “because the number of people who are not part of the politics of vote bank are much more“.
As per the 2011 Census, released by CVoter, Muslims are nearly 15% of India's 1.2 billion people. In 35 seats, they number around one in three voters or more. In 38 other seats, Muslims are 2130% of the electorate. If the 145 seats where they are 1120% are added to this, Muslim voters have the ability to influence the outcome in 218 seats. UP and Bihar, which have 120 seats between them, have 18% and 16% share of Muslims respectively . So the “secular“ gamble was not unreasonable.
In UP alone, out of 80 seats, 32 have a Muslim population of close to 15% or more. Yet, despite a serious pitch as the only force that could stop Modi, SP won only two seats, with 30 going to BJP . Curiously , the saffron party swept all eight constituencies, including Saharanpur, Amroha, Shrawasti, Bijnor, Muzaffarnagar, Moradabad and Rampur, where the Muslim population hovers around 40%. For the first time since Independence, UP has no Muslim MP.
The trend is similar in Bihar where out of the 17 seats where Muslims have more than 15% of votes, BJP has won 12. The remaining five have been shared by the RJDCongres-NCP combine and JD(U) which has got one seat.
Even in Maharashtra, which has Muslims constituting 14% of its population, BJP and its allies have swept the polls winning 42 out of 48 seats. The combine also won all the seats with considerable Muslim voters. In Mumbai and other Muslim-populated areas across Maharashtra, low polling in Muslim pockets and votes split between Congres-NCP and AAP made Muslim votes ineffective.
“In the Muslim-dominated Govandi area of Mumbai North-East polling was 40% while in the Gujarati-dominated Mulund, in the same constituency , it was 60%. And Muslim votes got divided between AAP's Medha Patkar and sitting MP NCP's Sanjay Dina Patil. This gave BJP's Kirit Somaiya a comfortable win,“ said Rais Shaikh, Samajwadi Party councillor from Govandi.
Pollsters, going by trends of past elections, say the Muslim vote is most effective where it is around 10% of the electorate, big enough to sway the result in a multi-cornered contest, by consolidating for a single candidate. Ironically , where Muslim presence is over 20%, their votes have been mostly ineffective. This is because of a multiplicity of Muslim can didates that divide their votes. In such constituencies, say psephologists, there is often counter-polarization of Hindu votes. In a polarized UP, it's the latter that seems to have helped the BJP. “In the future, Muslims will have to change their strategy and keep their options open,“ said M A Khalid of All India Milli Council.
NOTA, Use of
2014: state-wise use of NOTA option
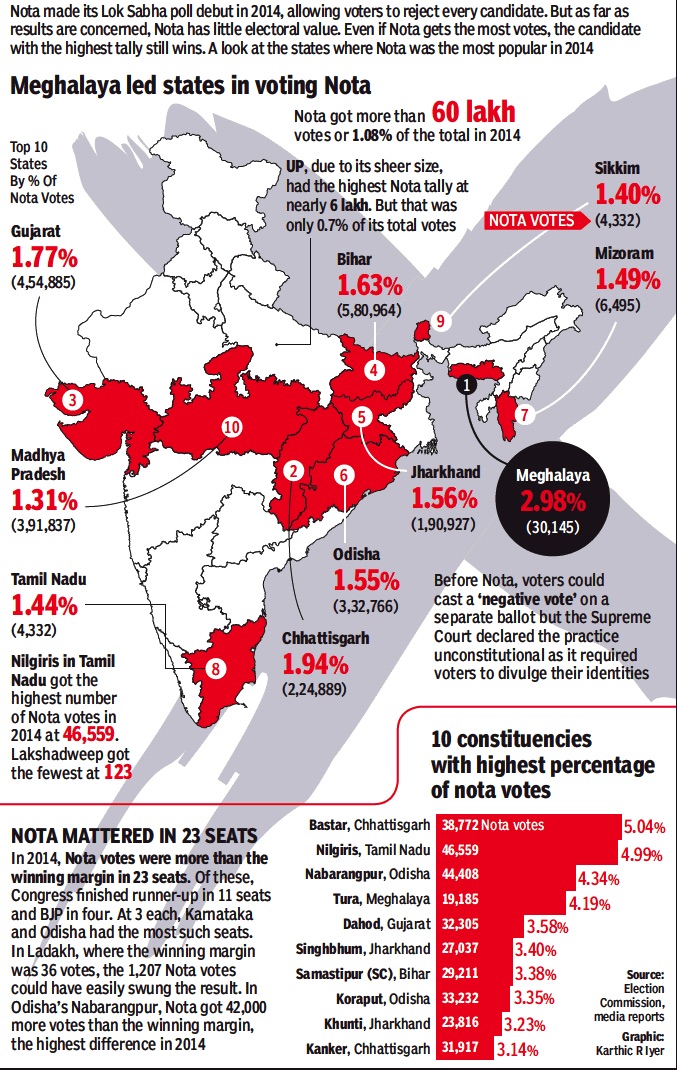
From: March 27, 2019: The Times of India
See graphic:
2014: the extent of the use of the NOTA option, state-wise
2016

See graphic:
None of the above’ (NOTA) votes cast in the 2016 Assembly elections in five states
Gujarat: NOTA is bigger than the no.3 party
The Gujarat elections this time were a lot closer than in 2012, so you might expect that margins in seatswouldbe a lottighter too. Surprisingly, BJP’s average margin is actually higher at 29,970 than last time’s 26,237. The Congress average of 13,354 is slightly lower than the13,577 it averaged in 2012.
That, in fact, goes a long way towards explaining why the race became so close despite BJP gaining 1.2 percentage points in vote share compared with 2012.
Nota (none of the above) too made its presence felt, exceeding the margin of victory or defeat in 29 constituencies, or about one in six seats. It cut both ways, with BJP winning 15 of these seats, Congress 13 and an independent one.
NRI/ overseas voters
2014, 2019: Keralites are the majority
Rajeev KR, 92% of overseas electors are Keralites, March 14, 2019: The Times of India
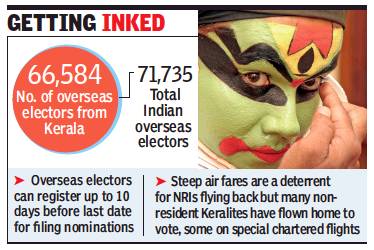
From: Rajeev KR, 92% of overseas electors are Keralites, March 14, 2019: The Times of India
The Malayali’s obsession with politics doesn’t end at the neighbourhood saloon back home. In fact, take Malayalis out of the country and they will still turn up to vote: Expats from the state account for 92% of NRIs who have registered as overseas electors.
The state witnessed a fivefold increase in the number of overseas electors — from 12,653 in 2014 to 66,584 as of January 30, 2019. Though the number is a small fraction of the country’s total NRI population of 1.3 crore, the fact that an overwhelming majority of the 71,735 overseas electors registered in the country hails from the state reflects the growing enthusiasm among non-resident Keralites to participate in the political process back home.
Of the total of 66,584 overseas electors from the state, 3,729 are women, as per EC.
Expat organisations from the state had conducted mass online voter enrolment drives in the Gulf, especially after Lok Sabha passed a bill in August 2018 to allow NRIs to appoint proxy voters who can cast their vote. Between October 2018 and January 2019, more than 40,000 expats registered as overseas electors. But the bill lapsed as Rajya Sabha failed to take it up.
As of now, NRIs can vote in their hometown after registering as overseas voters. There is no provision for online voting.
Polling stations
Accessible to disabled persons/ 2019
Anam.Ajmal, Booths without ramps may deny vote to 2L, April 2, 2019: The Times of India
From: Anam.Ajmal, Booths without ramps may deny vote to 2L, April 2, 2019: The Times of India
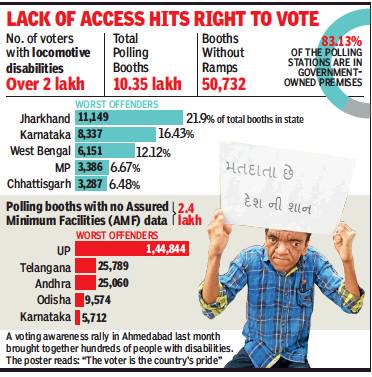
Many votes are lost because not all polling booths in India are accessible yet for disabled persons. According to data from the Disability Rights Alliance (DRA), an umbrella body of NGOs that work to make public places more accessible for disabled persons, there are at least 50,000 polling stations that are inaccessible to PwDs because they do not have ramps that would allow the use of a wheelchair for access.
DRA compiled the list of inaccessible polling stations by analysing EC data on psl.nic.in, a website which provides details of each polling station in India and its location. According to DRA, there are 2 lakh voters with locomotive disabilities who will be unable to vote because their polling stations do not have ramp facilities.
There are over 10.35 lakh polling stations across India. These should have “assured minimum facilities (AMF) which, as defined by EC, include a ramp, proper signage, wheelchairs and parking facilities for PwDs. But according to DRA, over 2.4 lakh polling stations do not have any information about the availability of AMFs. EC did not reply to a detailed email questionnaire sent by TOI.
According to Vaishnavi Jayakumar, a rights activist and DRA member, the “most visible” problem in polling stations is the lack of ramps.
Although Jayakumar admits that there has been a “huge push” towards making voting easier, there is a gap in implementation. “EC has done some ground-breaking work when it comes to pushing accessibility. They have progressive instructions, including the availability of vehicles for PwDs. But the implementation on the ground depends on the CEO of the state,” she says.
Polling stations in remote areas
Arunachal Pradesh: Malogam
Poll staff to trek for a day to reach lone voter in Arunachal, March 18, 2019: The Times of India
Election personnel will hike through the rugged and difficult terrain of an Arunachal Pradesh district bordering China for a day to ensure that the lone voter of a polling station can exercise her franchise.
Sokela Tayang lives with her children in Malogam, around 39km from Anjaw district headquarter Hayuliang. The area falls under Hayuliang constituency. According to sources, very few families reside in Malogam and all the voters, except 39-year-old Sokela, are registered in other polling stations.
“The station had two voters during the 2014 elections. Now, for some reason, Sokela’s husband Janelum Tayang has transferred his name to another booth under the same constituency,” sources at the office of the state’s chief electoral officer (CEO) said.
It will take a full day for the polling party to reach Malogam polling station from Hayuliang on foot, Deputy CEO Liken Koyu said.
“They may have to be in the polling booth from 7am to 5pm on the day of voting. We do not know when she will come. One cannot be forced to cast his or her vote early,” Koyu said.
Himachal Pradesh, 2019
From: March 15, 2019: The Times of India
See graphic:
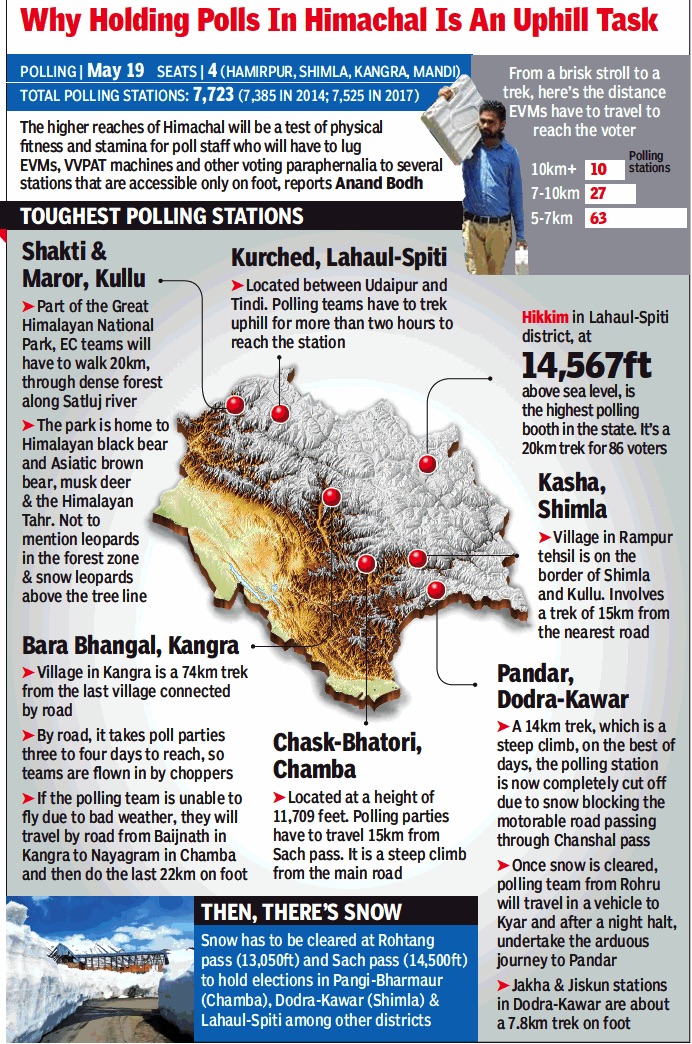
Polling stations in the remote areas of Himachal Pradesh, as in 2019
Political parties
Number: 1951>2014

From: March 13, 2019: The Times of India
See graphic:
The Number of political parties in Indian elections: 1951>2014
Political involvement of the public
2018: Indians among most involved
From: December 23, 2018: The Times of India
See graphic:
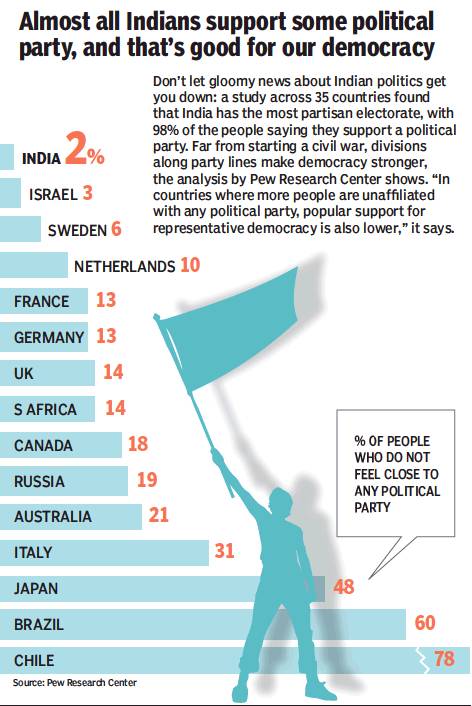
Among major countries, Indians were the most involved in politics, presumably as in 2018
Re-elected parliamentarians
1952-2014
RATE OF RETURN
The Times of India May 17 2014
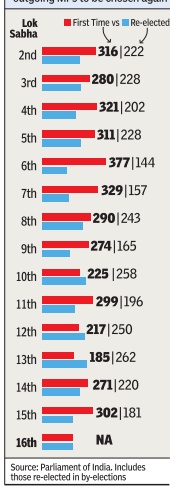
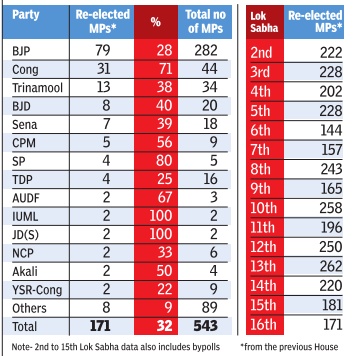
How many sitting MPs get re-elected and how many debutants does the LS typically have? Here (Chart: RATE OF RETURN) are the numbers for all the Houses so far, showing that it is rare for a majority of the outgoing MPs to be chosen again
GETTING BACK INTO THE HOUSE
The Times of India May 19 2014
BJP has the highest number of re-elected MPs in the 16th Lok Sabha while 70% of Congres MPs managed to duck anti-incumbency. So, those candidates who had a proven record as MP survived the Modi wave. Only in three elections -the post-Emergency election of 1977, 1980 poll that saw the return of Indira Gandhi, and the 1989 election after Bofors -did fewer MPs return to the House (Chart: GETTING BACK INTO THE HOUSE)
Security during the election process
Personnel deployed in 2014

From: March 26, 2019: The Times of India
See graphic:
Personnel deployed in 2014 during the LS elections
Trends
1952-2014: eight major trends
Prannoy Roy and Dorab Sopariwala, March 17, 2019: The Times of India
Anti-incumbency
From: Prannoy Roy and Dorab Sopariwala, March 17, 2019: The Times of India
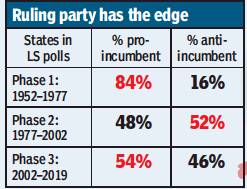
There is a widespread belief that most ruling governments are not re-elected by voters. In our analysis of big and medium-sized states, in the period 1977–2002, 70% of governments were thrown out by angry, dissatisfied voters. However, this has changed over the last 20 years. To put it simply, the anti-incumbency era is over. India is now going through what can be called a ‘Fifty:Fifty Era’. Governments today have a 50:50 chance of being re-elected. Governments that perform are voted back. Those that do not deliver are voted out. The angry voter has given way to a wiser, more mature voter.
Young voters, old MPs

From: Prannoy Roy and Dorab Sopariwala, March 17, 2019: The Times of India
Our members of Parliament are much older than the average age of voters. Once again, expect older candidates as the average age of members of the Lok Sabha has been rising with every election. Today, 59% of voters in India are young, between the ages of 18 and 40. But only 15% of MPs are between 25 and 40 years old. This means that 85% of MPs are of a different generation from the majority of voters. And it’s a widening age gap.
Women of India
From: Prannoy Roy and Dorab Sopariwala, March 17, 2019: The Times of India
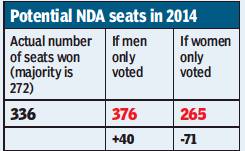
Women’s participation in elections has been rising much faster than men, and the next Lok Sabha elections could be the first time in India’s history that their turnout will be higher than men. But who do women vote for? Traditionally, the BJP has had a higher support base amongst men than women. Which is why the government’s free gas cylinder policy (Pradhan Mantri Ujjwala Yojana) was a perfect election campaign idea; it targeted primarily rural, women voters. All parties can now be expected to make similar promises targeting women in these elections. To illustrate how important the male voter is for the NDA, a simple simulation of the 2014 elections threw up two alternative scenarios. First, if only men had voted, the NDA would have won as many as 376 seats (40 seats more than the 336 that they actually won). Second, if only women had voted, the NDA would have won only 265 seats (71 seats lower than their final total in 2014 and 7 seats below the halfway mark of 272).
21 million missing women voters
From: Prannoy Roy and Dorab Sopariwala, March 17, 2019: The Times of India
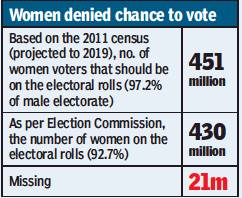
Early estimates suggest that as many as 21 million eligible women voters will be denied their right to vote in 2019 simply because their names have been excluded... To place this number of missing women voters in perspective: it is equal to 39,000 women missing in every constituency in this country.
Disappearing Independents
Having understood the unfairness of the first-past-the-post system, voters are increasingly ignoring Independents. The vote for Independents has dropped from 13% in the earlier years to just 4% today. Victims of the system, they will be all but irrelevant in this election.
Elections are not national but of federation-of-states

From: Prannoy Roy and Dorab Sopariwala, March 17, 2019: The Times of India
No longer a national election; it’s a true federation-of-states election
The number of seats won by regional parties has risen from an average of 35 Lok Sabha seats in the early phase after Independence to over 160 seats now, almost a third of the seats in the Lok Sabha, and the trend is decidedly upwards. Even more significant is the rapid increase in the votes that regional parties are now winning. In the early phase of Indian elections, regional parties won 4% of the vote, this has now risen to 34% of the national vote in Lok Sabha elections. The end of the all-India ‘uniform-swing’ will play a crucial role in the 2019 Lok Sabha elections. The importance of strong sub-national parties will create state-level swings and relegate the phenomenon of a national swing to a memory from the past. It’s probably best not to focus exclusively on the ‘Modi-Shah-appeal’ or the ‘Rahul-Priyanka-effect’ or even the ‘Modi-Rahul-contest’ in 2019. Increasingly, it is the ‘state-leader-impact’ that will be more relevant.
Opposition unity
From: Prannoy Roy and Dorab Sopariwala, March 17, 2019: The Times of India
What will be more important for victory: votes or dividing the Opposition?
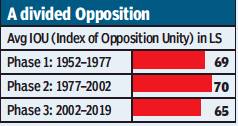
In the past, winning the popular vote yielded more seats than a fragmented Opposition. In fact in every Lok Sabha election victory between 1952 and 2002, the ruling party won about two-thirds of its seats because of a high popular vote and only one-third of the seats were won due to the effect of a divided Opposition. The impact of Opposition unity on seats is rising with every election, from an average of 33% in the first two phases to 45% in the last three Lok Sabha elections.
The ‘Bump’
On vote counting day, watch out for the ‘Bump’
Do not make the mistake of walking away from your television set on counting day when all the ‘leads’ are in. Major changes happen as more and more rounds are counted. Nothing sinister, it is merely a statistical phenomenon that happens in every election — and benefits the leading party, no matter which party is leading. The party that is ahead when all the leads are in gets an amazing ‘Bump’ in actual seats once all the results are in. For Lok Sabha elections, when all the 543 ‘leads’ are in but counting is still in progress, be prepared to add another forty-five seats to the leading party’s tally and subtract about the same number from the trailing parties’ total. In other words, be prepared for as much as a forty-five-seat Bump, or what could be up to a ninety-seat swing.
Edited excerpts from The Verdict: Decoding India’s Elections by Prannoy Roy and Dorab Sopariwala with permission [for The Times of India] from Penguin Random House India
Voter enrolment
Barely 40% go age 18-19 enrolled as voters
EC uses FB to reach out to young unlisted voters|Jul 03 2017: The Times of India (Delhi)
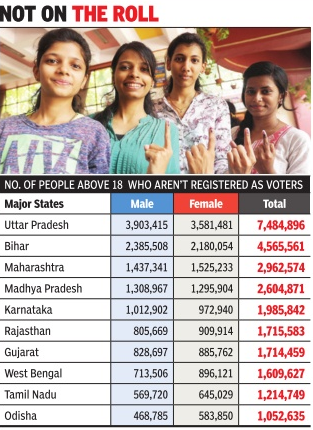
Barely 40% of the country's newly eligible voters in the 18-19 age group are currently enrolled as voters. In fact, in big states like Uttar Pradesh and Bihar, 75 lakh and 46 lakh young people have turned 18 but are yet to enlist themselves as voters. As per statistics compiled by the Election Commission as part of its special enrolment drive focused on young voters, 3.36 crore people in the 18-19 age group have not registered themselves in the voters list. The difference between electors and projected population in the age group is most prominent in states like UP, Bihar, Maharashtra and Madhya Pradesh, even as Kerala, Punjab, Andhra Pradesh and many smaller states are better off.
It is precisely this large gap that has prompted the EC to launch the month-long drive from July 1 to reach out to unlisted voters and persuade them through popular modes like social media to sign up. Elaborating on the special drive, chief election commissioner Nasim Zaidi told TOI, “Focus of the commission is mainly on young voters as we noticed that young voters are enrolled much less in number. In fact, 5-6 years ago, the registered youth as a percentage of eligible youth used to be 10%. In successive years, we have increased this enrolment percentage to 40% or so.But still, a large number of youth are not registered.“
“In UP , close to 75 lakh eligible young voters are yet to be enrolled. Likewise for many other states. So, we are launching a special campaign for enrolment of these young voters from July 1.This time we are making use of Facebook because young people are on Facebook.Facebook will issue reminders to all young voters between July 1 and 3, reminding them whether they are registered or not registered.If they are not, it will direct them to the National Voters' Search Portal, where they can fill the online application, which will then be pursued (at our end).“
A national call centre has been launched with tollfree number 1800111950. As part of the enrolment drive through July , the EC has written to all political parties seeking their cooperation to ensure its success.
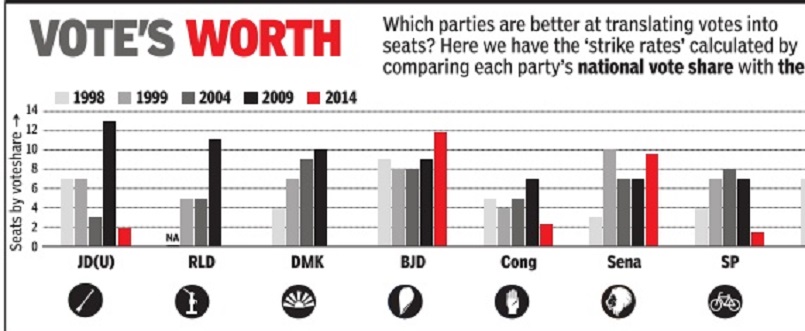
Vote percentage vis-à-vis seats won/ ‘Strike rate’
1996-2014: BJP more successful than Congress
From: Chethan Kumar, Lok Sabha elections: How BJP beats Congress in turning votes into seats, March 29, 2019: The Times of India
Much of BJP's dominance in electoral politics in the past five years has been credited to PM Modi and party chief Amit Shah. While the duo did lead BJP to a sweeping majority in 2014, the ground for that may have been laid much before their time.
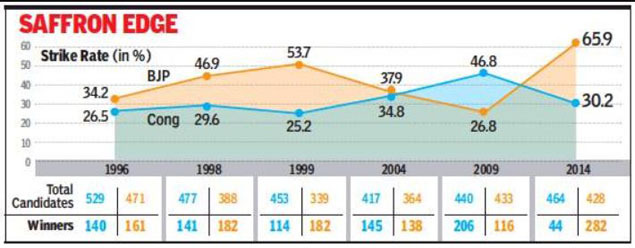
Analysis of election data from 1996 to 2009, including the two terms of the Congress-led UPA, shows that the strike rate of BJP contestants was far better than those fielded by the grand old party. The percentage of BJP candidates winning was higher in all but one election (2009), including in 2004 when the UPA-I assumed office.
That Congress also fielded more candidates than BJP could have affected its winning percentage, but as experts explain, "BJP's success in building a national narrative had been in the pipeline since 1992".
Veteran BJP leader BS Yeddyurappa told TOI: "Narendra Modi was a Gujarat CM and was working in that capacity for the party. But from the time of Vajpayee, we worked across the breadth and length of this country with leaders like Advani and Murali Manohar Joshi, and at a time all this was taking a more concrete shape, Modi was projected as the PM candidate and naturally it got converted into votes."
1n 1999, when the BJP-led NDA came to power under Vajpayee, 57% of BJP candidates had won, against 25% from the rival party.
In 1996, 34% of all BJP contestants won, compared to 26% of Congress candidates; in 2004, when UPA eventually formed the government, 38% of BJP candidates won, against 35% for Congress. In 1998 and 1999, when NDA ruled, BJP candidates had a much higher winnability record compared to Congress.
"You can map the timeline of how we grew from Gujarat and Rajasthan to Karnataka and the northeast. It was between 1996 and 1998 that the party emerged nationally. In 2014, we did reach the peak as there was 'partial consolidation' because of the spiralling growth of the middle class and youth which came in handy," BJP spokesperson Krishna Sagar Rao said.
At a discussion last month, psephologists spoke of how the 2014 LS polls were critical in setting the ground for a narrative on New India. "If BJP comes back to power you will see this narrative getting stronger by 2024. But even if the party fails to retain power, the idea won't die, such was the nature of the elections in 2014," said Suhas Palshikar.
"India Shining may not have worked for BJP electorally in that year (2004), but the exercise of building a national narrative that has engaged people had begun and that was the first attempt. Today, the Naya Bharat campaign is not just a linguistic nuance but a sustained effort at consolidation," Palshikar said.
1991-2014
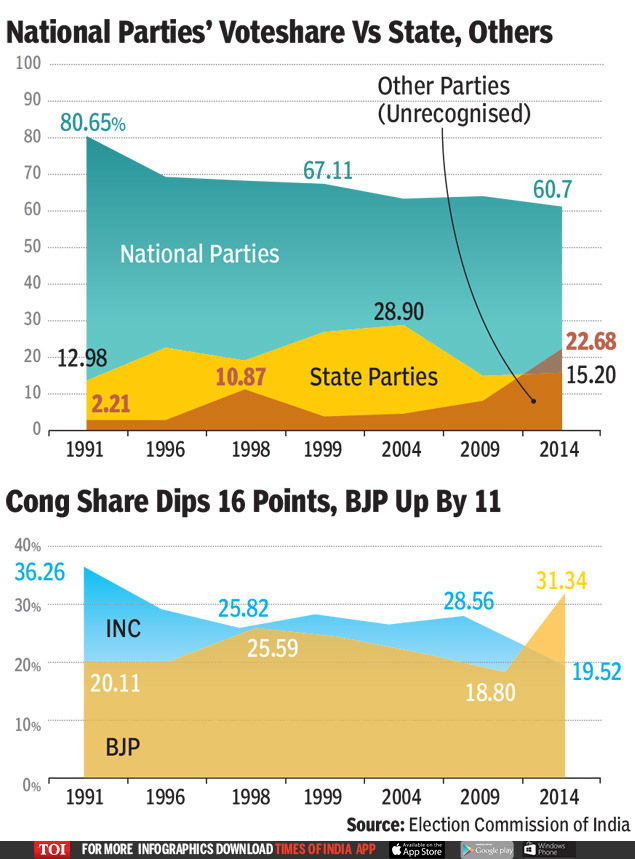
National Party voteshare vs state, others
Congress share dips 16 points, BJP up by 11
From: Chethan Kumar, How smaller players gained at national parties’ expense, April 4, 2019: The Times of India
The soaring graph of BJP, which took the party to a record 282 Lok Sabha seats and a voteshare of 31% in 2014 coincides with an inverse trend – the gradual fall in the voteshare of national parties as a whole, touching an all-time low of 60.7% that very year.
So, where did the disappearing national votes go?
The 2014 voteshare marks a staggering 20% dip since 1991 when national parties polled 80.7% of the votes. Election Commission data shows the votes lost by the national parties mostly went to unrecognised parties; this is evident as the other potential beneficiary, the state parties, recorded only a marginal increase in voteshare.
Comparatively, the share of unrecognised parties — including AAP and Trinamool Congress — has jumped to 22.7% in 2014, compared to 2.2% in 1991, fluctuating every year. Other than 2014, the best performance of such parties was in 1998, when they got 10.9% of votes.
The share of independents has more or less remained flat: From 4.16% in 1991, they got 3.06% votes in 2014.
To register as a state-level or national political party, an outfit must poll a certain percentage of votes or win a certain percentage of seats contested. All others are termed “unrecognised”.
“The decline in Congress’ share was not transferred entirely to BJP, or the Janata Party and Dal before that, which is why you see the cumulative dip. Janata Dal has split into several fragments, like RJD, SP, JD(S) and JD(U), all of whom collect votes in their respective states,” psephologist Sandeep Shastri said.
BJP improved its voteshare every election barring 2009 while Congress has consistently lost out. Even so, BJP’s best performance in 2014 elections (31%) does not overtake that of Congress (35.4%) in 1991.
Political analyst S Mahadevaprakash said: “Until the early 1990s, Congress had a strong consolidated vote bank. In UP for example, Congress got the votes of both the upper caste Brahmins and Thakurs and the minorities. Post-Mandal and Masjid, this broke. But BJP has not managed to consolidate that fully and no other party has grown in stature.”
In this period, there were three other major national parties — Janata Dal (JD), CPM and BSP — but none of them individually crossed 12% in any of the elections. With 11.84% of votes in 1991, Janata Dal performed the best among these three parties, while BSP with barely 4.2% was the worst. Compared to 1991, the share of national parties has dipped 20%.
The gap appears to have been filled by registered unrecognised parties whose voteshare surged from 2.2% in 1991 to 22.7% in 2014. At least 10% of this went to AAP (2%), Trinamool Congress. (5.2), All Jharkhand Students Union (1.4%), JD(S) and other regional parties.
Voter turnout
What does a high turnout signify?
High turnout doesn’t signal a wave
‘Long Queues Outside Booths Don’t Necessarily Mean Doom For Incumbent, Desire For Change’
Praveen Chakravarty The Times of India
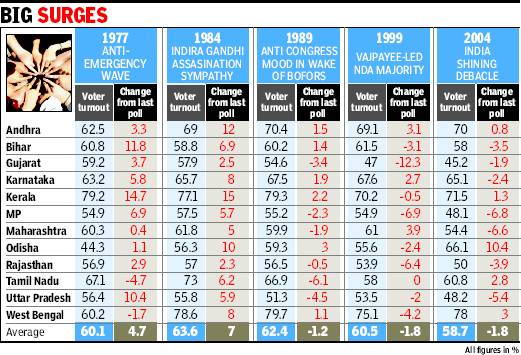
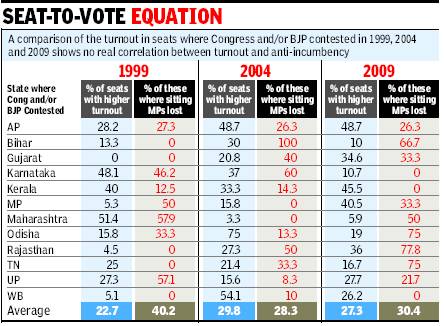
Television anchors, columnists and poll pundits have been taking the line that a high voter turnout in the current Lok Sabha elections is the result of a “wave” sweeping the country. The average turnout in the 438 constituencies that finished voting until April 30 reportedly shows an eight percentage point increase over the 2009 elections. As election chatter moves away from candidates, their wealth, wives and lineage to voter turnout and its significance, it is pertinent to ask two questions: Does high voter turnout correlate to any national trend? Does high voter turnout signal anti-incumbency?
This analysis (see box) studies five “wave” elections — 1977 (anti-Emergency), 1984 (Indira Gandhi assassination), 1989 (Bofors scandal), 1999 (Vajpayee wave) and 2004 (India Shining) and compares change in voter turnout vis-à-vis the previous election across the 12 largest states that account for 82% of all seats. The 1984 election after Indira Gandhi’s assassination, where a sympathy wave was said to turn the tide in favour of Congres, witnessed a seven percentage points increase in voter turnout in these 12 states versus the 1980 election, the highest-ever increase. And all 12 states saw an increased turnout in this election. The 1977 election, after Emergency was lifted, saw a 4.7 percentage point increase versus the previous Lok Sabha election (1971).
The other three supposed “wave” elections — 1989, 1999 and 2004 had a lower turnout than the polls immediately prior to them. Voter turnout numbers are not comparable and somewhat meaningless given the wild fl uctuations in voter lists across elections. It is not abundantly clear from data that higher voter turnout correlates with any national sentiment or wave.
The other popular perception is that voter anger leads to higher voter turnout and hence anti-incumbency. We analysed 1,174 constituencies across three elections in the 12 largest states for the last three elections (1999, 2004 and 2009) where Congres and/or BJP had a candidate contesting. The results show that there is no significant correlation between higher turnouts and loss for an incumbent MP. (Higher turnout is defined as higher than the previous Lok Sabha election and higher than the average turnout in that state).
In the 1999 election, 40% of incumbents lost where there was a higher voter turnout, 28% in 2004 and 30% in 2009. In other words, not even half of incumbent MPs lost the election when there was a higher voter turnout in their constituency. Hence, it is not possible to draw a direct correlation between higher turnout and anti-incumbency. There is also substantial variation across the 12 largest states in terms of anti-incumbency (see box). For example, in the 2004 elections in Bihar, every incumbent MP lost in a constituency where turnout was higher but in Madhya Pradesh, none of the incumbent MPs lost where turnout was higher. Similarly, in the 2009 elections, 75% of incumbents in Orissa lost but none in Kerala. It is evident that regional context is a far bigger driver of anti-incumbency than mere voter turnout or national sentiment.
Voter turnouts across most democracies are a fascinating trend to observe and paint themes. It is even more interesting in large and old democracies such as India and the US where voting is not mandatory and hence the choice to exercise one’s vote during a particular election represents a certain motivation. The sheer size of India’s national elections and Election Commission data make it plausible to analyse and tell stories of how we vote, why we vote and who we vote for. If we believe what we see in our politics is who we are as a society, electoral data can be a true mirror to ourselves.
(The writer is founding trustee, IndiaSpend, a non-profi t data journalism initiative)
Wars and election results
Do Indo-Pak conflicts affect elections? | March 2019 [ The Times of India
Indo-Pak conflicts and elections: 1965-1999
War and polls:
Indian and Pakistani armies have fought thrice: in 1965, 1971 and 1999. Elections after the 1965 war were held only two years later (Congress’ seat fell from 361 in 1962 to 283 in 1967) and the 1971 war happened eight months after an election that Indira Gandhi had won. Only the Kargil war (fought from May to July 1999) was immediately followed by that year’s Lok Sabha elections (held in October).
Lessons from Kargil:
After the victory in Kargil, the Atal Bihari Vajpayee-led BJP won 182 seats in Lok Sabha. So, how much of it was the impact of Kargil? Depends. BJP’s 182 seat tally was the same number as in 1998 but its overall vote share fell by 1.84% (which means it got fewer votes than in the previous elections). In politically crucial Uttar Pradesh, BJP’s vote-share went down 9% and its seat tally dropped from 57 (in 1998) to 29. The party also lost seats in some other big states (like Punjab). That means the electoral outcome did not match the outpouring of emotions during the two-month war. Does it mean, Kargil had no impact? A counter view is that the BJP government during the Kargil was only a caretaker government (though war allowed Vajpayee to function as a full-fledged PM) and their retaining the previous poll tally was itself the impact of the war (182 was the best the BJP had ever performed in history till then). Others point out that it wasn’t the war but Vajpayee’s charisma that got the votes for BJP as the opposition then was weak and Congress was turning out to be a party of rebels.
Women in the Lok Sabha
1952-2014
NO ROOM IN THE HOUSE FOR WOMEN
The Times of India May 17 2014
Women make up 49% of the population but only 7.7% of the total candidates (8,163) contesting in 2014 are female. One third of the 631 women candidates are independents. Congres had the largest number (57) while BJP fielded only 37. Women now often outnumber men in polling queues but clearly parties haven't woken up to this new scenario (Chart: Women in the Lok Sabha)
Women voters
2014> 2019: a sharp increase
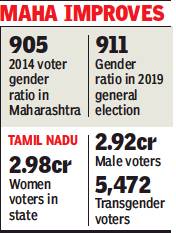
From: Bhavika Jain & Siva Kumar, Number of women voters is surging across the country, February 1, 2019: The Times of India
For a country that suffers from low sex ratios and female literacy rates, the 2019 general elections will herald a level of gender parity giving women voters a greater say. The latest enrolment data from two large states — Maharashtra and Tamil Nadu — shows the gap between the male and female voter base has narrowed considerably in one state, while in the other, the number of women voters has overtaken that of registered men.
The increase in enrolment of female voters in both states is in keeping with the broader national trend of improved voter sex ratios (number of women voters for every 1,000 male voters). In the 2014 polls, Kerala, Arunachal Pradesh, Manipur, Meghalaya, Mizoram & Puducherry already had more women in the electorate than men.
Tamil Nadu has now joined the club: of its 5.91 crore voters, as per the final revised rolls released on Thursday, 2.98 crore are women and 2.92 crore are men. The number of women voters in the state has increased by 11% against a rise of 8.5% for men in the last five years.
Women voters in Maha have increased by 13L
Maharashtra, where the voter sex ratio was traditionally skewed towards men, has shown an increase in women voters by 13 lakh in the latest round of enrolments. As per final rolls, there are a total of 8.73 crore voters in Maharashtra, of which 4.57 crore are male and 4.16 crore are females. The voter sex ratio this year is thus 911 against 905 in 2014.
“The voter sex ratio before 2014 was 875 or 880. It was then that we undertook a special drive to enrol more women to increase their representation,” said a senior official in Maharashtra. The drive in the states has involved door-to-door verification, contact programmes using educational institutions, and outreach through women self-help groups and networks such as those established by welfare schemes like the aanganwadis.
Over the past decade, there has been increasing emphasis at the national level to increase electoral participation of women in all states. The all-India sex ratio of voters had, from 715 female voters for every 1,000 male voters in the 1960s, improved to 883 female voters in the 2000s. It was 940 in 2011, the highest since 1971.
By 2014, all the southern states had voter parity or near parity between women and their male counterparts. Kerala, of course, had more women voters—a reflection of its overall sex ratio-—while TN, Andhra Pradesh and Karnataka had nearly the same number of voters of both sexes.
The increased participation of women — who have made up for 47-48% of the electorate in Lok Sabha elections dating back to 1971— and improved voter sex ratios also denote the success of the Election Commission in countering the impact of migration on electoral rolls. As highlighted by TOI through its Lost Votes Campaign, a large chunk of the potential electorate is unable to exercise its franchise because of changes in address. In the case of women, this is a crucial factor as many move house after marriage.
See also
Chief Election Commissioners Of India
Delhi: Parliamentary elections
Election laws, rules. procedures: India
Elections in India: behaviour and trends (historical)
Elections in India: behaviour and trends (2014)
India: A political history, 1947 onwards
Karnataka: caste, mutts and elections
Pakistan: Elections, 1937 onwards
Uttar Pradesh: Assembly elections
...and also
Indpaedia has
i) ‘Political history’ pages, state-wise, and a page for India as a whole.
ii) State-wise pages on assembly elections
iii) State-wise pages on local bodies’ elections
iv) State-wise pages on parliamentary elections.
